Modelling Ports Investment and Island
Economic Growth
Marcus Tukan
1, Tri Achmadi
2, Sjarief Wijaja
2, and Udisubakti Ciptomulyono
3AbstractThe port is a gateway region's economy. Investment performance is important that an effective and efficient port to ensure smooth supply chain needs of the region and promote economic growth. This study aims to model the port investment relationship with economic growth. Quantitative analysis and econometric modeling is used in statistical testing, studies typically classified in two areas, namely: the north and south islands of Maluku. The northern and southern regions and the increase in the loading dock term investment to drive economic growth, but the number of visits relation ship with economic growth negative influence.
Keywordsharbor, investment, growth, econometric
Abstrak—Pelabuhan merupakan gerbang perekonomian wilayah. Investasi menjadi penting kinerja pelabuhan
yang efektif dan efisien dapat menjamin kelancaran rantai pasok kebutuhan wilayah dan mendorong pertumbuhan ekonomi. Kajian ini bertujuan memodelkan hubungan investasi pelabuhan dengan pertumbuhan ekonomi. Analisis kuantitatif dan pemodelan ekonometrika digunakan dalam pengujian statistik, kajian diklasifikasikan pada dua tipikal wilayah, yaitu: Utara dan Selatan kepulauan Maluku. Wilayah Utara dan wilayah Selatan peningkatan bongkar-muat dan investasi panjang dermaga dapat mendorong pertumbuhan ekonomi, tetapi hubungan jumlah kunjungan kapal dengan pertumbuhan ekonomi memberikan pengaruh yang negatif
Kata kunci—pelabuhan, investasi, pertumbuhan, ekonometrika
I.INTRODUCTION7
aluku Islands as a province of the study is important and is intended to model the relationship between investment in the port with a typical island growth, needs to get massive length of the berth, and the growth of loading and unloading ships in an effort to boost economic growth to be achieved at a certain level.
Diversity and difference in potential resources and the availability of infrastructure owned by their respective island territories, creating a link between the islands of the other islands in the region itself as well as regional and international [1], these interactions have an impact on economic growth in the region diseputarnya, and will provide an overview of different approaches to the development of each region and can be classified based on the economic hierarchy.
The amount invested in the sector if the harbor is an important variable in terms of the parameters of the underlying infrastructure, among others: the size of the port [quay length (L), the width of the pier (B), the depth of the pool, and supporting facilities], optimal ship size [deadweight (DWT / GT), vessel length (LOA)], as well as ship traffic (call) in an effort to increase the role of optimizing the performance of the port to support the economic activity of the islands.
Port infrastructure investment is believed to encourage the economic growth of a region. Infrastructure and Long Run Economic Growth concluded that the positive effects of investment in transport and communication to economic growth [2]. That the transportation network has a positive causal effect on per capita growth rates
Marcus Tukan is with Fakultas Teknik, Universitas Pattimura, Ambon, Indonesia. Email: [email protected].
Tri Achmadiand Sjarief Wijajaare withFakultas Teknik Kelautan, Institut Teknologi Sepuluh Nopember, Surabaya, 60111. Indonesia. Udisubakti Ciptomulyonois with Fakultas Teknik Industri, Institut Teknologi Sepuluh Nopember, Surabaya, 60111. Indonesia.
across sectors such that the infrastructure must be having a real effect on the performance of the transport network and changes in economic behavior [3].
Measuring the impact of infrastructure investment on the development of a State, [4], as well as the achievement of certain economic level is believed to promote the development of the transport system more effective and efficient [5].
The process of implementation of sustainable development policies and infrastructure development is one important dimension in strategic planning will ensure the development of the region and the socio-economic development of a country, [6].
The infrastructure of the port area where the focus of the supply chain is to find the most effective and efficient in implementing value-added, in order to obtain a solution the complex issues related to consumer demand, [7].
Use of Transport Modes relationship with Sectoral Economic Growth in East Java, which uses observational methods restropektif with cross-
sectional times series, correlation analysis, index and index LQ Wilkirson found a strong relationship between transport and economic growth, [8].
In the islands for every increase of loading / unloading goods by 1%, ceteris paribus, to encourage the economic growth of 0413%, which is generally the Maluku region is dominated by the charge and the length of the loading dock at 1% can affect growth economics at 0.0150% [9]. Picture of the port as a gateway to the region's economy has become the slogan of many scientific discussions and written prologue scientific, as described in the theory Button explained that transportation has a positive impact on development and economic growth, and vice versa increased production of goods and services can be attributed directly to the improvement of transport [10].
developed to analyze the effect of transportation planning [11].
The extent to which causality between port infrastructure investment to economic growth of the islands remains to be seen. Dimanan close relationship between infrastructure and productivity [12]. The concept of bridging the global prospective to calculate the effect of transportation investment on both the micro and macro level, where the economic model was developed to analyze the effect of transportation planning [13].
The above statement raises the question of how much further investment in port infrastructure required to achieve a certain level of economic growth. This question needs to be answered so that the pattern of allocation of port infrastructure investment can be done efficiently and effectively, or at least a minimum requirement of infrastructure investment can be expected to harbor a certain level of economic growth that will be achieved, then the relevance of this study to be an important study.
Of the existing literature has not found konprehensip research on the long pier, unloading growth and the number of ship visits to local economic growth, this study will identify the model parameters port infrastructure investment relationship with the economic growth that has not done their research, identify the model coefficients scale port infrastructure investment relations and economic growth both in provincial kewilayaan and a typical archipelago.
The importance of transportation as a key development productivity and a contributor to the advancement of economic development especially for African countries and island states case, [14]. Econometrics is the integration of economic theory, mathematics, and statistics in order to test the truth of these theorems by using empirical data, [15]. Econometric model is generally intended for use in policy-making and forecasting a somewhat controversial, [16].
Theoretical approaches, port development investment relationship to economic growth of the islands can be attributed to the modified neoclassical growth theory with endogenous development theory. Neoclassical growth theory pioneered by (George H. Bort, 1960), [17] considers that the number of outputs (goods and services) produced by an economy is determined by the availability and the number of factors used. In the macro-scale (regional) output is the sum of all goods and services made within a certain period of time and if the price level multiplied by the number into the value of all goods and services produced in a period. While that is a factor of production Neoclassical classified into two major groups, capital and labor.
II.METHOD
The relationship between the output by the number of factors of production represented by the production function as follows:
Y = A f(K, L) (1)
where, Y is the amount of output, K is the amount of capital and L is the amount of labor, and A is the efficiency parameter which represents a contribution in
addition to capital and labor to the production activity. Parameter A also shows the level of technology used, the role of institutions, the level of efficiency and other factors in addition to capital and labor to coordinate capital and labor in creating value added or output.
In the Neoclassical model of an economy will grow if the number of factors used increases. Where only by increasing the number of factors produksilah economic activity can flourish, assuming efficiency has reached the maximum level.
Explicit model of the output by a factor of production, which is often referred to as the production function, it can take many different forms both linear and non-linear. In many empirical studies, the relation of non-linear Cobb-Douglas is often used to estimate the relationship of the input or output to input. Cobb-Douglas production function has several advantages in empirical studies, in addition to easy to use because it can be transformed into a linear form, and also very easy to interpret the results. Explicitly Cobb-Douglas production function can be written as follows:
Y = AKaLb (2)
where the parameter a is the magnitude of the elasticity of output (Y) to changes in the amount of capital (K) and the parameter b is the elasticity of output to changes in labor (L). For the purposes of estmasi parameters by using regression, Cobb-Douglas production function can be transformed into a linear form:
lnY = lnA + a lnK + b lnL (3 )
where the parameter a measures the magnitude of Y (%) as a result of changes in capital by one percent. For practical purposes, the Cobb-Douglas models can be modified by adding other relevant variables, so the number of input variables to be more than two. If the measurement of the effect of more than two variables, the simple analysis can be formulated as:
Y = a+bX (4)
where : a = constant
b = coeffisien of regression X
b =
, magnitude of the variable X a = - b
phenomenon of increased volume unloading could encourage economic growth can be expressed as follows;
PDRB = f (∑Load/Unload) (5)
Where the relationship between the growth of GDP (y) and the potential loading and unloading (x) can be expressed as a linear relationship or non-linear. For linear equations, relations x and y can be expressed by
y x1 (6)
variable (y) is expressed on the left side of the equation
.
and
called a parameter.
is the interceptwhen the value of x is equal to zero
.
also calledslope.
Slope stating how much change the loading / unloading if the GDP growth rate changes by one unit. Therefore, to accommodate the other variable is actually enough to affect the loading and unloading but not stated explicitly in the model we used the variable μ. So the relationship between the loading and unloading and GDP can be expressed by;
y x1 + μ (7) Where μ is a random error term or more commonly referred to as error term. Error is the difference between econometrics with mathematical equations in general. Equation 7 above is referred to as the econometric
equations or linear regression models.
If unloading and GDP growth showed a non-linear production function then for melinearkan function can be performed by logarithmic transformation, so that the Cobb Douglas functions will be: production, ie the percentage change in output as a result of one percent change in input
.
and
called a parameter.
is the intercept when the value of x is equal to zero.
also called slope. Slope stating how much change the loading// unloading if the GDP growth rate changes by one unit. In mathematical economics,Thus the elasticity equations unloading for input x (Load / Unload) is as follows: context of an empirical approach to the study conducted econometric equations can be estimated as follows, namely: unloading will be negative or no unloading goods in the absence of economic growth. Equation 14 that the availability of good infrastructure and adequate port (is positive) will drive the economic growth that will create a new kind of economic activity and that is expanding and equation 15 that economic growth, loading / unloading and the length of the dock would affect ship traffic that the need for
better infrastructure and adequate port will also increase.
B. Regional Overview
We divide the economic development in Maluku in two geographic areas, namely: the northern region includes the island of Ambon Moluccas, Ambon Seram
and Buru with the service center.
The southern region includes the islands of Maluku Tual, Dobo, Saumlaki and Kisar with Saumlaki as a service center. The division between the two areas can be seen in Figure 1.
C. North Region
Overall economic growth based on constant growth Maluku average during the years 2000-2010 amounted to 6.50% (Reuters - Tuesday, July 19, 2011), while the results of the analysis of the average growth over the past 11 years at 6.07% per year, and 66.322 % an economic contribution to GDP Maluku Northern Territory Rp. 5,026,755 in 2010, which last year contributed by: fisheries 17.418% agriculture, 2.036% animal husbandry, 28.206% trade and 2.149% mining industries. Port infrastructure as a gateway to the region's economy to ensure the smooth operation of the ship to lean back and do the loading and unloading of goods. Fluency in port will support the growth of the economy of a region. Of the long pier that has been obtained, it can be made an analysis of the rate of growth of port infrastructure in each region.
pier in the southern region of 746 m or 30.49% of the total length of the pier which was in Maluku. The number of ship visits Call 4066 or 62 487% of the total visits in the Moluccas, the total loading and unloading of goods 671 286 tons or 9125% of the total charge in the Moluccas. Number of people who inhabit the southern region of 395,697 people or 27,857% of the total population of the Moluccas.
Based on data from the Department of Transportation Maluku were then reprocessed using data spreadsheet, graphical overview of the growth of loading and unloading goods and GDP growth in the two regions can be seen in diagram 2.
III.RESULTS AND DISCUSSION
The model used in this study is a model of simultaneous equations with each of the two regions and Maluku well overall over-identified. Therefore, to produce good estimates required through two phases (Two-Stage Least Squares). To obtain estimates of each variable parameter information is needed in the system, since each equation is not independent and not all variables in each equation estimators are independent. TSLS estimation appropriately used in the system of equations in which each equation in a system of simultaneous equations over-identified. In principle, the usual OLS estimate TSLS is only performed in two stages. All dependent variables must be estimated in advance by all the independent variables in the system, and then substituted into the estimation of each equation that is as dependent variables estimator. This is to eliminate the link between all the independent variables in the equation with a confounding variable (error term).
A. North Region
lnLoad/Unload_North = - 926049+2.27 lnPDRB_North
(10)
lnLoad/Unload_South = 176548+0.327 lnPDRB_South
lnLP_South = 400 + 0.0001166 lnPDRB_South +
lnPDRB_Mlk= 727884 + 0.540 lnLoad/Unload_Mlk (15)
Model of the relationship between economic growth and port infrastructure [9] and many other factors for each region gives varying results, according to the characteristics of the northern and southern regions. To obtain a general model (Maluku), we need to modify the model to include the role of infrastructure areas, especially long dimension of the pier that is characteristic of each region.
In the model of a general nature (Maluku), the dimensions of the pier can be used as control variables to the impact of port infrastructure investment to economic growth. For this, all data areas combined into a pooled the data. Regional differences are reflected in the contribution of various sectors mentioned above in gross regional domestic product (GRDP).
From the estimation model using Minitab-15 software for the union of two regions in the period 2000-2010 in Table 1, where the value of Adjusted R-squared indicates that each equation in the model as a whole is quite high and ranged from 88.3% - 89.5%, the probability of 0.00, t-Statistic 8.75 where the closer the value of R-squared with 1 it can be said that the better model in explaining the data. Thus the diversity of each endogenous variable can be explained by the explanatory variables included in the model. Adjusted R-squared can also provide a better assess the relationship between the variables under study
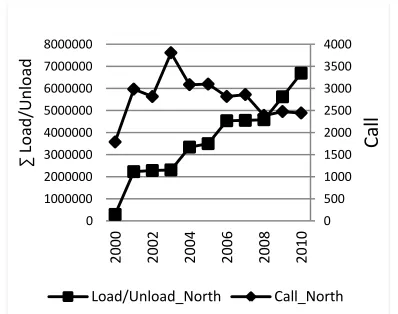
From the estimation above, it can be analyzed that the third equation, there are several constants determination which is positive and negative. Are positive constants considered in accordance with the "parameter alleged" that is positive. But the constant negative value does not match the "parameter alleged" that is positive. InPDRB for Maluku equation with dependent variable, it appears that economic growth is strongly influenced by a variety of variables in the model. Across the region, almost all the economic growth is affected by variations in the various variables in the model. Partially, all variables significantly influence economic growth. For every increase of the loading / unloading of goods by 1 percent, ceteris paribus, to encourage economic growth of 2.27% for the Northern Territory (Table 1), 0327% in the South Region (Table 2) and 1.66% Maluku (Table 3). The length of the berth by 1% effect on the economic growth of 0.0002% northern regions but provide a significant impact to vessel traffic (Call) in which 0.15% in the northern region. 0.0001% of the area south of ship visits (Call) 0.04% and 0.0002% Maluku ship visits (Call) 0.15%. Conversely Call vessel growth by 1 percentage pushing the length of the berth at 2.30% for the northern region, but occurs Maluku 3.16% decrease 0.51% in the southern region.
(Figure 5) indicating the increased loading capacity of the ship.
D. Simulation of Long Berth Investments Against Economic Growth.
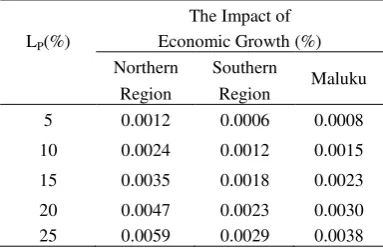
From the results of the econometric estimation, we can see the simulation of the relationship between economic growth and investment with the unloading of the archipelago. Where table 2 for each of the length of the berth (LP) of 5% will be able to drive economic growth indirectly by 0.0012% in the north, 0.0006% in the south and 0.0008% in the Maluku, while table 3 for ship visits (Call) the length dock by 5% to encourage the growth of ship visits for 0.755% of the northern, 0.206% of the southern and 0.750% of the Maluku. And to table 4 load-unload goods increased by 5% to stimulate economic growth by 11,350% for the northern region, 1.635% for southern region and 8.300% Moluccas, and so on can be seen in table 4, 5 and 6.
CONCLUSION
The results of studies on the northern and southern regions can be summed up some of the following: existence of inequality infrastructure and port performance can affect the supply chain needs of the region, where the R-squared statistical tests showed that each of the equations in the model as a whole has a fairly
strong correlation or close to 1, it can be said that the better model in explaining the data. where the northern region of 89.5% - 57.8%, southern region 92.9% -88.6% and 91.2% - 79.2% Maluku. Thus the diversity of each endogenous variable can be explained by the explanatory
variables included in the model. While
relationship between investment increase shelf dock with economic growth figures showed a less significant where for every increase of 1% long berth, simply push the economic growth of 0.0002% in the north, 0.0001% in the south and 0.0001% Maluku. but the growth of load-unload goods indicates significant economic growth in which to increase the load-unload by 1% to stimulate economic growth sebasar 2.27% in the northern region, 1.66% Maluku, but the south is only 0.327%.
Call vessel growth by 1% lead to the long berth at 3.17% for the northern region, 2.30% Maluku but became negative in the southern region of -0.51%. where for the northern region with increasing cargo ship which was followed by an increase in load capacity and the size of the entire length of the vessel (LOA) should be followed by the length of the berth (LP), to increase the load-unload activity can trigger the economic growth of the islands.
Figure 1. Zone Distribution Based on Geographic Region Maluku. Figure 2. Trend Growth of GDP and Load-Unload in Maluku Sources: Maluku Tatrawil reprocessed, 2006 Source: Results of Analysis
Figure 3. Growth Correlated Load-Unload and Pattern Ship Visits (Call) Northern Region 2010 Source: Results of Analysis
0 500000 1000000 1500000 2000000
0 1000000 2000000 3000000 4000000 5000000 6000000 7000000 8000000
2000 2002 2004 2006 2008 2010
P
D
R
B
∑Lo
ad
/Unl
oad
Load/Unload_North Load/Unload_South load/Unload_Mlk PDRB_North
PDRB_Mlk PDRB_South
0 500 1000 1500 2000 2500 3000 3500 4000
0 1000000 2000000 3000000 4000000 5000000 6000000 7000000 8000000
2000 2002 2004 2006 2008 2010
Cal
l
∑
Lo
ad
/Un
lo
ad
0 1000 2000 3000 4000 5000 6000 7000 8000
0 1000000 2000000 3000000 4000000 5000000 6000000 7000000 8000000
2000 2001 2002 2003 2004 2005 2006 2007 2008 2009 2010
Cal
l
∑
Lo
ad
/U
nl
oa
d
Load/Unload_Mlk Call_Mlk
0 500 1000 1500 2000 2500 3000 3500 4000 4500
0 100000 200000 300000 400000 500000 600000 700000 800000
2000 2002 2004 2006 2008 2010
Cal
l
∑
Lo
ad
/U
nl
oa
d
Load/Unload_South Call_South
Figure 4. Growth Correlated Load-Unload and Pattern Ship Visits (Call) Southern Region 2010 Source: Results of Analysis
Figure 5. Growth Correlated Load-Unload and Pattern Ship Visits (Call) Maluku 2010 Source: Results of Analysis
TABLE1.DEPENDENT VARIABLE LOAD-UNLOAD_North
Predictor Coeff SE Coeff
t-Statistic
Proba-bilitas
Constant -926049 552387 -1.68 0.128
PDRB_North 2.2750 0.2600 8.75 0.000
R-Sq = 89.5% R-Sq(adj) = 88.3%
TABLE 2.DEPENDENT VARIABLE LOAD-UNLOAD_South
Predictor Coeff SE Coef
t-Statistic
Proba-bilitas Constant 176548 46330 3.81 0.004
PDRB_South 0.32669 0.04612 7.08 0.000
R-Sq = 84.8% R-Sq(adj) = 83.1%
TABLE 3.DEPENDENT VARIABLE LOAD-UNLOAD_Maluku
Predictor Coeff SE Coef t-Statistic
Proba-bilitas Constant -787413 586245 -1.34 0.212
PDRB_Maluku 16618 0.1874 8.87 0.000
R-Sq = 89.7% R-Sq(adj) = 88.6%
TABLE 4.RELATIONSHIP BETWEEN INVESTMENT AND ECONOMIC
GROWTH LONG WHARF
The Impact of LP(%) Economic Growth (%)
Northern Southern
Maluku Region Region
5 0.0012 0.0006 0.0008
10 0.0024 0.0012 0.0015
15 0.0035 0.0018 0.0023
TABLE 5. RELATIONSHIP BETWEEN INVESTMENT LONG JETTY AND SHIPS CALL
The Impact of
LP(%) Call (%) Northern Southern
Maluku Region Region
5 0.7550 0.7550 0.7550
10 1.5100 1.5100 1.5100
15 2.2650 2.2650 2.2650
20 3.0200 3.0200 3.0200
25 3.7750 3.7750 3.7750
TABLE 6.RELATIONSHIP BETWEEN LOAD-UNLOAD
AND ECONOMIC GROWTH
Load -Unload (%)
The Impact of Economic Growth (%) Northern Southern
Maluku Region Region
5 11.3500 1.6350 8.3000
10 22.7000 3.2700 16.6000
15 34.0500 4.9050 24.9000
20 45.4000 6.5400 33.2000
25 56.7500 8.1750 41.5000
REFERENCES
[1] Sjafrizal, (2008), Ekonomi Rgional, Teori dan Aplikasi, Baduose Media, Praninta Offset, Padang Sumatera barat. [2]. David Canning,Peter Pedroni,Infrastructure and Long Run
Economic Growth Queen’s University of Belfast, Harvard University, (1999).
[3]. Banerjee, Esther, Nancy. Access to Transportation Infrastructure and Economic Growth in China, Mac Arthur Network for Inequality Conference in Beijing. 2009
[4]. Agénor, P. R., Moreno-Dodson B. Public Infrastructure and Growth: New Channels .
and Policy Implications. The World Bank Policy Research Working Paper 4064, 2006.
[5]. Harlan Pangihutan, Pemodelan Hubungan Investasi Prasarana Jalan Dengan Pertumbuhan Ekonomi Nasional Dan Regional, Kolokium Puslitbang Jalan dan Jembatan TA. 2008, pp 1-2
[6]. Grundey, D. Managing sustainable tourism in Lithuania: Dream or reality? Technological and Economic Development of Economy, 14(2), 2008, pp118-129.
[7]. Feame. A., D. Hughes., R. Duffy, Consepts of collaboration-supply Chain Management In Global Food Industry, J.F. Easthan., L. Sharples and S.D. Ball, Edition food Supply Chain Management : Issue for the Hospitality and Retail
Sectors Reed Educational and Professional Publishing. India, 2001, pp 55-89.
[8]. Achmad Muslim Hamzens, Hubungan Penggunaan Moda Transportasi Darat Dengan Pertumbuhan Ekonomi Sektoral di Jawa Timur, Disertasi Doktor Program Pascasarjana Universitas Air Langga, Surabaya. (2003), pp 36b.
[9] Marcus Tukan, Tri Achmadi, Sjarief Widjaya, (2012),
Selection Of Pilot Ports And Effect Of Long Dock Investments To Economic Growth An Islands, Academic Research International ISSN-L:2223-9553, ISSN:2223-9944 Vol.3 Number 3. pp. 207-220.
[10] Button, K.J., (1982), Transport Economics, London, Heinemann Educational Books Ltd.pp 245
[11] Weibroad G, F. Treyz, (1998), Productivity and Accessibility : Bridging Project Specification Macroeconomic an Analysis of Transportation Investment, Journal of Transportation and Statistics 65-79.