HOW TO THINK LIKE
BENJAMIN GRAHAM
AND INVEST LIKE
WARREN BUFFETT
L
awrence
A. C
unningham
McGraw-Hill
Copyright © 2001 by the McGraw-Hill Companies,Inc. All rights reserved. Manufactured in the United States of America. Except as permitted under the United States Copyright Act of 1976, no part of this publication may be reproduced or distributed in any form or by any means, or stored in a database or retrieval system, without the prior written permission of the publisher.
0-07-138104-X
The material in this eBook also appears in the print version of this title: 0-07-136992-9.
All trademarks are trademarks of their respective owners. Rather than put a trademark symbol after every occurrence of a trademarked name, we use names in an editorial fashion only, and to the benefit of the trademark owner, with no intention of infringement of the trademark. Where such designations appear in this book, they have been printed with initial caps.
McGraw-Hill eBooks are available at special quantity discounts to use as premiums and sales pro-motions, or for use in corporate training programs. For more information, please contact George Hoare, Special Sales, at [email protected] or (212) 904-4069.
TERMS OF USE
This is a copyrighted work and The McGraw-Hill Companies, Inc. (“McGraw-Hill”) and its licensors reserve all rights in and to the work. Use of this work is subject to these terms. Except as permitted under the Copyright Act of 1976 and the right to store and retrieve one copy of the work, you may not decompile, disassemble, reverse engineer, reproduce, modify, create derivative works based upon, transmit, distribute, disseminate, sell, publish or sublicense the work or any part of it without McGraw-Hill’s prior consent. You may use the work for your own noncommercial and personal use; any other use of the work is strictly prohibited. Your right to use the work may be terminated if you fail to comply with these terms.
THE WORK IS PROVIDED “AS IS”. McGRAW-HILL AND ITS LICENSORS MAKE NO GUAR-ANTEES OR WARRANTIES AS TO THE ACCURACY, ADEQUACY OR COMPLETENESS OF OR RESULTS TO BE OBTAINED FROM USING THE WORK, INCLUDING ANY INFORMA-TION THAT CAN BE ACCESSED THROUGH THE WORK VIA HYPERLINK OR OTHERWISE, AND EXPRESSLY DISCLAIM ANY WARRANTY, EXPRESS OR IMPLIED, INCLUDING BUT NOT LIMITED TO IMPLIED WARRANTIES OF MERCHANTABILITY OR FITNESS FOR A PARTICULAR PURPOSE. McGraw-Hill and its licensors do not warrant or guarantee that the func-tions contained in the work will meet your requirements or that its operation will be uninterrupted or error free. Neither McGraw-Hill nor its licensors shall be liable to you or anyone else for any inac-curacy, error or omission, regardless of cause, in the work or for any damages resulting therefrom. McGraw-Hill has no responsibility for the content of any information accessed through the work. Under no circumstances shall McGraw-Hill and/or its licensors be liable for any indirect, incidental, special, punitive, consequential or similar damages that result from the use of or inability to use the work, even if any of them has been advised of the possibility of such damages. This limitation of lia-bility shall apply to any claim or cause whatsoever whether such claim or cause arises in contract, tort or otherwise.
DOI: 10.1036/007138104X
v
CONTENTS
Acknowledgements ix
Introduction: The Q Culture xi
PARTI:
A TALE OF T WO MARKETS
1
Chapter 1. Mr. Market’s Bipolar Disorder 3
Swings, Bubbles, and Crashes / 5 Be an Anomaly / 11
Barrel of Monkeys? / 12
Chapter 2. Prozac Market 17
Obscurity / 17 Simplicity / 18
The PerfectDream / 22 Tidying Up the Tale / 28
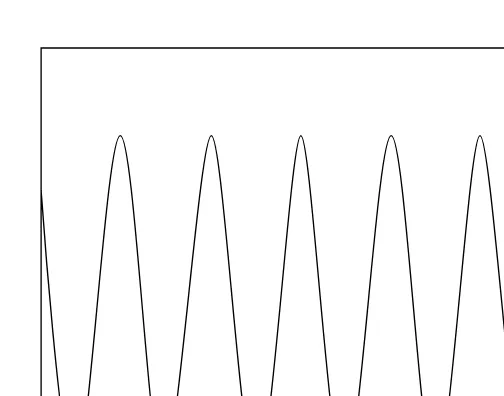
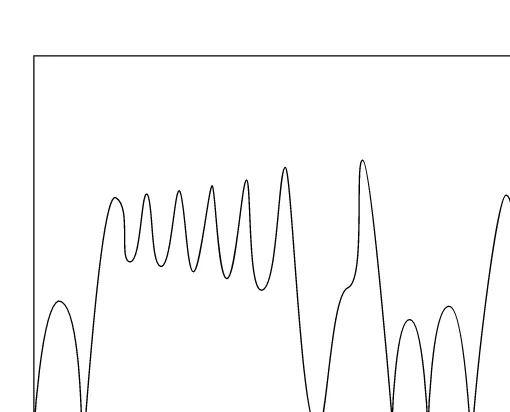
Chapter 3. Chaotic Market 33
New Wave / 33 NextWave / 36 Complexity / 46
Behavioral Finance / 47
Chapter 4. Amplified Volatility 51
Information Volatility / 51 Transaction Volatility / 59 Trader Volatility / 63 Prognosis / 66
Chapter 5. Take the Fifth 69
Who’s in Charge? / 70
Sticking to Your Knitting / 71 Alchemy / 81
The Long Run / 86
PARTII:
SHOW ME THE MONEY
89
Chapter 6. Apple Trees and Experience 91
Fools and Wisdom / 91 Horse Sense / 100
Chapter 7. Your Circle of Competence 105
The Initial Circle / 106 The Nurtured Circle / 109 A Full Circle / 114
Decision Making / 116
Chapter 8. Recognizing Success 119
Business Fuel / 120
Managers under the Microscope / 124 Bang for the Buck / 128
The Full Tool Chest/ 131
Chapter 9. You Make the Call 133
Assets / 134 Earnings / 138
Silver Bullets and the Margin of Safety / 142 Cash / 144
MarketCircularity / 146
Chapter 10. Making (Up) Numbers 153
Perennials / 153 Satire / 157 Charades / 162 Coda / 167
PARTIII:
IN MANAGERS WE TRUST
169
Chapter 11. Going Global 171
Chapter 12. Rules and Trust 193
The Family Manager / 193 Local Governance / 195 General Governance / 200 Your Voice atthe Table / 202
Chapter 13. Directors at Work 205
Hail to the Chief / 206 Pay / 207
Deals / 212 Capital / 215 Checking Up / 217
Chapter 14. The Fireside CEO 221
Master Servants / 221 Action / 222
Lights / 230 Trust/ 235
Conclusion: The V Culture 243
Notes 245
ix
ACKNOWLEDGMENTS
T
he main ideas in this booktrace their intellectual lineage to Benjamin Graham, whom I never knew but must thank post-humously, and Warren Buffett, whom I have the great fortune to know and from whose writings, talks, and conversations I have gained knowledge and insight. Neither of these men, of course, has any responsibility for this book’s content and no doubt would disa-gree with some of what it says, though it is written as a narrative interpretation of principles they developed, to which it tries to be faithful.Mr. Buffett deserves my continuing thanks for permitting me to prepare a collection of his letters to the shareholders of Berkshire Hathaway,The Essays of Warren Buffett: Lessons for Corporate Amer-ica, and for participating along with Berkshire Vice-Chairman Charles Munger in a symposium I organized to analyze it. Thanks also to the readers of that collection of wonderful writings for en-couraging me to write the present book, especially the courageous college and business school professors who use that bookin their courses and their many students who tell me how valuable it is.
Other fans of that bookwho encouraged me to write this one include my friends at Morgan Stanley Dean Witter, led by David Darst and John Snyder; Chris Davis and KimMarie Zamot at Davis Selected Advisers; the team at Edward D. Jones; and supporters too numerous to mention at other firms who appreciate the business analysis way of investing.
By training and professional habit I am a corporate lawyer, and as my students know, effectiveness as a corporate lawyer requires mastering not only (or mostly) law but also business, including fi-nance, accounting, and governance. For tutelage in that philosophy, I thankmy friends and former colleagues at Cravath, Swaine & Moore as well as that firm’s clients.
Not all law faculties recognize the intersection of law and busi-ness. My colleagues at Cardozo Law School do and support my
search and writing in the fields of finance, accounting, and gover-nance that seem to others a step beyond law as such. Among these colleagues, special thanks to Monroe Price for introducing me to Warren Buffett through their mutual friend Bob Denham. For grant-ing me a sabbatical to devote time to workon this book, I especially thankDean Paul Verkuil and Dean Michael Herz.
My personal and institutional ability to span these and other subjects has been greatly aided by Samuel and Ronnie Heyman, both nonpracticing lawyers and astoundingly talented businesspeople, in-vestors, and philanthropists. They generously endowed the Samuel and Ronnie Heyman Center on Corporate Governance at Cardozo, a multifaceted program I direct that explores this range of disciplines in teaching, research, and policy review.
My own teachers also deserve my thanks, particularly Elliott Weiss, now professor at the University of Arizona College of Law, who long ago drew my attention to Graham and Buffett’s ideas and who generously shares his wealth of knowledge. For allowing me to use in modified form some materials from a textbookwe worked on together. I also thankProfessor Jeffrey D. Bauman of Georgetown University Law Center, and West Group, that book’s publisher. Thanks also to West Group for allowing me to use in modified form some materials from another textbookI wrote,Introductory Account-ing and Finance for Lawyers, which is not for lawyers only.
Many thanks to the whole team at McGraw-Hill for their con-fidence, enthusiasm, and guidance, particularly Kelli Christiansen, Jeffrey Krames and Scott Amerman.
xi
INTRODUCTION:
THE Q CULTURE
C
ommon sense is the heart of investing and business manage-ment. Yet the paradox of common sense is that it is so uncom-mon. For example, people often refer to a stockor the market level as either “overvalued” or “undervalued.” That is an empty statement. A share of stockor the aggregate of all shares in a market index have an intrinsic value. It is the sum of all future cash flows the share or the index will generate in the future, discounted to present value.Estimating that amount of cash flow and its present value are difficult. But that defines value, and it is the same without regard to what people hope or guess it is. The result of the hoping and guessing game—sometimes the product of analysis, often not—is the share price or market level. Thus, it is more accurate to refer to a stockor a market index as overpricedor underpricedthan as over-valued or undervalued.
The insight that prices vary differently from underlying values is common sense, but it defies prevalent sense. Thinkabout the ticker symbol for the popular Nasdaq 100: QQQ. The marketing geniuses at the National Association of Securities Dealers may have chosen three Qs because Q is a cool and brandable letter (thinkQ-Tips). In choosing from the letters N, A, S, D, and Q, however, they se-lected the one (three times) that stands for Quotation and unwit-tingly reflect a quote-driven culture by this quintessentially New Economy index created in mid-1999.
Quotes of prices command constant attention in the mad, mod-ern market where buyers and sellers of stocks have no idea of the businesses behind the paper they swap but precisely what the price is. Quote obsession trades analysis for attitude, minds for myopic momentum, intelligence for instinct. Quotations are the quotidian diet of the day trader, forging a casino culture where quickness of action fed by irrational impulses displaces both quality and quantity
of thought. QQQ is an apt symbol for the most volatile index in stockmarket history.
In the Q culture, common sense is common nonsense, putting price on a pedestal and all but ignoring business value. The Q trader sees price as everything. The smart investor knows what value is. She focuses on value first, and then compares value to price to see if an investment holds the promise of a good return. That kind of focus requires the investor to operate as a business analyst, not as a market analyst or securities analyst and certainly not as a Q trader.
This bookdevelops a mind-set for business analysis as the an-tidote to the Q culture. It discusses the tools of stockpicking and highlights critical areas of thinking about markets and prices, and businesses and managers. It builds a latticeworkof common sense to fill the vast value void in today’s markets.
The bookfirst shows you why it is a mistake to operate as a market analyst or to look to the market to reveal value when all it can do is reveal prices. It then presents the tools to thinkabout performance and value but also cautions about how financial infor-mation can be distorted in ways that can mislead you. Accordingly, it argues that an essential element of intelligent investing is a com-monsense ability to assess the trustworthiness of corporate manag-ers, principally the chief executive officer and board of directors.
The business analysis approach to investing shatters many myths of investment lore prevalent in the Q culture though not unique to it throughout history. For example, it rejects a distinction as perva-sive as it is mistaken between growth investing and value investing (or between growth stocks and value stocks). To be sure, some com-panies show greater promise of earnings growth than others, but all rates of growth are a component of value so this distinction, crys-talized in the early 1970s and a growing fixation ever since, is of no analytical value.
For another, the business analysis approach underscores a key distinction between investing on the one hand and speculation or gambling on the other. All investing involves riskand in that sense there is a speculative element in all of it. Intelligent investing, how-ever, calls for a reasonably ascertainable valuation and comparison to the price.
noth-ing about and buynoth-ing shares in any business without first readnoth-ing its annual report or knowing what to look for in it. For every gambling success story you hear about, there are scores of failures you don’t. As The Wall Street Journalrecently quipped, no brother-in-law has ever been known to reveal how much money he lost in the stock market.
The focus on business analysis as opposed to market analysis is reinforced by the imaginary Mr. Market, created by the twentieth century’s most astute investment thinker and business school teacher, Benjamin Graham. Price and value diverge in capital market trading because the market is best characterized as manic depressive, mostly either too euphoric or too gloomy. This is contrary to the popular but mistaken belief that markets are efficient and therefore accurately price securities.
Once you as a business analyst knowhowto look, the next ques-tion is where to look. The core idea is your circle of competence, created by the twentieth century’s most successful investor and busi-ness educator, Warren Buffett. It is defined by your ability to un-derstand a company’s products and operating context. Circles of competence are as varied as the investors who must define them. All investors must grapple with the challenge of using current and past information to gauge future business performance.
For most people, it is easier to do this with businesses that have been around a long time, been through lots of business cycles, and faced economic recessions. Within that group of business are many whose long trackrecords justify being called classics—well-established companies with powerful global products and market po-sitions like Procter & Gamble, GE, Coca-Cola, and Disney. Some of these will endure as stalwarts, while others will be beaten down (as GE did to Westinghouse or as Wal-Mart did to Sears Roebuck). The ability to tell which is which will vary among people with different aptitudes in evaluating these companies, for different sets of skills are necessary to understand these various sorts of businesses.
people will have the ability to understand them quite well and be able to make informed judgments about their future prospects.
As with the classics, some vintage companies will turn out to be warriors and others wimps. For example, take the personal computer business. From 1990 to 1999 the erstwhile start-up Dell built a hugely profitable direct-sales PC business, growing its sales and prof-its at astonishing rates, with Compaq following respectably, Tandy and Apple lagging, and plenty of staggering wimps suffering erosion during the period, including AST, Digital, Atari, Tulip, Commodore, and Kaypro.*
A third group of companies are “rookies,” brand-new companies, perhaps in brand-new industries, whose entire context has virtually no trackrecord. These are frontier businesses, like steel in its day, automobiles in theirs, plastics a bit later, and the Internet at the turn of the twenty-first century. Apart from the first movers in such groups—say, Yahoo! and America Online (AOL) among the 1990s Internet companies—these have virtually no economic histories to speakof.
Even so, there will be investors who have the present-day tools to make intelligent estimates of where the rookies will be in the future. By mating with AOL in 2000, senior managers of Time-Warner expressed just such confidence in their ability to do so. Whether their judgment will be vindicated remains to be seen. But certainly although some of these companies will turn out to be fly-by-nights, others are true up-and-comers that will proceed up the ranks from vintage warriors to stalwart classics. After all, every com-pany started out as a rookie.
The central feature of the circle of competence, then, is that it must be tailored to the individual. It is not the case that intelligent investors avoid businesses that are hard to understand or subject to rapid change. On the contrary, those investors equipped with the ability and fortitude to understand what is hard for others to under-stand and to gauge better than others how a business and its industry are evolving have a decided advantage. But it remains important for each investor to come to grips with what is and what is not within his circle of competence to make the informed judgments that in-telligent investing requires.
The next inquiry is what to lookfor, within your circle of com-petence. The main question is the certainty with which you can evaluate the long-term economic characteristics of a business. A greater degree of confidence may be necessary for rookies, less for vintage companies, and least for classics; but in all cases, assessing the long-term characteristics of business performance is crucial.
Obtaining the necessary degree of confidence in valuation entails just a few quantitative inquiries. You’ll see in the second part of the bookthat financial statements must enable you to answer three questions about a business:
• How likely is it the business will be able to pay its debts as they come due?
• How well is management running the business? • What is it worth?
These questions can be gauged with a sufficient degree of con-fidence by a basic familiarity with key business ratios relating to working capital and debt, management of inventory and other short-term assets, returns on equity, and the future outlookfor earnings.
Just as each investor’s circle of competence will vary, so too will the assessment of these financial characteristics. Ultimately, the value of a business is the present value of all the cash it will generate for its owners over future time. Because no one can know the future with certitude, coming up with that number requires the right set of tools and good judgment.
Equipped with these tools and working within your circle of competence, you can determine how much and what sort of evi-dence is required to be comfortable with a valuation estimate. Yet there is no single reliable tool to pinpoint the value of a business, so intelligent investors must observe Benjamin Graham and Warren Buffett’s cardinal rule of prudent investing: getting a margin of safety between the price you pay and the value you are paying for.
On the other hand, some assets may be understated on a balance sheet (such as reserves of a natural gas company as well as land values). Off–balance sheet liabilities relating to environmental prob-lems, post-retirement health benefits for employees, and stockop-tions for managers also must be included as adjustments to reported figures. You need not know every detail, but a working understanding is necessary and can be developed with a modicum of effort as part of a business analysis mind-set.
Tied to the question of certainty in evaluating the long-term characteristics of a business is the certainty with which you can rely upon management to channel rewards to shareholders. It remains true that mouth-watering economics is the most important variable in evaluating any business for investment. Poor economics can rarely, if ever, be cured, even by exceptional management, and in-ferior management can harm a good business (though it is harder for bad management to damage an outstanding business).
This management reality—coupled with the inadequacy of mar-kets and the potential unreliability of numbers—demands that an investor also appreciate the qualitative dimensions of business anal-ysis. The most important of these are those qualities that indicate that a company has an owner orientation.
Holding an owner orientation is not required of corporate man-agers as a matter of law or even by practice or custom. Nor will such an owner orientation be achieved merely by arranging the corporate rules in certain ways, such as having large numbers of outside di-rectors or separating the functions of the CEO and the chairman of the board. Accordingly, the focus on managers is a focus on trust-worthiness.
Assessing the trustworthiness of corporate managers is much like assessing the trustworthiness of a prospective son-in-law. It is a mat-ter of common sense—again, a rare but acquirable mind-set. In the context of corporate managers, sources of insight into managerial trustworthiness include business records and qualities of commu-nications to shareholders—the CEO letter in particular. Examples of this art finish off the book, the final chapter giving an account of the letters of JackWelch (GE), Mike Eisner (Disney), and the late Roberto Goizueta (Coca-Cola).
• The efficient market story is at most four-fifths true and investors can take advantage of the remaining one-fifth
• Traditional tools of financial analysis remain an investor’s best friends but that earnings management and accounting manipula-tion can be her worst enemies
• Intelligent investors pay special attention to who the managers are and whether they are trustworthy
Minding these Ps and Qs does not require enormous amounts of work, although it does require large doses of common sense as inoculation against Q fever.
This antidote takes you through the golden gates of the safer and more prosperous V culture world. The consummate teacher of V culture, Ben Graham, was also a successful practitioner. Warren Buffett, the consummate student and practitioner, is also a teacher. All good students take the lessons of their teachers and expand upon them in application. Buffett is no exception, nor are the many other Graham disciples who take the core lessons and extend them in a variety of successful ways.†
Yet the differences are subtle to say the least. Buffett keeps in-violate Graham’s core ideas that call for a business analysis mind-set, attention to the differences between price and value, and in-sisting on a margin of safety when making any investment. Only minor differences in application come up, including and pretty much limited to the following: Buffett places somewhat more significance on the role of managers in investing, is less beholden to bargain purchases of the type Graham favored, is a bit less committed to diversification of stockinvestment, and pays more attention to in-tangible asset values than did Graham. But these differences are not only overshadowed by what is common, they also reflect a broader unifying principle: the importance of independent judgment in in-vesting.
Other Graham disciples choose different ways of applying the main ideas—some diversifying enormously, others concentrating enormously, and some paying far more or less attention to the un-derlying nature of businesses. With temerity and great humility, this bookoffers an account of Graham’s ideas and Buffett’s extension and application of them that reflect the example and tradition. It is
a broadened and extended narrative related specifically to the con-temporary investing environment that Graham obviously can no longer address and that Buffett can do only in the relatively struc-tured frameworkof annual shareholder letters.
p a r t
I
A TALE
OF TWO
MARKETS
3
MR. MARKET’S
BIPOLAR DISORDER
T
he patient exhibits classic manic depression—or bipolar disor-der—combining episodes of euphoria with irritation. He goes on wild spending sprees for months on end, using money he does not have to buy things he does not need. In the buoyant periods he is talkative and full of ideas, but only in distracted, zigzaggy ways. He can charm you into buying the Brooklyn Bridge. Then, suddenly and swiftly, he shifts moods, falling into a months-long spell of darkde-pression, often provoked by the tiniest annoyances, such as minor bad news and modestly disappointing results.Experts observe that the condition might be inherited, caused by innate chemistry affecting mood, appetite, and the perception of pain, which in turn could lead to dramatic weight gains followed by abrupt weight losses. There are safety nets to fall backon, such as government support, and government-approved treatments, such as mood stabilizers. But the patient lives in denial and can become angry and suspicious, sometimes not taking the medicine and pre-cipitating more intense bouts of ups and downs.
The patient I am describing, of course, is the stockmarket. It mixes episodes of irrational fear with episodes of irrational greed. It rises with massive infusions of funds—often borrowed—then falls after the withdrawal of those funds. It bounces around like a circus clown on a pogo stick, weaving wild tales of untold riches to be made without effort. Then it pouts, plummets, and corrects, often on news that this or that company failed to meet earnings estimates by mere pennies per share.
Clear thinkers about market behavior rightly believe that this condition is incurable, with the market being prone to fat gains fol-lowed by fat losses without a nexus to business or economic reality. Nevertheless, government engines such as the Securities and Exchange Commission and private ones such as the New YorkStock
Exchange monitor the extremes, imposing “circuit breakers” that shut the market down when it threatens to slip into a bout of de-pression (a sell-off) or raising the requirements for margin accounts, particularly those of day traders.
Yet no cure is in sight. Mr. Market, in Ben Graham’s terms, denies its manic depression.1 It does this in numerous studies
ex-tolling how “rational” it is. It does it in countless conversations and publications referring to its “efficiency.” Reams of “beta books” are compiled in the belief that its gyrations simply and accurately reflect precisely the measurable riskthat stocks pose for investors. Abstract advice to diversify portfolios is sold as the only way to minimize the rational riskthat this efficient system manageably presents. Denial prevents cure.
Take Ben Graham’s Mr. Market a diagnostic step deeper. Mali-cious microorganisms called rickettsia (named for Dr. Howard T. Ricketts, 1871–1910) cause diseases such as typhus. From the Greek word for “stupor,” signifying a state of insensibility and mental con-fusion, typhus is characterized by bouts of depression and delirium. It is transmitted by bloodsucking parasites called ticks. These para-sites transmit a similar disease called Q fever.
To avoid Q fever, those venturing into tick-infested forests pre-pare themselves. Hats, gloves, long sleeves, and pants are the dress code. If bitten, prudent forest denizens remove the parasite with tweezers, wash the bite, and apply rubbing alcohol, ice, and calamine lotion. They survive to enjoy the woods.
Fools in the tick-ridden forest go bare, leaving exposed their skin and, most daringly, their heads. After they find a tick, fear drives them to irrational action, such as burning the tickinstead of tweez-ing it out. The ktweez-ings and queens of fooldom then venture gleefully on their forest expedition, giddily unaware that they are infected with Q fever—until depression and delirium set in.
In the stock market forest, the ticks of price quotes infect the unprepared fools in the same way and with similar results. Trader obsession with price quotations spreads the Q fever epidemic, adding gas to the fire of Mr. Market’s manic depression.
ex-pose oneself to the contagion. Instead, use Mr. Market to your ad-vantage.
Neither Graham’s Mr. Market nor this Q fever metaphor implies anything about the psychology of market participants. Rational peo-ple acting independently can produce irrational market results. Many investors simply defer to experts or majority opinion. Following the herd may seem rational and intelligent—until it stampedes straight off the cliff.
SWINGS, BUBBLES, AND CRASHES
Price ticks drive the wild volatility that plagues contemporary stock markets. Momentum traders and sector rotators are both victims and transmitters of Q fever. The disease reaches epidemic proportions when the crowd follows the “indelibly indicated trend,” in the sar-castic words of Fred Schwed from his classic work Where Are the Customers’ Yachts? referring to the illusion that patterns predictably persist.2
Average stockprices swing by 50% every year, while underlying business value is far more stable. Share turnover is enormous. The number of shares traded compared to the total shares outstanding spiked from 42% to 78% on the New YorkStockExchange between 1982 and 1999 and from 88% to 221% on the Nasdaq between 1990 and 1999.3 Prices on particular stocks rise sharply and fall furiously
within days and weeks without any link to underlying business val-ues.
Speculation rages, and the speed of price fluctuation has mul-tiplied dramatically compared to previous decades. Market volatility has increased roughly in proportion to the dramatic increase in in-formation—both real and imagined—that is readily available. Get-ting in before the rise and out before the fall has become the day trader’s mantra, one that reveals not only the presence of Mr. Market but the existence of his coconspirators by the thousands.
Table1-1. Dow Busts
Date Close
Point Change
Percent Change
October 27, 1997 7,161.15 ⫺554.26 ⫺7.18 August 4, 1998 8,487.31 ⫺299.43 ⫺3.41 August 27, 1998 8,165.99 ⫺357.36 ⫺4.19 August 31, 1998 7,539.07 ⫺512.61 ⫺6.37 January 4, 2000 10,997.93 ⫺359.58 ⫺3.17 March 7, 2000 9,796.03 ⫺374.47 ⫺3.68
Frothy new economy devotees bid up the new stocks and tech stocks to wild heights compared to their pathetic or negative earn-ings while eschewing the stodgy old economy stocks that continued to generate steady earnings increases. The new giddiness subsided, and the Dow surged while the Nasdaq slumped. But then one re-covered while the other dropped. Topsy-turvy is the only description for this wild world.
Anyone seeking to divine some deep logic in these flip-flopping patterns, however, could stop looking on April 14, 2000, when the indexes plunged together, the Dow by 6% and the Nasdaq by 10%. Then both rebounded the next trading day, with the Dow climbing backnearly 3% and the Nasdaq moving backup 6.6% (and the day after that experiencing up pumps of nearly 2% and over 7%, respec-tively).
No deep logic explains these swoons or this pricing divergence, and all you can really conclude is that Mr. Market was being his (un)usual self. Staggering as these data are, consider too that in the first quarter of 2000, the Nasdaq suffered four declines of 10% or more and then in each case rebounded. In April 2000 alone it re-corded two jumps that were its largest in history and three drops that were its largest in history. In the late 1990s and early 2000s, Dow busts were equally commonplace, as other drops exceeding 3% show (see Table 1–1).
The Dow busts of August 1998 were particularly potent: They wiped out all the gains the Dow had made during that year. So was the March 2000 bust: It set the Dow backto where it had been about a year earlier.
Table1-2. Dow Bursts
Date Close
Point Change
Percent Change
September 2, 1997 7,879.78 257.36 3.38 October 28, 1997 7,498.32 337.17 4.71 September 1, 1998 7,827.43 288.36 3.82 September 8, 1998 8,020.78 380.53 4.98 September 23, 1998 8,154.41 257.21 3.26 October 15, 1998 8,299.36 330.58 4.15 March 15, 2000 10,131.41 320.17 3.26 March 16, 2000 10,630.60 499.19 4.93
in the Dow exceeding 3% that occurred in the late 1990s and early 2000s (see Table 1–2).
Apart from their magnitude, consider the proximity of these Dow busts and bursts. The charts show two back-to-back reversals: The October 27, 1997, bust of ⫺7.18% was followed the next day by a 4.71% burst, and the August 31, 1998, bust of ⫺6.37% was followed the next day by a 3.82% burst. The three busts of August 1998 were promptly followed by three bursts of September 1998, much the way the bust of March 7, 2000, was followed by the bursts on March 15 and 16 of that year. It is hard to believe that these successive bursts and busts are based on changes in fundamental information inves-tors were rationally and efficiently acting on.
Beyond busts and bursts on the Dow and the Nasdaq in the late 1990s and early 2000s, recall one of the most dramatic single epi-sodes of Mr. Market’s presence on Wall Street: the 1987 crash. The Dow vaporized by 22.6% on a single day and nearly 33% in the course of one month. The 1987 crash was not limited to the 30 common stocks on the Dow but was worldwide. The New York Stock Exchange, the London StockExchange, and the Tokyo Stock Exchange all crashed.
• On September 4, 1987, the Federal Reserve Board raised the dis-count rate.
• On October 13, 1987, the House Ways and Means Committee voted to approve income tax legislation that would disallow interest deductions on debt used to finance business acquisitions.
• On October 18, 1987, Treasury Secretary James Baker publicly an-nounced an intention to reduce the value of the dollar.
• Market prices were already high by historical standards.4
Some experts attributed the 1987 crash to various institutional factors, including program trading and portfolio insurance that were set to sell off big chunks of the portfolios of large investors as prices fell. When prices fell, these program sales pushed them down even harder. Other experts pointed to derivative securities, often exotic instruments whose value fluctuates with changes in the value of benchmarks such as interest and exchange rates. These derivatives are usually intended to reduce riskand volatility in such bench-marks, though if poorly designed can exacerbate the volatility in stockmarket pricing.
But given the international nature of the crash and its depth, hardly anyone accepts these explanations. Most people also agree that it is impossible to explain rationally the radical price changes that have occurred at other times—whether the 1929 crash, the 1989 break, or the general 1990s and 2000s volatility. Market frenzy simply cannot be explained using EMT but is a product of a complex of forces in addition to actual changes in information about funda-mental business values.
Market frenzies like these are not isolated and certainly not unique episodes in financial history. On the contrary, market bub-bles—situations in which prices are way higher than values—happen all too often. There was a technology stockbubble from 1959 to 1961; a bubble in the so-called ‘Nifty Fifty’ stocks in the late 1960s and early 1970s; a gambling stockbubble in 1978; a bubble in oil and energy stocks in the late 1970s; a home shopping bubble in 1986 and 1987; and a biotechnology bubble in the early 1990s (with a resur-gence in the early 2000s), and all of these resemble the Internet or dot-com bubble of the late 1990s and early 2000s.
public offerings (IPOs) of Internet stocks were launched, many in the same industry where it is going to be impossible to have more than a handful of profitable companies. Deals included, for exam-ple, 17 health-care related companies, seven business-to-business e-commerce companies, six music distribution companies, five em-ployee recruiters, and three travel agencies. It starts to sound like the “Twelve Days of Christmas.”
Driving this funding is the fascination with technological inno-vation, a fascination that characterized previous market bubbles as well. The 1960s technology bubble arose from innovations such as color television and commercial jet aviation. It spawned an IPO boom in electronics and other businesses whose names ended with “tron” or “onics” not unlike that of 1999’s dot-com boom.6Takeovers
surged in both periods, fueled by high-priced stockthat built many corporate empires. All the talkwas of a new history-defying era— called a “new paradigm” in the 1960s and the “new economy” in the late 1990s and early 2000s. But as Warren Buffett quotes Herb Stein as saying, “If something can’t go on forever, it will end.”7
The Internet bubble may not end as abruptly as the 1960s elec-tronics bubble did. It may instead follow the path of the stockmarket bubble in Japan in the 1980s, which ended in a gradual and total erosion of stock prices in the Nikkei average throughout the decade of the 1990s. One thing the two periods have in common—and one of the most striking common features of speculative bubbles gen-erally—is the emergence of “new” ways to defend the high prices.
In 1980s Japan the fuel was stockprices based not on the earn-ings or cash that can be generated by a business, but on underlying asset values the businesses owned, which themselves had been rising to the stratosphere as a result of aggressive real estate speculation. We’ll soon see that the same alchemy plagues the turn of the twenty-first-century United States.
But the excitement of “getting in” on these deals got out of hand, more and more money was allocated to futures contracts on tulip bulbs and shares of the South Sea Company, and the more money that was led there, the more money seemed to follow—until the music stopped and panic set in. In Holland, the price got so high that speculators could not afford to pay for the bulbs they had bought the rights to. In Britain, the company simply did not generate the great gains from Spanish trade everyone had obviously been ex-pecting.
If EMT were true, the U.S. stockmarkets would be unique among all markets throughout human history and across the con-temporary globe.8 Consider this selection from the writings of the
market observer Joseph de la Vega from the late 1600s about the Amsterdam stockexchanges of his day, in the style of a tongue-in-cheekdialogue between a merchant and an investor:
Merchant: These stock-exchange people are quite silly, full of in-stability, insanity, pride and foolishness. They will sell without knowing the motive; they will buy without reason.
Investor: They are very clever in inventing reasons for a rise in the price of the shares on occasions when there is a declining tendency, or for a fall in the midst of a boom. It is par-ticularly worth remarking that in this gambling hell there are two classes of speculators. The first class consists of the bulls. The second faction consists of the bears. The bulls are like the giraffe which is scared by nothing. They love everything, they praise everything, they exaggerate everything. They are not impressed by a fire or disturbed by a debacle. The bears, on the contrary, are completely ruled by fear, trepidation, and nervousness. Rabbits be-come elephants, brawls in a tavern bebe-come rebellions, faint shadows appear to them as signs of chaos. The fall of prices need not have a limit, and there are also unlim-ited possibilities for the rise. Therefore the excessively high values need not alarm you.9
BE AN ANOMALY
EMT also cannot explain many other things about how market prices operate apart from swings, bubbles, and crashes. Abundant evidence refuting EMT includes the extraordinary number of unexplained market phenomena, such as the following:
• The January effect (prices tend to rise in January).
• The insider effect (a stock’s price tends to rise after insiders dis-close purchases to the Securities and Exchange Commission and fall after insider sales are disclosed).
• The value line effect (stocks rated highly by the Value Line In-vestment Survey tend to outperform the market in terms of price). • The analyst effect (stocks of companies followed by fewer analysts tend to become pricier compared to those followed by more ana-lysts).
• The month effect (stockprices tend to rise at the end and the beginning of months).
• The weekend effect (stock prices tend to be lower on Mondays and higher on Fridays).
Weirder correlations also exist, including the hemline indicator (prices historically have risen and fallen in tandem with rises and falls in the average length of skirts in fashion) and the Super Bowl effect (prices tend to rise in the period after the Super Bowl if the winning team was a member of the original National Football League but fall otherwise).
Efficiency buffs call these and dozens of other well-known exhibits against market efficiency “anomalies.” Some anomalies dis-appear over time. The January effect began to do so in the mid-1980s. When they do, EMT worshipers rejoice, citing the disappear-ance as evidence of market efficiency. This is strange evidence, however, when you note that the vanished anomalies persisted for decades (seven decades in the case of the January effect).
Windsor Fund (Vanguard); Mario Gabelli; David Schafer; William Ruane and Richard Cuniff of the Sequoia Fund; Tom Knapp of Tweedy Browne; John Templeton; Mason Hawkins of Longleaf Part-ner Funds; and untold others.
BARREL OF MONKEYS?
Can it be, as EMT devotees resort to saying, that these are anomalies too—that these folks are all merely lucky? Is it plausible to believe that they are just like the imaginary monkey who would produce the entire script ofHamletby randomly hitting the typewriter keys? Even if you agree that this is possible, to complete the argument the imag-inary monkey would also have to be able to punch in the correct keys to generate the full scripts of Romeo and Juliet, Macbeth, King Lear, Henry IV, and pretty much the entire Shakespearean canon. Even if this is theoretically possible, such a prolific monkey (or a barrel of monkeys) seems incredible.
The monkey view acknowledges that luck plays a role in invest-ing, as it does in other aspects of life. The leading populist apostle of this “lucky monkey” viewpoint is the Princeton professor Burton Malkiel, who explains it in his book A Random Walk Down Wall Streetby using a coin-flipping contest.10
Start with a thousand people flipping a coin, with those flipping heads being the winners and going to the next round. By the laws of chance, on average 500 will flip heads and 500 will flip tails. The 500 flipping heads proceed to round two, where, again by the laws of chance, half will flip heads and half will flip tails. The 250 lucky heads flippers go to round three, where 125 of them win; 63 of those win round four; 31 win round five; 16 win round six; and 8 win the final round and are proclaimed “expert” coin flippers.
Yet resorting to luckas an explanation of investment success leaves the explanation incomplete. First, investing is simply not like coin flipping, though speculation and gambling may be. The great investors do some homeworkand develop a set of investment pre-cepts to guide them in their selection of investments. They don’t simply flip a coin in choosing which investments to make. They certainly do not decide between, say, IBM and Clorox by pasting their logos onto a coin, with the logo landing face up getting the capital.
his keys every day for decades, much as a day trader would have to clickhis mouse every day for decades. But the great investors have not followed the daily trading strategy. On the contrary.
Buffett, for example, generated most of the billions of wealth Berkshire Hathaway has accumulated from about ten investments over about forty years. Many of those billions came from buying big stakes in large companies at times when their value was woefully underappreciated by the market.
Berkshire bought its stake in the Washington Post Company, for example, in mid-1973.11Not only had the Post’s own stockprice been
battered by the Nixon White House’s excoriation of its investigative reporting on Watergate, that was one of the few times in postwar American history that the U.S. stockmarket resembled its dismal stance during the Depression. Buffett’s purchase price? About a fifth of intrinsic value, an 80% margin of safety. Luckplays a major role in a day trader’s portfolio; discipline plays an obvious role in Berk-shire’s.
Luckis an inadequate though often partial explanation for any human endeavor that entails effort. Those who succeed in their en-deavors catch butterflies not by luckalone but with the help of an expertly cast net. Ben Graham drew a fine linkbetween luckand work by saying that “one lucky break, or one supremely shrewd de-cision—can we tell them apart?—may count for more than a lifetime of journeyman efforts. But behind the luck, or the crucial decision, there must usually exist a background of preparation and disciplined capacity.”12
Whether they are characterized as value investors, growth inves-tors, fundamental invesinves-tors, opportunistic invesinves-tors, or anything else, commonsense discipline is the unifying trait of all the super-investors who make up this barrel of monkeys. It is true that Keynes and Loeb are associated with the “skittish” school of investing, an opportunistic strategy that rapidly exploits market gyrations fueled by alternating bouts of fear and greed. Their short-termism contrasts with the long-term views of the “value” school associated with Gra-ham and Buffett, yet both schools recognize the price-value discrep-ancy that these alternating bouts of Mr. Market’s bipolar disorder create.
are not important, but the quality of their analysis and the indepen-dence of their thought and judgment are.
The best investors employ a mind-set that takes account of just a few things, but those things are indispensable. Every extraordinary investor follows Ben Graham’s first principle: The market does not perfectly price the business value of a stock. Warren Buffett takes that insight dead seriously by limiting his purchases to stocks that are way underpriced by the market. Both of these investment titans as well as Phil Carret emphasize the importance of avoiding bad deals, stocks that are way overpriced in the market.
These investors and other greats, such as Buffett’s partner Char-lie Munger, always remember that there are tens of thousands of investment options available to just about anyone. To opt for one requires a strong belief that the market is giving the best deal avail-able compared to all the others. And opportunity does knock. One way to test opportunity is to take Loeb’s approach: always ask whether you would be comfortable committing a large portion of your resources to a single stockyou are considering.
Buffett and other outstanding investors, including Peter Lynch, know that an intelligent appraisal depends on your ability to under-stand a business. This gives you a basis for gauging points all these top investors consider crucial, such as a company’s competitive strength, brand power, and ability to develop new products profitably. The investment giants (not monkeys) don’t worry much about whether their investments end up concentrated in certain compa-nies. For example John Neff, the portfolio manager of the Windsor Fund from 1964 through 1995, generated returns exceeding the av-erage by a steady 3% annually and did so while sometimes allocating as much as 40% of the fund into a single business sector. Buffett’s Berkshire Hathaway is a wonderfully diverse collection of outstand-ing businesses, but that diversity was an accidental by-product of the tremendous growth in the capital it deployed rather than a conscious effort to participate in lots of different businesses or sectors.
companies which consistently maximize the full potential of a busi-ness, wisely allocate capital, and channel the rewards of this success to shareholders. They emphasize the importance of exceptionally competent managers who own substantial amounts of equity in their own companies and can rapidly adapt to dynamic business condi-tions. They also believe that managerial depth and integrity include assuring good relations with labor and promoting an entrepreneurial spirit.
The hedge fund master George Soros summed it up well by say-ing that “the prevailsay-ing wisdom is that markets are always right; I assume they are always wrong.” The prevailing wisdom of market efficiency is one way to view markets. In this view, price changes are due almost exclusively to changes in fundamental values. Therefore, a diversified selection of stocks with different pricing behaviors com-pared to the overall market makes the most sense. The contrary view says that lots of price changes occur for nonfundamental reasons. The goal here is to identify those companies whose prices are below their business value. This perspective calls for thinking about indi-vidual businesses rather than the overall market.
The next two chapters offer the alternative foundations of these two competing ways to thinkabout markets. Chapter 2 is a history of how the efficient market idea came into being. Chapter 3 is an account of evidence that contradicts EMT on its own terms. If you are already a skeptic of market efficiency, you can skip these two chapters as a practical matter (though they contain valuable insights on the merits of the competing views). If you are an efficiency dev-otee, you should read them and be prepared to change your mind.
17
PROZAC MARKET
A
long and interesting story lies behind the ever-popular efficient market theory, a story every investor should know. Knowing the EMT story will enable you to evaluate advice based on it, including advice about the value of diversification and ways of measuring risk. It will also help you decide for yourself whether to believe EMT. That is important because if you believe in market efficiency, you will adopt a style and philosophy of investing very different from the one you will be smart to adopt if you do not.Investors who have already concluded that EMT is not the best account of how stockmarkets workcould skip this chapter without being cheated, but even they may discover ways in which EMT has unwittingly affected their investing habits. All readers will also dis-cover that the history of EMT is fascinating. It is a story about re-search designed to enlarge knowledge, to explain and understand the world, research whose results are intermittently neglected and then overblown. The story tells us that EMT is not the last word on how stock markets work, even though the power it has had over investors and teachers for several decades sometimes makes it seem that peo-ple thinkit is the last word.1
OBSCURITY
EMT traces its history to the random walkmodel of stockprices, the sensible idea that stockprices move in a way that cannot be predicted with any systematic accuracy. The model dates backto 1900, when it was elaborated in a doctoral dissertation by the French mathematician Louis Bachelier that though obscure in its time is now famous. That dissertation investigated linear correlation in the prices of options and futures traded on the French Bourse and con-cluded that such price changes behaved according to a random walk model.2
Bachelier’s workwas not widely noticed when it was published, perhaps because the mathematical parts of it preceded by five years Einstein’s famous workon the random motion of colliding gas mol-ecules. Einstein “discovered” the equation that describes the phe-nomenon of random molecular motion, known as Brownian motion (after the Scottish botanist Robert Brown, who first observed it), which was precisely the equation Bachelier developed to describe price behavior in financial markets.
Although the mathematical properties Bachelier employed were of direct and immediate interest to physicists and mathematicians (including Einstein and his intellectual progeny), economists paid little attention to the subject until the middle of the century. Indeed, virtually no studies before the early 1950s made any reference to Bachelier’s workor to the theory of random processes in financial markets.
Maurice Kendall is frequently credited with bringing the random walkmodel to the attention of economists in the early 1950s. Bach-elier’s workitself, however, was not “discovered” by economists until they stumbled across it in the mid-1950s.
While rummaging through a library, Leonard Savage of the Uni-versity of Chicago happened upon a small bookby Bachelier pub-lished in 1914. He sent postcards to his economist friends asking if they had “ever heard of this guy.” Paul Samuelson could not find the bookin MIT’s library but did locate and then read a copy of Bach-elier’s doctoral thesis. Just after Samuelson’s discovery in 1959, the random walkmodel became a very popular area of research.
Bachelier’s long obscurity was also due to a widely reported 1937 study by the renowned economist Alfred Cowles concluding that stockprices did move in a predictable way. This study shut down research on the random walkmodel for decades until in 1960 the Stanford professor Holbrook Working discovered a mistake in it. Cowles then corrected the mistake, and his revised study supported the random walkmodel.
SIMPLICITY
com-puters. Using those new technologies in the early 1960s, stockmar-ket researchers went to work with a vengeance exploring random processes in these markets.
Correlation Tests
One aspect of the investigation consisted of correlation tests that were used to determine whether specified data sequences move to-gether to any degree. In the case of stockprices, price changes of a given stockare recorded over a specified time period—say, a number of days—and a subsequent period of the same length. These se-quences (called time-series data) are then compared to determine whether they move together to any degree—whether they show any “correlation.”
The comparison takes the form of a correlation coefficient, a number that reflects the degree to which the data are linearly re-lated. In effect, the time series of data is tested for correlation by fitting a straight line to the data and then calculating that number. A correlation coefficient equal to zero provides evidence that the data in the series have the property of statistical independence; cor-relation coefficients that are close to zero (but not equal to zero) indicate that the data are uncorrelated. A time series of data is ran-dom if it is either independent or uncorrelated.
Consider televised lottery drawings in which winning lottery numbers are determined by selecting numbered balls from a bin containing numerous balls with different numbers painted on them. The auditor retrieves a ball, records its number, and replaces that ball. The auditor does this perhaps three times, each time retrieving, recording, and replacing. This process has the property of statistical independence because the number recorded after any retrieval in-dicates nothing about the numbers recorded either previously or sub-sequently.
Outside of a controlled context such as a lottery bin, particularly in the context of time-series data such as stockprices, it is extremely difficult to prove statistically that a series of data has the property of statistical independence. The less restrictive property—that data are uncorrelated—is susceptible to statistical proof and allows for conclusions substantially similar to those which follow from the in-dependence property.
various series of actual stockmarket data were indistinguishable from various series of numbers generated by a random number table, roulette wheel, lottery drawing, or another device of chance.
These findings had an important practical implication: Traders could not systematically make above-normal gains from trading be-cause a statistical lackof correlation implies that the best estimate of the future price of a stockis its present price. In other words, if prices follow a random walk, the price change from one time to the next will not affect the probability that a particular price change will follow that one. Past prices cannot predict future prices.
Runs
A long known weakness of correlation tests is that the results can be skewed by a small number of extraordinary data in the time series. An alternative test that avoids this weakness is an analysis of runs in the data—an investigation of whether there is any persistence to the direction of successive changes.
A run is defined by an absence of directional change in a statistic in the series. Thus, a new run begins any time the direction changes (i.e., from negative to positive, from positive to negative, or from unchanged to either negative or positive).
Instead of testing the correlation of numerical changes in the data in the series, one investigates the relationship of the direction of those changes. If price changes follow the random walkmodel, the number of sequences and reversals in time-series data of stock prices will be roughly equal. If the same direction persists for a sig-nificantly longer period, the random walkmodel will be contradicted. Among the numerous run studies conducted in the early 1960s, the University of Chicago economist Eugene Fama’s is regarded as the most careful.3 Fama found that the direction of price changes
tended to persist but nevertheless concluded that no trading rule or strategy could be derived that outperformed the market consistently. Accordingly, almost everyone involved in the debate in the late 1960s agreed that the observed departures from randomness were negligi-ble and believed that this constituted strong support for the random walkmodel.
Trading Rules
oc-casionally expressed the fear that the interrelationships of stockprice changes are so complex that standard tools like these cannot reveal them. That fear led to efforts to dispute the model by designing trading rules that could achieve above-normal returns by uncovering and exploiting these greater complexities.
Among the most primitive though most illustrative trading rules was Sidney Alexander’s “filter technique.” This is a strategy designed to discern and exploit assumed trends in stockprices that, in Alex-ander’s piquant phrase, may be “masked by the jiggling of the mar-ket.”4
For instance, a “5% filter rule” for a stockwould say to buy it when the price goes up 5% (and watch it rise to a higher peak); then sell it when the price goes down 5% from that peak(and watch it fall to a lower trough); then short the stock(i.e., borrow it and sell it at the prevailing price, promising to repay with the same stock, to be purchased for the price prevailing at the time of repayment); then, when the price rises 5% from that trough, cover the short position. If this works, you get a gain on the initial sale plus a gain on the short position. More important, if it works, prices are following a peak-trough pattern. That means they are not random and the ran-dom walkmodel is contradicted.
Alexander’s initial results indicated that such a technique could produce above-normal returns. Subsequent refinements of Alexan-der’s workby himself and others, including Fama, however, dem-onstrated that relaxing or changing certain assumptions eliminated the abnormal returns, particularly the original filter technique’s fail-ure to note that dividends are a cost rather than a benefit when stocks are sold short.
Alexander’s filter technique epitomizes the chartist or technical approach to stockanalysis and trading, under which a study of past prices (or other data) is used as a basis for predicting future prices. Indeed, Alexander’s filter technique is a conceptual cousin of limit orders and similar techniques prevalent in securities trading today. These techniques include conventional technical methods that rely on anomaly effects (the insider, month, weekend, and analyst ef-fects) as well as the more unconventional methods (the hemline indicator, the Super Bowl indicator, and so on).
stu-dents of the random walkmodel (and EMT) recognize based on the foregoing analysis.
They are nonsense not because of EMT but because they fly in the face of business analysis. As Ben Graham said of proponents of such technical methods inThe Intelligent Investor: “We shall dismiss these with the observation that their workdoes not concern ‘inves-tors’ as the term is used in this book.”5
On their own terms, the trouble with all these tests of the ran-dom walkis that they are linear. They do not investigate the presence of nonlinear price dependence, something that in the early 1960s researchers simply lacked the computer horsepower to do.
The trading rule test, for example, is linear in that it operates in chronological time (or real time). Neither it nor the other old tests consider the possibility that market time may be better understood from a perspective that is nonlinear. We will get to that subject in the next chapter, but for now note that Einstein demonstrated that time is not absolute but works in dozens of different ways depending on the context, including forward (or linear), backward, circular, slow, and erratic (nonlinear), and can even stand still.
THE PERFECT DREAM
Many people suggest that EMT developed in a peculiar manner in scientific research. The proof of the hypothesis came first, beginning with Bachelier in 1900 and proceeding through the wealth of studies reporting randomness in the early 1960s.
Only then was a theory proposed to explain the randomness, beginning with the first explication of EMT in 1965 by Paul Sa-muelson, a recipient of the Nobel Prize in economics in 1970.6
Econ-omists welcomed this proof. The conditions necessary to produce it seemed tantalizingly close to those necessary to sustain every econ-omist’s dream: a perfect market.
The perfect market is a heuristic invented by making the follow-ing assumptions concernfollow-ing a market: There are a large number of participants such that the actions of any individual participant can-not materially affect the market; participants are fully informed, have equal access to the market, and act rationally; the commodity is homogeneous; and there are no transaction costs.
model was implying: Prices of shares in stockmarkets should adjust instantaneously and accurately to new information concerning them. That prediction was embodied in EMT as it was first propounded. In its broadest terms, EMT said that the prices of shares traded in stockmarkets fully reflect all information concerning those shares.
Stockmarkets may or may not have the characteristics assumed by the perfect market model. As the 1976 Nobel laureate Milton Friedman reminds us, however, the cardinal rule of economic fore-casting is that a model’s predictive power is the only relevant test of its validity, not the assumptions underlying it.7 Thus, the fact that
investors are not rational or fully informed, for example, does not matter as long as these realities do not interfere with the predictive power of EMT. While many economists are reconsidering assump-tions like these, for now this approach holds sway over accepted economic theory.
Three Forms of Efficiency
In its general form, EMT explains more than the random walk model. That model says simply that successive price changes are independent or uncorrelated, whereas EMT explains that by saying that stockprices fully reflect all the information (not just price his-tories) about a stock. As a result, virtually since the emergence of EMT as an explanation of the random walkmodel, EMT has been divided into three forms defined in terms of specified categories of information.
The three forms were first proposed to classify empirical tests of price behavior given specified kinds of information. The weak form tested the random walkmodel itself, using correlation and run tests like those just described to investigate whether past prices indicate anything about future prices. Semistrong-form testing investigated whether publicly available information other than prices was re-flected in prevailing prices, and strong-form testing investigated whether private information was reflected in prevailing prices.
available; and the strong form (hold your breath) says that stock prices fully reflect all existing information, whether publicly available or not.
There is thus a direct and logical linkbetween the random walk model and weak-form efficiency but a more attenuated and contin-gent linkbetween the random walkmodel and stronger forms of EMT. Recall that the random walkmodel holds that price changes are independent of or uncorrelated with prior price changes. That means that technical analysis of past price changes—sometimes called chartist analysis—cannot aid the prediction of future price changes in any systematic way.
Weak-form efficiency explains this independence and its impli-cations for prediction by hypothesizing that the current price im-pounds all information contained in prior prices. Thus, any price change can only be the result of new information, the production of which is itself assumed to be random. This process of information absorption continues and thus explains the absence of substantial linear dependence in successive price changes discovered in the cor-relation and run tests of the 1960s. It also leads to the stronger forms of the hypothesis.
The semistrong form of EMT posits not only that current stock prices reflect all information consisting of prior stockprices but also that they reflect all publicly available information about the stockin question. Testing this more ambitious claim requires a focus not on correlation analysis of price changes but on the relative swiftness with which prices change given new information.
Despite this different testing methodology, semistrong efficiency depends on the validity of the random walkmodel, which depends in turn on empirical conclusions concerning the absence of statis-tical dependence in stockprice data. In other words, if future price changes depend on prior price changes, any price change the semi-strong form tests cannot be attributable solely to the new infor-mation the test is evaluating. Thus, both weakefficiency and semi-strong efficiency depend on the proof provided by linear testing models.
market returns, with the apotheosis being the insider trading scan-dals of the 1980s.
Since the strong form of EMT has been discredited, debate con-cerning EMT centers on the semistrong and weakforms. Debate over the weakform generally is defined by analysis of the random walkmodel itself, usually in terms of the linear empirical models used to test the relationship between successive price changes; this has cut into the random walkmodel.
A widely noted study by MIT’s Andrew Lo and Wharton’s A. Craig MacKinlay demonstrated strong positive serial correlation in stockprices for weekly and monthly holding period returns. Using 1,216 weekly stock return observations from 1962 to 1985, they found a weekly correlation coefficient of 30%, an extremely high level of correlation. These researchers point out in their book, A Non-Random Walk Down Wall Street, that this does not mean necessarily that the stockmarket is inefficient but that the random walkmodel cannot be the basis for any theory of efficiency.8
Though not conclusive, evidence like this led even Eugene Fama—a chief architect of EMT—to conclude that daily and weekly stockreturns are predictable from past returns, thus rejecting the random walkmodel on a statistical basis.9 Even so, Fama and the
other fathers of EMT cling to the view that such discrepancies are merely anomalies that do not impair the basic model’s validity, though others try to explain these results in a different way called noise.
Noise
Consider John Maynard Keynes’s well-known beauty contest meta-phor for the stock market. In the contest, each judge picks the can-didate he or she thinks others will pick rather than the cancan-didate he or she thinks should win on merit. This replaces a fundamental or substantive sort of analysis (of the kind urged in this book) with a popular, speculative, and herd-packmentality.
The quality of information digested by the market may be just as low as the quality of information that goes into the decisions of Keynes’s beauty contest judges. Tobin has many followers who think he’s right, including Nobel Prize winners William F. Sharpe and Ken-neth Arrow of Stanford.11If it is true that many traders act as Keynes
described, the semistrong form of EMT has to be further subdivided between strict informational efficiency and a more refined notion of fundamental efficiency.
Informational efficiency describes a market in which all public information about a stockis reflected in the price of that stockwith-out regard to the quality of that information. Thus, information that concerns the fundamental value of a stockis reflected, but so is information wholly unrelated to that fundamental value, such as who won the Super Bowl. Fundamental efficiency is the more narrow but more ambitious idea that stockprices are accurate indicators of in-trinsic value because they reflect only information concerning fun-damental business values.12
The issue becomes whether the capital markets can distinguish among kinds of information so that only information about funda-mental value is impounded and reflected in prices. That revives the basic question of whether humans behave rationally. EMT says it does not matter if individual actions are not rational because any individual irrationality will be corrected by others acting rationally. In effect, irrationally is “assumed out” of the EMT model.
The informational-fundamental distinction, however, is so intu-itively and empirically potent that it had to be confronted. The result was the face-saving shelter of euphemism: The economist Fischer Black, borrowing a term from the field of statistics, renamed irra-tional behavior noise, thus enabling self-respecting economists to discuss the issue and try to model it.13
Noise theory is supported by substantial empirical evidence and a well-developed intellectual foundation. Noise theory models hold that stockmarkets are infected by a substantial volume of trading based on information unrelated to fundamental asset values (noise trading). These models attempt to explain both why noise trading occurs and why its effects persist.