THE IMPLICATION OF INTERNATIONAL TRADE
LIBERALIZATION TO THE PRODUCTION AND
TRADE OF DOMESTIC FRUITS
Aldon M.H.P. Sinaga
11 Study Program of Agribusiness, University of Tribhuwana Tunggadewi
*corresponding author: [email protected]
ABSTRACT: Free trade, which is part of liberalization process upon international trade and the implementation of many trade agreements, already brought implication to domestic trade performance. The impact of free trade policy will affect to the trade management of domestic fruit. It can result in either negative or positive effects. The objective of this research was analyzing and studying responses of Indonesian local fruit trade performance in domestic market due to fluctuation change of fruit import as the result of free trade policy implementation. Data used in this research was secondary data. The data obtained from Department of Agriculture, Department of Industry and Trade, FAO, and Indonesian Central Bank database. That data was collected from 1980 to 2006. Model that created in this research was estimated by OLS (Ordinary Least Square) method. The results show that free trade implementation influences on increasing of imported quantity for apple, orange, banana, and papaya commodity, decreasing of total domestic fruit supply, decreasing of land area for mango, banana, orange, and papaya cultivation until its next 2 years period, decreasing of productivity for banana and papaya cultivation, and increasing of mango, banana, and papaya price in the farmer level until its next 2 years period.
Keywords: trade liberalization, import, free trade, productivity, fruits
INTRODUCTION
Free trade is process of trade liberalization and conducted through the implementation of many international trade agreements. Indeed, it brings implication to the domestic trade. Tax exemption on imported goods is part of trade agreement, in which its consequence is many imported products will flood the domestic market. Finally, there will be very tight competition between imported and domestic products.
Agricultural commodities are commodity that affected by trade liberalization through the implementation of many global trade policies from international trade agreement such as AFTA, APEC, and other global agreements which required by WTO.
Horticulture products, especially fruits, are the most affected product due to global trade policy. Over years, the number of imported fruits tends to increase. FAO (2002) noted that Indonesian import quantity over 4 types of fruit (avocado, banana, orange, and mango) increase to the average of 15% per year for the period of 1990-2001 and keep increasing to the next period. Data from Department of Agriculture (2003) also showed the
increasing volume of imported or processed fruits during the period of 1996-2001, in which it increased for the average of 24% per year.
The increasing of imported fruits heavily affected to the trade management of domestic fruit. It can result in either negative or positive response. Negative response is the decrease of local fruit demand, in which it is implicated to the price falls and the decrease of farmer’s interest to cultivate local fruits. Jayati (2005) in her annual paper of
UNDP with the title of “Liberalisasi Perdagangan Pertanian” stated that the decrease of farmer’s
interest in cultivating local fruits showed by the decrease of productivity, land area, and local commodity production.
Penn’s research (2002) used econometric
Stated agricultural commodities, particularly to the Asia Pacific area.
The research of Allen and Lueck (1998) showed that the decrease of commercial agricultural business in United Stated during the last decades caused by globalization and technological advance. The development of technological advance in many countries results in lower production cost which in turn, it will lead to the lower price in global market. In addition, the development of global trade agreement and competition ability of import commodities will be larger to the local commodities of United Stated. It is strengthened by the research of Hoppe, situation will affect domestic trade performance.
Despite positive response of domestic productivity, many researches showed that there is negative response of many economic indicators due to the implementation of trade liberalization in many countries. Hoekman and Konan (2010) stated
that Egypt’s agricultural sector has negative
economic growth as the response of free trade policy in Egypt and United Stated.
Zhuang, Matson, and Koo (2007) stated that the implementation of regional trade agreement between Europe Union and India has more advantage effect for Europe than India. It showed that in many cases, implementation of trade liberalization has negative effect to the domestic production capacity. Therefore, assessing and studying the effect of free trade policy is really necessary, especially to develop strategy in maintaining trade performance of Indonesian local fruits.
Uruguay agreement in 2000 by WTO has encouraged agricultural sector to be more depended
on global trade management. Penn’s research
(2002) noted the increase of export balance for United Stated agricultural products from 51 billion dollars in 2000 to be 53.5 billion dollars in 2001. Penn also noted that 25% of United Stated agricultural products allocated for export market.
Trade liberalization through free trade, basically, associated to the exemption of trade restriction among the agreed countries, thus the market can come closer to the perfect competition market. The law of one price for one item expected to be realized with this trade liberalization (Anderson, 2001).
International trade in the free trade corridor, cannot be denied, is an economic activity where developed countries annexed developing countries. The high established import rate and subsidy for agricultural products in developing countries tend to increase demand of agricultural commodities in developing countries (Hertel, 2004).
Free trade implemented either in regional or global through many multinational agreements. Many agreements that established by producer countries or consumer of international trade commodities had been conducted during the period of 1998-2003. Those agreements particularly included rate and tax policy in the trade process. policy, rate, subsidy, protection, cartel, and dumping. Those six trade components are component that considered as important restriction in reaching economic liberalization goal. Reduction to this restriction will result in global trade that will only be determined by government, supply and competitive comparative superiority.
Agricultural commodity is one commodity that mostly affected by free trade agreement. It becomes the reason about why agricultural product is the main product that firstly established in many trade agreements of many countries, regions, and organizations.
Indonesian horticultural products suffered by significant impact due to this trade liberalization. Rapid increase of imported fruit quantity in the last 10 years is the result of global free trade implementation. FAO Data showed that import quantity to four main fruit types increase at 15% during 1995-2005 (Anonymous, 2007). That data confirmed by the other data from Indonesian Department of Agriculture, which noted that there is an increase of imported fresh fruits about 24% in the period of 1996-2003 (Anonymous, 2004).
Agricultural commodities have certain behavior in the international trade. Many important aspects make these agricultural commodities have different response in the trade than other products. Food security and sovereignty aspect which aside agricultural price and production efficiency mostly become obstacle to the trade of agricultural commodities that will be liberalized. Many countries establish large subsidy to maintain their food sovereignty which accompanied by
commodities, especially for food crop commodities.
McLaren and Josling (1999) showed that many critical points of competition in agricultural sector as follow: (a) input competition; (b) agribusiness competition; (c) processing industry competition; and (d) trade competition and distribution competition. Among those critical points, trade competition is the strongest factor which affect the success of free trade scheme. Although Uruguay Round had established each country to converse their non rate restriction (such as subsidy, protection, and so forth) to the rate restriction, however, there still an obstacle of market structure to the certain agricultural commodity.
As the main cause of import competition, trade also known as market instability source for many producers (Benson, Marchant, and Rosson, 1999). Market structure from certain commodity tend to create many variations, thus it will be various risks for various producers.
Huang, Huang, and Wells (2011), in their research about the effect of fresh product import for United Stated market, noted that the imported fresh products has played important role in creating narrower price fluctuation. Although this study did not measure the effect of import for local producers, however, this research presented visualization to the importance of research about import effect in creating price variation. Import gives supply assurance which accompanied by stability effect to the consumer price and retail price of fresh food products.
Many researches above showed that competition as the consequence of import is not always result in bad impact to the whole economic indicators. However, there is not much assurance which show that import has no negative impact to the performance of local product trade.
AFTA, Asean Free Trade Agreement which formulated in 1992 and actively implemented on January, 1st 2002, is one of free trade agreement which signed by 10 countries in the South East Asia region. Based on Hanoi agreement in 1998, this agreement resulted rate reduction policy gradually over 42,000 items of import rate which prevailed in Indonesia, Malaysia, Singapore, Brunei, Thailand, and Philipine – the first six countries of ASEAN. In 2001, it is expected that trade rate among the first six countries of ASEAN will decrease up to less than 3.18%, and then reach 2.41% in 2003. In 2010, it is expected that ASEAN countries have implemented free rate trade. The
same conclusion also will be established on 4 other countries in the next 2014 (Severino, 2002).
Although AFTA is not the only one of trade liberalization in Indonesia, however, by the establishment of AFTA, it can be assured that there will be logic implication for its implementation to the domestic trade performance of Indonesia. In studying free trade implication, especially to the fruit products, it is important to know how domestic trade performance gives response to the free trade.
RESEARCH METHODS
This study uses secondary data during the period of 1980-2006. Data that used in this research was obtained from FAOstat database and completed by supporting data from Department of Agriculture, Department of Industry and Trade, Directorate of Customs and Excise, and Indonesian Central Bank. Firstly, data are tested by Unit Root Test to test whether or not the data was stationary. It is necessary particularly for time series data and data with large coverage (Anindita, 2008).
Analysis method in this research that used to answer the research objective was linear regression analysis (OLS-Ordinary Least Square) over many mathematic models. These would explain the study objectives.
The mathematic model to analyze the implication of trade liberalization to the trade performance of local fruits as follows:
The implication towards implementation of free trade agreement to the change of import
IMij = a1.i + b1.i DTj ... (1)
The dummy variable, where D=0 in the previous period of AFTA implementation (2002) and D=1 in the period after 2002.
The effect of fruit import to the domestic supply Sij = a2.i + b2.i IMij ... (2)
The effect of fruit import to the land area of fruit cultivation
Aij = a3.i + b3.i IMij ... (3)
The effect of fruit import to the fruit productivity Yij = a4.i + b4.i IMij ... (4)
The effect of fruit import to the fruit price in producer level
Hij = a5.i + ... b5.i IMij ... (5)
Aij = Land area of fruit cultivation(Ha)
Hij = Fruit price in producer level (IDR/Kg)
IMij = Number of imported fruit (ton)
Sij = Total fruit supply in Indonesia (ton)
Tj = Year
Yij = Fruit productivity (ton/ha)
i = Commodity type to i (Apple (1), Mango (2), Banana (3), orange (4), Papaya (5)) j = Year to j (1980 – 2007)
RESULTS AND DISCUSSION
Import and Price
To fulfill domestic demand, Indonesia conducted fruit import from many countries. The number of imported fruit tended to be higher after year period of 1995. The increase of domestic demand as the result of consumer preference and the increasing number of population led to the increasing number of fruit import.
Import of mango commodity tended to increase for not less than 3 tons/year during 1974-2006. The increasing of imported mango was not quite different with banana commodity (3.6 tons/year). It was different with the increase of
import number for orange, apple, and papaya commodity.
For orange and apple commodity, the increasing number of import reached 3.581 tons/year and 3.289 tons/year. This number was the highest of import growth compared with many other fruit commodities. Papaya commodity, although had no import growth as high as orange and apple commodity, however, it still showed quite high import growth for 4.26 tons/year. Based on AFTA formulation in 1992, as the most dominant free trade policy, this research used year of 1998 as parameter in assessing the implication of free trade policy to the many indicators of fruit trade performance. 1998 was starting point as gradual rate/tax reduction of many commodities agreed in AFTA. Target from this gradual tax reduction was to reduce tax up to 2.3% in 2003.
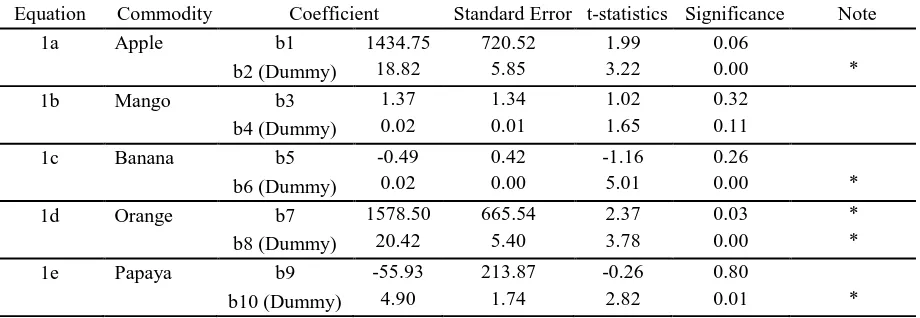
This tax reduction, indeed, would have impact to the many indicators of fruit trade performance. Fruit import was the first factor that would be affected by free trade policy. Regression analysis used dummy approach to the 5 linear equations (1) showed the result as follows.
Table 1. Analysis Result to the Implication of Free Trade Policy towards the Increase of Import Number for 5 Fruit Commodities
Equation Commodity Coefficient Standard Error t-statistics Significance Note 1a Apple b1 1434.75 720.52 1.99 0.06
b2 (Dummy) 18.82 5.85 3.22 0.00 * 1b Mango b3 1.37 1.34 1.02 0.32
b4 (Dummy) 0.02 0.01 1.65 0.11 1c Banana b5 -0.49 0.42 -1.16 0.26
b6 (Dummy) 0.02 0.00 5.01 0.00 * 1d Orange b7 1578.50 665.54 2.37 0.03 * b8 (Dummy) 20.42 5.40 3.78 0.00 * 1e Papaya b9 -55.93 213.87 -0.26 0.80
b10 (Dummy) 4.90 1.74 2.82 0.01 * *) Statistically significant (α = 0.05) N = 25
Table above shows that among 5 fruit commodities, only mango which not shows significant response to the change of import number to the implementation of free trade policy. In general, free trade policy had implication to the increase of high coefficient level. In other words, there was positive change of import number as the result of free trade policy implementation. The highest change showed by orange commodity (20.42) and apple commodity (18.82).
The analysis result above could be stated as rational response of rate/tax reduction. Rate/tax reduction as trade liberalization tended to increase
fruit import quantity. That statement accompanied by significance of dummy coefficient to the apple, banana, orange, and papaya commodity.
The effect of fruit import to the domestic supply
The implication of international trade policy also showed by the response of domestic fruit supply to the change of fruit import performance. Equation 2 described relationship between the changes of
import quantity to the change of domestic fruit supply. The result of OLSQ analysis in assessing the effect towards the increase of import number for 5 fruit commodities to the fruit domestic supply showed the result as follows:
Table 2. Response of domestic supply to the increase of import number for 5 fruit commodities Equation Commodity Coefficient Standard
Error
t-statistics Significance Note 2 Apple IM-APL -28.51 24.29 -1.02 0.25
Mango IM-MGG -10651.02 5224.36 -0.48 0.05 * Banana IM-PSG -2192.70 2218.17 -0.18 0.36
Orange IM-JRK 61.78 26.72 2.33 0.03 * Papaya IM-PPY -0.85 24.60 -0.06 0.97
To the Dependent Variable Sij
*) Statistically significant (α = 0.05)
Table 2 above shows that domestic supply of local fruits tend to decrease as the response of fruit import. The decrease of domesti
increase of fruit import, as what’s been showed in
the analysis result, described the decrease of domestic production as the consequence of imported fruit competition. Analysis result showed that only mango and orange import that significantly affected the change of domestic supply.
It was in line with the research of Allen and Lueck (1998), although it did not show evidence to the supply decrease, however, it sh
The effect of fruit import to the land area of
fruit cultivation
Implication to the free trade policy, which marked by fruit import performance that affected to the domestic supply, also affected to the cultivation which described by the change of cultivation land area. The effect of assessed import quantity which affected cultivation land area arranged in the best time space, in which it was obtained time space with the best analysis result at t0, t-1, and t-2. The
effect of fruit import quantity to the change of cultivation land area through equation 3 showed the result as in Table 3.
Table 3. The Effect towards the Increase of Import Number for 5 Fruit Commodities to the Change of Cultivation Land Area
Equation Commodity Coefficient t0 Note t-1 Note t-2 Note 3a Apple QIMAPL -4.23 * -1.40 -4.95 * Land Area
of Mango Cultivation
Mango QIMMGG -409.33 -925.06 -982.04 Banana QIMPSG -212.53 -242.55 * -286.61 * Orange QIMJRK 5.54 * 3.48 * 6.53 * Papaya QIMPPY -0.42 -1.52 -0.13 3b Apple QIMAPL -2.03 -1.19 -2.26 Land Area
of Banana Cultivation
Mango QIMMGG 101.78 -654.93 -867.15 Banana QIMPSG 30.48 35.46 -108.72 Orange QIMJRK 2.65 2.29 3.83 * Papaya QIMPPY 3.48 * 4.57 * 3.81 * 3c Apple QIMAPL -2.39 * -2.42 * -2.13 Land Area
of Orange Cultivation
Mango QIMMGG -392.47 14.10 -241.19 Banana QIMPSG -164.53 -130.14 -175.24 Orange QIMJRK 3.53 3.25 * 2.85 Papaya QIMPPY -1.57 -0.90 1.32 3d Apple QIMAPL -0.53 * -0.07 -0.17 Land Area
of Papaya Cultivation
Mango QIMMGG -22.12 -38.03 -48.77 Banana QIMPSG -26.17 -19.13 -7.27 Orange QIMJRK 0.65 * 0.22 0.29 Papaya QIMPPY -0.48 -0.02 0.00 *) Statistically significant (α = 0.05)
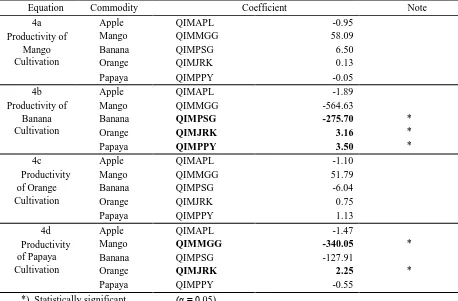
Table 4. The Effect towards the Increase of Import Number for 5 Fruit Commodities to the Change of Fruit Cultivation Productivity
Equation Commodity Coefficient Note 4a Apple QIMAPL -0.95
Productivity of Mango Cultivation
Mango QIMMGG 58.09 Banana QIMPSG 6.50 Orange QIMJRK 0.13 Papaya QIMPPY -0.05 4b Apple QIMAPL -1.89 Productivity of
Banana Cultivation
Mango QIMMGG -564.63
Banana QIMPSG -275.70 * Orange QIMJRK 3.16 * Papaya QIMPPY 3.50 * 4c Apple QIMAPL -1.10
Productivity of Orange Cultivation
Mango QIMMGG 51.79 Banana QIMPSG -6.04 Orange QIMJRK 0.75 Papaya QIMPPY 1.13 4d Apple QIMAPL -1.47 Productivity
of Papaya Cultivation
Mango QIMMGG -340.05 * Banana QIMPSG -127.91
Orange QIMJRK 2.25 * Papaya QIMPPY -0.55
The effect of fruit import to the fruit
production
The change of imported fruit number also affected
to the change of productivity. Farmer’s interest to
intensively cultivate fruit commodities would directly be affected by price and supply. Price and supply are function from import quantity, in one side, and local fruit production, in the other side. Table 4 shows the change of productivity as the implication to the change of imported fruit quantity.
Analysis result above showed that the increase of imported fruit tended to affect significantly to the change of productivity for banana and papaya cultivation. The higher imported fruit, the lower cultivation productivity to those two commodities. Different with the case above, productivity of mango and orange cultivation was not affected by the change of imported fruits.
It described that the increase of imported main fruits tended to cause competition in the domestic
market, in which it could not be balanced by banana and papaya commodity. The low competitiveness among those two commodities,
simultaneously, would lead to the low farmer’s
interest in conducting intensification of banana and papaya cultivation.
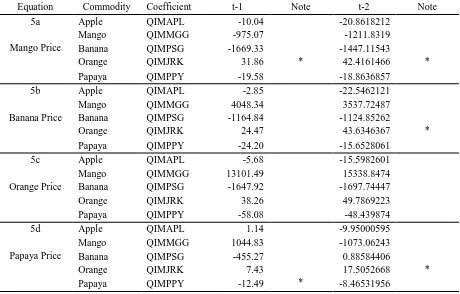
The effect of fruit import to the fruit price
in producer level
Analysis that conducted by using OLSQ method showed insignificant result to the relationship between the change of import quantity and the change of price in farmer level. Further data processing was conducted based on assumption that price at farmer level in certain year was affected by supply pattern in the previous year. Based on that assumption, it was conducted by OLSQ analysis on time lag combination to t-1, t-2, t-3, and t-4. OLSQ analysis showed that the best regression equation obtained in t-1 and t-2. The result of OLSQ analysis to the linear regression equation to explain that relationship presented in the Table 5.
Table 5. The effect towards the Increase of Import Number for 5 Fruit Commodities to the Change of Fruit Selling Price in Farmer Level
Equation Commodity Coefficient t-1 Note t-2 Note 5a Apple QIMAPL -10.04 -20.8618212
Mango Price
Mango QIMMGG -975.07 -1211.8319 Banana QIMPSG -1669.33 -1447.11543
Orange QIMJRK 31.86 * 42.4161466 * Papaya QIMPPY -19.58 -18.8636857
5b Apple QIMAPL -2.85 -22.5462121
Banana Price
Mango QIMMGG 4048.34 3537.72487 Banana QIMPSG -1164.84 -1124.85262
Orange QIMJRK 24.47 43.6346367 * Papaya QIMPPY -24.20 -15.6528061
5c Apple QIMAPL -5.68 -15.5982601
Orange Price
Mango QIMMGG 13101.49 15338.8474 Banana QIMPSG -1647.92 -1697.74447 Orange QIMJRK 38.26 49.7869223 Papaya QIMPPY -58.08 -48.439874 5d Apple QIMAPL 1.14 -9.95000595
Papaya Price
Mango QIMMGG 1044.83 -1073.06243 Banana QIMPSG -455.27 0.88584406
Orange QIMJRK 7.43 17.5052668 * Papaya QIMPPY -12.49 * -8.46531956
*) Statistically significant (α = 0.05)
The increase of import number for orange commodity tended to increase the price of mango, banana, and papaya commodity in the farmer level.
commodity could not be replaced by orange commodity, especially imported orange.
The effect of fruit import, particularly orange commodity, would affect to the increase of mango, banana, and papaya price at farmer level in the first and second year after the import period (1 and t-played an important role in creating narrower price fluctuation.
CONCLUSION
The research results show that the implementation of free trade has implication on increasing of import quantity for apple, orange, banana, and papaya commodity, decreasing of total domestic fruit supply, decreasing of land area for mango, banana, orange, and papaya cultivation until its next 2 years period (t-2), decreasing of productivity for banana and papaya cultivation, and increasing of mango, banana, and papaya price in farmer level to the next 2 years period.
There were many negative indicators of productivity; however, the increase of price in producer level as the implication of free trade liberalization showed that there was positive potential of trade liberalization. The increase of price in producer level could encourage larger production. By directing production to the products, which have good competitiveness with imported product, then farmers would have opportunity in gaining better welfare.
REFERENCES
Allen, D.W., and D. Lueck. (1998). “The Nature of
the Farm.” Journal of Law and
Economics 41(2): 343–386
Anderson, K., (2001). Globalization, WTO and ASEAN. Disiapkan secara khusus untuk Globalization for Asean Economic Bulleting. Centre of International Economic Studies. University of Adellaide, Australia.
Anonymous, (2003). Data Perkembangan Volume dan Nilai Ekspor Komoditar Pertanian Indonesia Tahun 1996-2001. Departemen Pertanian – Jakarta.
_______, (2004). Data Produksi Tanaman Buah-buahan Indonesia. Biro Pusat Statistik. Jakarta.
_______.(2007). Data Base Buah-buahan Tropika. Pusat Kajian Buah-buahan Tropika. LPPM Institut Pertanian Bogor. www.rusnasbuah.or.id.
Benson G.A., Mary Marchant and Parr Rosson. US. Agriculture and International Trade. Risk Management, Farm Policy and International Trade. Kansas state University.
http://www.oznet.ksu.edu pada : 20 April 2015, 07:33. Shrimp Market. CEPR Publication. University of Texas, Austin.
Ebert R.J. dan Ricky W. Griffin. (2005). Business Essential, Pretince Hall Inc. New York.
Hoppe, R.A., J.M. MacDonald, and P. Korb.
(2010). “Small Farms in the United
States: Persistence under Pressure.” Economic Information Bulletin 63, Economic Research Service, USDA, Washington, DC.
Hertel, T.W. (2004). Annex on Trade. Center for Global Development. United States of America.
Huang, Sophia Wu., Kuo S. Huang and Hodan Farah Wells. (2011). Presentation at the Agricultural & Applied Economics
Association’s. Economic Research Service U.S. Department of Agriculture. AAEA & NAREA Joint Annual Meeting, Pittsburgh, Pennsylvania, July 24-26, 2011.
Jayati, Gosh. (2005). Trade Liberalization in Agriculture : An Examination of Impact and Policy Strategies with Special Refference to India. Annual Paper of Human Development Report Office. UNDP.
Agricultural Trade. International Agricultural Trade Consortium. Working Paper No. 99-7. July 1999. Renan Zhuang, Jeremy W. Mattson and Won W.
Koo. (2007). Implications of the U.S.-Korea Free Trade Agreement for Agriculture and other Sectors of the
Economy. Agribusiness & Applied Economics Report No. 619, October 2007.