Lefteris Mantelas1, Poulicos Prastacos1 , Thomas Hatzichristos2, Kostis Koutsopoulos2
1 Regional Analysis Division, Institute of Applied and Computational Mathematics, Foundation for Research and Technology-Hellas,
GR 71110, Heraclion Crete, Greece [email protected] [email protected]
2 Department of Geography and Regional Planning, National Technical University of Athens, I.Politechniou 9,
GR 15786, Zografou, Greece [email protected] [email protected]
Abstract: In this paper we present a linguistic approach for modeling urban growth. We have developed a methodological framework which utilizes Fuzzy Set theory to capture and describe the effect of urban features upon urban growth and applies Cellular Automata techniques to simulate urban growth. While there are several approaches that combine Fuzzy Logic and Cellular Automata for urban growth modeling, we herein focus on the ability to use partial knowledge and combine theory-driven and data driven knowledge. To achieve this, a parallel connection between the input variables is introduced which further allows the model to disengage from severe data limitations. In this approach, a number of parallel fuzzy systems is used, each one of which focuses on different types of urban growth factors, different drivers or restrictions of development. The effects of all factors under consideration are merged into a single internal thematic layer that maps the suitability for urbanization for each area, providing thus an information flow familiar to the human conceptualization of the phenomenon. Following, cellular automata techniques are used to simulate urban growth. The proposed methodology is applied in the Mesogeia area in the Attica basin (Athens) for the period 1990-2004 and provides realistic estimations for urban growth.
Keywords: Urban Growth, Fuzzy Logic, parallel conection of partial
knowledge, Cellular Automata, Mesogia - Athens
1 Introduction
opportunities. As a result, financial, social and cultural activities flourish in large urban areas attracting thus more people to live, work, produce and consume within the urban environment. In 2007, 50% of the global population was living in town and cities while it is estimated that 60 million people move to cities in a yearly basis. What is more, these rates are expected to be preserved for the next 30 years (Marshall, 2007).
The changes in financial and social activities within the city, the settlement of new population and the emergence of new activities lead to the reorganization of land use and the production of buildings and services‟ networks in accordance to the population needs (Κοηθηθός, 1986). What is more, changes are also driven by the increasing expectations of the urban population which are reflected by peoples‟ residential choice. People‟s expectations may refer to buildings‟ attributes such as more floor-space and better quality of construction but are also referring to locational characteristics. People desire to live in areas that among others:
provide accessibility to high speed road networks, parking areas and public transportation system
are in the vicinity of urban green areas and parks provide access to goods, services and facilities consist a healthy and safe environment
Apparently, seldom do the above criteria overlap and when they do they lead to high real estate values. In this respect, urban growth can be described as the spontaneous spatially referenced tradeoff between different types of human needs and expectations. As a result, monitoring and comprehending urban growth relies heavily on identifying the residential choice criteria and the factors that attract or repel new settlements. For this reason, fuzzy logic has a key role to play in the challenging field of urban modeling; a role whose importance stems from the fact that it mimics the ways in which humans make decisions in an environment of uncertainty and imprecision (Zadeh, 1993).
2 Challenges in Urban Modeling
The term „modeling‟ refers to creating a strictly defined analog of real world by subtraction (Κου όπουζος, 2002). Yet there is no rigorous framework for modeling such a spatio-temporal phenomenon as urban growth since there lies great inherent spatial, temporal and decision-making heterogeneity (Cheng & Masser, 2003), which results from socio-economic and ecological heterogeneity itself. Moreover there is something special regarding the spatio-temporal nature of the urban growth. Urban growth does not simply evolve in time; it also spreads in space and not always continuously. This means that apart from the difficulties of studying a spatial phenomenon, when studying urban growth we may come across first-seen qualitative phenomena and interactions, that cannot be modeled mathematically in an easy way.
and process, and the interaction and parallelism among different scales, is poor (Dietzel & Clarke, 2004). We deal with a phenomenon which exists but it is also recreated in space, extending itself both continuously and discontinuously in space while evolving in time. Moreover, its dynamics evolve in time as well and all there is for modeling urban growth is our experience of the phenomenon itself, which might be inaccurate for describing its future evolution.
On top of these, for an urban model to be useful it should be able to describe the objects, the relations and it‟s assumptions in an open, visible and comprehensible way. This way, results and the underlying mechanisms can be challenged by experts (Ness & Low, 2000) and get improved. At the same time, an urban model should be able to be used both for forecasting and describing urban growth (Liu, 2009). This allows the model not only to estimate the future evolution of an urban system but also to unveil the underlying structure and procedures of the urban growth phenomenon. Apparently, the usability of the estimations and the knowledge provided by the model are as much important as the model‟s consistency to the real world.
3 Application of Fuzzy Logic for Urban Modeling
„Where is a mountain?‟ is a simple question to ask, but it is not easy to give a consistent, precise response (Fisher & Wood, 2004). Fuzziness is an inherent attribute of information; yet crisp GIS tend to force a binary representation of reality (Liu & Phinn, 2001) despite the fact that issues related to vagueness, imprecision and ambiguity can be addressed by the fuzzy set theory and fuzzy logic (Malczewski, 2004).
Fuzzy logic was originally proposed by Zadeh (1965) as a generalization of binary logic and allows the continuous analysis between “false” and “true”. It is used to model imprecision, vagueness and uncertainty in real world and bridges the gap between qualitative and quantitative modeling. Fuzzy logic does not comply with the binary property of dichotomy; hence fuzzy variables may consist of partially overlapping fuzzy sets. The mathematical form of a fuzzy set is fully described by a membership function which returns a membership value (η) within [0,1] for a given object while a linguistic variable is used to describe its quality. Linguistic variables, apart from describing primitive fuzzy sets, are also used to define new sets, based on the primitive ones allowing thus the management of information in a way closer to this of human conceptualization.
The knowledge base is represented as “IF…THEσ” rules, connecting hypotheses to conclusions through a certainty factor while inference is divided (in general) in three stages (Hatzichristos & Potamias, 2004; Kirschfink & Lieven 1999):
aggregation that returns the fulfillment of hypothesis for every rule individually
implication that combines aggregation‟s result to the rule‟s certainty factor (CF) resulting to the degree of fulfillment for each rule‟s conclusion
There is a great number of applications of fuzzy logic in spatial analysis; these include defining and locating spatial objects (Bejaoui et al., 2007; Hatzichristos & Potamias, 2004; Fisher et al., 2007; Fisher & Wood, 2004), mapping continuous spatial phenomena (Fonte & Lodwick, 2005; Joss et al., 2008), defining topological relations (Matsakis & Nikitenko, 2005; Takemura et al., 2005), satellite images classification (Nedeljkovic, 2006), analysis of relations between geographical objects (Guesgen, 2005, Kratochwil & Benedikt, 2005), statistical analysis of spatial data and data mining (Kollias et al., 1999; Liu & George, 2005), development of DSS and expert systems (Kalogirou, 2002; Stefanakis et al., 1996), spatial and temporal interpolation (Dragicevic, 2005; Dragicevic & Marceau, 2000 & 2001).
For the case of urban modeling, the reason to apply fuzzy logic is twofold. First, it provides improved mapping of land use and land cover (Arijit et al., 2006; Henning, 2003). Second, it provides a mechanism to represent human decision making in linguistic terms and to approximate complex non-linear systems with simple models (Chen & Linkens, 2004) making thus the analysis of complex systems easier (Setnes et al., 1998).
Fuzziness in urban growth originates from a series of sources which can be found as much in a definition and representation level, as in an analysis and simulation level. To start with, urban cover is a rather abstract concept whose definition is based more on functional criteria rather than morphological. Additionally, there is no such thing as sharp boundaries between urban, partly urban and rural or forest areas (Liu & Phinn, 2001). Therefore, fuzzy classification offers a better choice in land-use mapping (Henning, 2003). What is more, fuzzy representations can capture mixed use and coverage (Heikkila et al., 2002).
From a technical point of view, fuzzy modeling can be interpreted as a qualitative modeling scheme which describes system behavior using fuzzy quantities presenting thus a hybrid quantitative-qualitative approach (Chen & Linkens, 2004). This allows describing partial and multiple relations in a distinct way. Nevertheless, the prime advantage off fuzzy modeling is the facility for the explicit knowledge representation in the form of if-then rules and the mechanism of human-like reasoning in linguistic terms (Chen & Linkens, 2004).
The application of natural language allows the direct use of empirical knowledge for the phenomenon of urban growth which includes experts‟ opinions, theoretical approaches and historical registrations for the development of cities. Moreover, it allows the transfer of knowledge based on empirical similarity patterns. Nevertheless, what is more important is the ability of fuzzy logic to mimic the human-like decision making and describe the underlying mechanisms in terms of fuzzy multi-criteria systems. A large part of the applications of fuzzy logic for urban growth simulation incorporates cellular automata techniques.
4 Fuzzy Urban Cellular Automata
2003). The interactions take place in discrete time steps with each cell‟s state at any time period estimated by considering the state of the neighboring cells. This approach is repeated continuously in a self-reproductive mechanism with no external interference. Growth is thus simulated through a bottom up approach and this makes CA an appropriate technique for simulating complex phenomena that is difficult to model with other approaches.
There is a great variety of highly sophisticated crisp approaches concerning CA based urban growth modeling. Among them, the stochastic approach of Mulianat et al (Mulianata & Hariadi, 2004), the object-oriented approaches of Cage (Blecic et al., 2004) and Obeus (Benenson & Kharbash, 2006), the environment Laude that combines CA and Genetic Algorithms (Colona et al., 1998) and some widely applied models, such as Sleuth (Clarke et al., 1997; Dietzel & Clarke, 2004; Dietzel et al., 2005) and Moland (Engelen et al., 2007). Crisp urban CA may be categorized in many different ways, in general though, they might be either quantitative or qualitative. Quantitative models express the urban dynamics in terms of numerical equations. Such models focus on the efficiency of the estimations and can provide rather accurate results. What such models are not capable of is to map and express the qualitative characteristics of urban growth phenomenon, which are a result of the socio-economic decision making of the urban population.
Qualitative models on the other hand are rule-based and are capable of such mapping and expression since they focus on the quality of causes and effects. They fail though to compete with numerical models in following the exact numerical path of urban growth. What is more, in the binary world of crisp rule-based systems, qualities, objects and relations are strictly defined and either exist or not. There is no such thing as partial, uncertain or imprecise fact, membership or relation and this is not the way reality works.
The combination of CA and fuzzy logic under the term Fuzzy Cellular Automata presents a hybrid approach that bridges qualitative and quantitative CA. In this approach quantitative information can be converted to qualitative and vice versa through the implementation of membership functions. Fuzzy Cellular Automata are a rather new development; yet they have been implemented in a series of spatial applications including fire propagation models (Mraz & Zimic, 1999) forest insect infestation (Bone et al., 2006), and spatial load of electricity demand (Miranda & Monteiro, 1999).
Liu and Phinn (2001, 2003 & 2005) proposed an approach with significant differences. To start with, both input and output are represented as fuzzy sets which are empirically designed. Additionally, population density was used to initialize the fuzzy urban status of each area and define its propensity to urbanization. Finally, in this approach, rules express logistic patterns of evolution while the input parameters determine the speed of growth. The model was applied in Sydney for the period 1971-1996 during which urban cover grew by 28%. For this case study, the Kappa1 index of agreement calculated in 3X3 neighborhoods was 90%. Despite the high levels of accuracy, the model appears to focus in the partly urban to urban transition but it is not equally effective when it comes to rural to urban transition. Our approach attempts to combine the advantages of these two models and reduce their disadvantages in an effective modeling environment that can use both theory-driven and data-driven knowledge while retains a knowledge base form that is adjusted to the available data.
5 The Modeling Framework
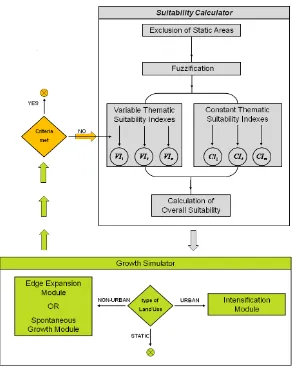
While most contemporary urban models go through an in depth analysis of selected parameters, we propose a modeling structure that allows the parallel “in-width” analysis of any given spatial or spatially referenced variable. We have developed a modeling structure (figure 1) based on our previous work (Mantelas et al., 2007 & 2008) that attempts to describe a work flow familiar to the human perception of the urban growth process. A structure based upon the relations between facts and procedures so that even partial results may be helpful to the better understanding of the process.
Apparently the model‟s structure and the systems‟ connection are tightly related to the model‟s efficiency, the information‟s flow and the interpretability of the extracted knowledge. Moreover, a generic form of the model is sustained which allows to avoid severe data limitation (more data provide better results, less data still provide results though); hence the model can be transferred to both data-rich and data-poor applications.
Our approach uses spatially variable rules that may be either data-driven or theory-driven; hence they may fit better to reality allowing the user to overcome the limitations of the available data by using exogenous knowledge adapted to the model by empirical similarity patterns. Empirical rules are enabled by the fact that the knowledge base is expressed in common language, which makes this model friendly and usable, especially to the non-expert users.
We propose a structure of fuzzy systems each one of which receive different input and conclude over certain aspects of the overall dynamics while the system that simulates the evolution of the urban growth further incorporates CA techniques. An
important feature of the model is that the Growth Simulator does not access the input data directlyν instead it operates upon a single intermediate layer called „suitability for urbanization‟ that is the output of the Suitability Calculator.
Fig. 1. The structure of the modeling framework
Though the main idea of combining CA and fuzzy logic exists in previous approaches, the herein presented approach presents some advantages; more specifically:
it allows the combination of theory-driven and data-driven knowledge it supports a reducible/extensible form of knowledge base which means that:
o it does not require specific data apply
spatial parameters may be taken into consideration within each rule’s certainty factor.
advanced fuzzy hedges are introduced
simulation of spontaneous growth is supported
The model can be used to reproduce the spatial patterns of urban growth but requires the amount of urban cover to be allocated in a certain period to be given as an input parameter. This allows us to measure real time as a function of the allocated growth while at the same time functions as the exit criterion.
6 The Suitability Calculator
The suitability calculator receives input data and concludes over the suitability for urbanization for each cell. The role of the suitability is twofold; on the one hand defines the maximum urban cover that can be allocated to a non-urban cell and on the other determines the maximum densification speed of an already urban cell. Initially a number of fuzzy systems is used to process the input data and estimate the thematic suitability for urbanization for distinct groups of input variables. The themes that can be used depend on data availability with physical/natural (slope, land use) and accessibility (road networks) being the cardinal themes.
Data-driven rules in these systems have a plain hypothesis premise – which results to trivial aggregation – and depict the average distribution of urban cover appearance for each fuzzy set of the variable. Theory-driven rules can be added without affecting the data-driven ones and may have a complex hypothesis while the aggregation operators used relying on the syntax of the premise. Both types of rules though, apply the product operator for implication and conclude over thematic suitability indexes that consist of a single fuzzy set (high).
In order to extract the rules for these systems we calculate the fitting between each fuzzy set of each input variable and the urban fuzzy set. This way, each fuzzy set of each input variable forms the rule‟s hypothesis while as the correspondent certainty factor is taken the value of the fitting without any further calibration being required at this stageν i.e. the sets “low distance from secondary road network” and “high urban cover” fit each other by 56%, hence the rule becomesμ
IF “distance from secondary road network is Low”, THEN “suitability is High” | CF=0.56
What is more, the thematic suitability systems apply accumulation using the algebraic sum operator – also known as the „probabilistic τR‟– in the paradigm of the Dempster-Shafer theory of evidence (Ahmazadeh & Petrou, 2001). The central notion is that the more rules that lead to the same conclusion, the less likely it is for this conclusion to be false. Its advantage is that it takes into account not only the strength of each result but also the number of rules that conclude to this specific resultν it‟s disadvantage on the other hand is that it tends to return higher values than normal as the number of rules whose hypotheses are relatively dependent increase.
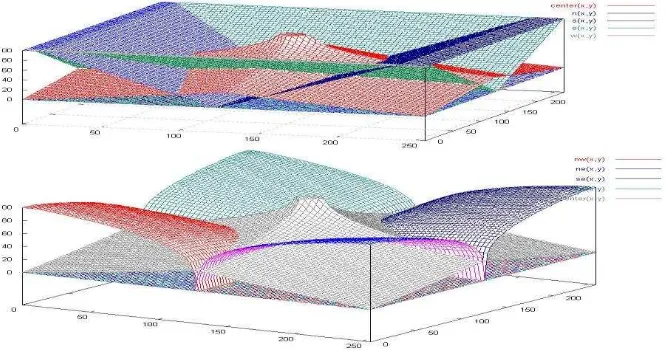
This allows us in example to assign different suitability to urbanization for a certain land use in the North-east and South-west parts of the area under study. Spatial variability is gained by expressing rules‟ certainty factors as a function in terms of a spatial 2-D fuzzy variable with 9 fuzzy sets which expresses the relative location of a cell within the study area (figure 2).
The thematic indexes are considered to be either constant or variable in time. Static indexes are calculated only once while variable ones may change in consecutive steps. A suitability index may be treated as variable for three reasons:
input variables change in time i.e. road network or subway lines
input variables do not change in time, but their effect on urban growth is, i.e. slope or distance from the sea
the combination of the above.
It is evident that in order to introduce variable suitability indexes additional information is required. For the first case, insight to the planned projects and developments is needed while the second case requires a time-series of data or historical knowledge of them. Obviously, the third case needs both of them.
Once the thematic suitability indexes are calculated, they are merged into a single overall suitability index which in the same fashion consists of a single fuzzy set (high). This is accomplished by a separate fuzzy system that applies exclusively the Algebraic Sum as an aggregation operation upon the following rule:
IF “Index A, … Index N are High ”, THEN “overall suitability is High” | CF=1.
Fig. 2. graphs of the fuzzy sets of the 2-D spatial variable, the horizontal level is a square re-parameterization of the area under study while the vertical axis is the membership values for each spatial fuzzy set: center, N, S, E, W (top) and center, NE, NW, SE, SW (bottom)
simplification is both necessary and useful (Ness & Low, 2000). What is next, each thematic system focuses on both the relations and the diversifications of the input variables (i.e. if density of road network is positive, then obviously the distance from road network is zero and vice versa) and as a result the outputs – the thematic indexes – tend to be less correlated to each other than the input variables. Finally, it is much easier and less risky to update the (variable) thematic indexes rather than the initial change and in this respect are excluded by the model. The exclusion criterion is a full or high membership in the “not high overall suitability” fuzzy set. Additional empirical criteria may be added to exclude cells that are be covered by forests, have very high slopes or similar attributes.
Dynamic non urban areas are then processed by a hybrid fuzzy system that incorporates CA techniques in order to simulate the transition from non urban to urban. This system operates in two distinct levels, edge expansion and spontaneous growth, each one of which is applied by one rule that uses the overall suitability as a roof for the conclusions‟ valueμ
Level 1 - edge expansion: IF “Cell Suitability is High” AND “Neighborhood is
Urban ”, THEN “Cell is Urban” | CF=cf1.
Level 2 - spontaneous growth : IF “Cell Suitability is EXTREMELY High” AND
“Neighborhood is NOT non-Urban ”, THEN “Cell is Urban” | CF=cf2.
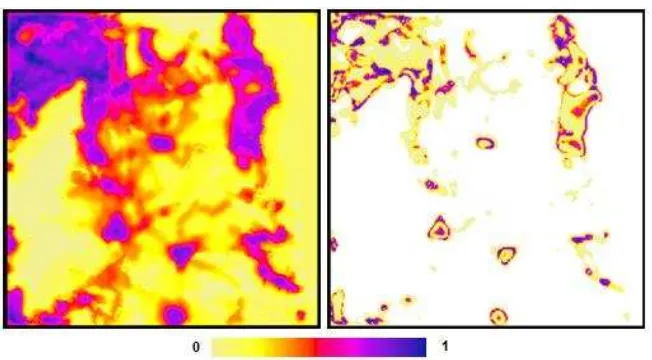
Level 2 applies the fuzzy hedge „extremely‟ that is designed to increase membership values that are greater than 80% while decreases smoothly but very fast as initial intensification module that applies an exponential implication operator. The syntax of the rule is essential the same as in Level 1:
Level 3 - intensification: IF “Cell Suitability is High” AND “Neighborhood is
Fig. 3. Visualization of the membership of each cell in the „overall suitability high‟ set (left) and the effect of the fuzzy hedge „extremely‟ on the same set (right)
The computational difference though is that the new operator raises the membership value of the conclusion premise in the power of the hypothesis complement. Given the fact that membership values, certainty factors and aggregation results are bounded in [0,1], if the hypothesis of the rule is not met at all, such a rule results to no change in the fuzzy set of the conclusion; it returns the initial membership value. On the other hand if the hypothesis is fully met and the rule is deterministic, it results to a certain conclusion – a membership value 1. In any other case it returns a membership value within (m,1) where m is the initial membership value.
In the hybrid fuzzy systems we may additionally use simple empirical or common sense rules while all rules are subjected to a calibration process to determine the certainty factors which may vary in space. What is more, spatial variation allows us to potentially use neighborhoods of different radius in different areas. Nevertheless, due to the (in general) irreversible nature of CA, data for two time-points may depict the result of the CA process but not the dynamic or the specific form of its transition engine; in such a system, simulation is the only way to predict outcomes (Clarke et al., 1997). As a result, at this stage, calibration takes place manually through trial and error. Having though reduced the number of variables that are used, it is relatively easy - and even kind of fun in a more literal sense of Urban Gaming Simulations (Cecchini & Rizzi, 2001) to experiment with each rule‟s syntax and its parameters fine tuning.
8 Application of the Model
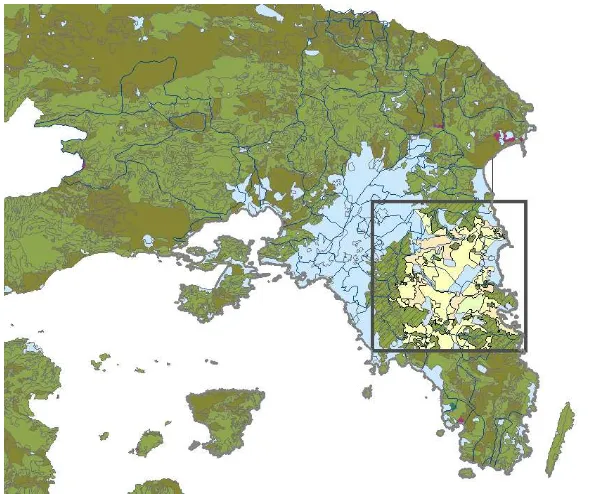
Mesogia has been doubled. Recently the new international airport, the extension of the subway and train lines and the construction of a new highway in Mesogia have influenced urban growth not only in terms of the growth rate but also in terms of the location of the growth. What is more, Mesogia can be considered relatively autonomous when studying urban growth since it is physically separated by the mount of Hemmetus in the West and Aegean Sea in the East, while neither Northern, nor Southern areas are significantly urbanized.
In our study the available data for Mesogia include the Corine Land Cover database (100X100m spatial resolution) for 1990 which are available from the European Environmental Agency and a Corine based classification for 2004 produced by GeoInformation S.A2. Most of the area is classified as Agricultural or Forest/Semi-natural while the vast majority of Artificial Surface is mainly Urban Fabric with the exception of the airport. The road network was provided by Infocharta Ltd.3 for the year 2004 while an estimation of the road network for 1990 was produced based on a satellite image of the area for 1990. Road network data were classified in primary and secondary and layers of distance and density were derived. What is more, a 90m resolution DEM of the area was acquired from the SRTM webpage4.
Fig. 4. Mesogia are in east part of Athens - the wider and specific area under study
2http://www.g-i.gr/
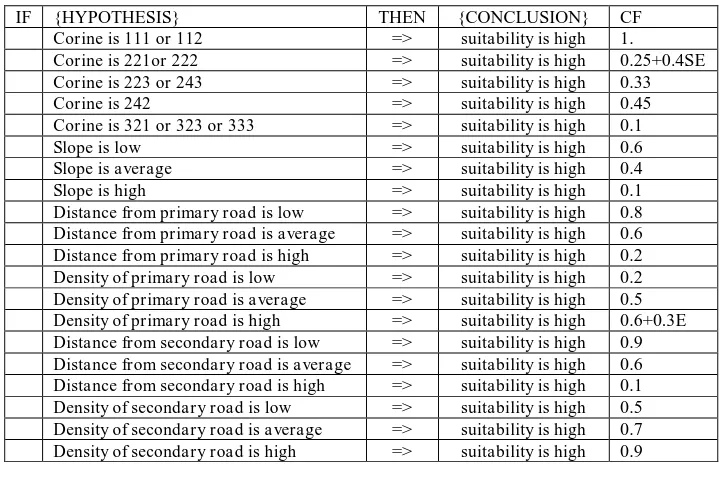
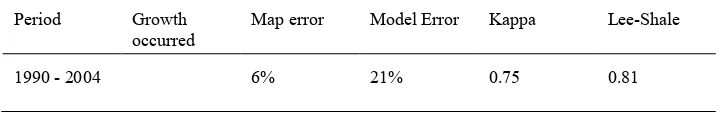
Fig. 5. The singleton representation of land use classes‟ suitability for urbanization (left) and the membership functions of the fuzzy sets (low, average and high) for the slope variable (right)
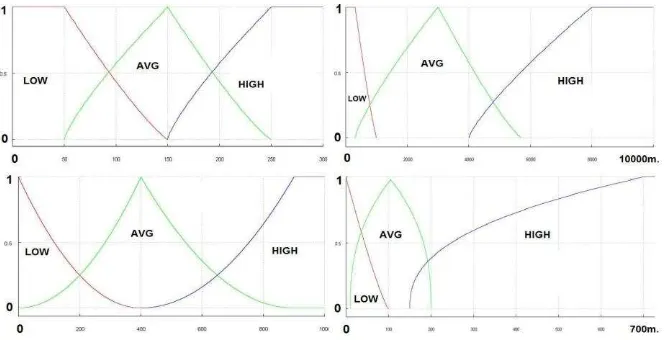
Fig. 6. The membership functions of the fuzzy sets (low, average and high) for primary road density (top left), primary road distance (top right), secondary road density (bottom left) and secondary road distance (bottom right)
For the application of the model, land cover data were represented as singletons (figure 5a) while for the quantitative variables of slope (figure 5b) and distance/density of primary and secondary road network (figure 6) three fuzzy sets (low, average and high) were empirically defined. In the thematic suitability systems, each singleton and each fuzzy forms a separate high suitability rule whose certainty factor equals the fitting degree of each singleton/set with the urban cover fuzzy set. This procedure took place for data referring to 1990 and produced the rules initial rules for suitability calculation.
urban growth simulator (table 2) which in some cases were determined to vary in space.
Table 1: Rules for high thematic suitabilty
IF {HYPOTHESIS} THEN {CONCLUSION} CF
Corine is 111 or 112 => suitability is high 1.
Corine is 221or 222 => suitability is high 0.25+0.4SE Corine is 223 or 243 => suitability is high 0.33 Distance from primary road is low => suitability is high 0.8 Distance from primary road is average => suitability is high 0.6 Distance from primary road is high => suitability is high 0.2 Density of primary road is low => suitability is high 0.2 Density of primary road is average => suitability is high 0.5 Density of primary road is high => suitability is high 0.6+0.3E Distance from secondary road is low => suitability is high 0.9 Distance from secondary road is average => suitability is high 0.6 Distance from secondary road is high => suitability is high 0.1 Density of secondary road is low => suitability is high 0.5 Density of secondary road is average => suitability is high 0.7 Density of secondary road is high => suitability is high 0.9
Table 2: Rules applied in the growth simulator
LEVEL 1 – edge expansion
South-east areas while the suitability of „high primary road density‟ was increased for the whole east area. Additionally, while the growth simulator uses Moore neighborhoods of radius 1 at all levels for the general case, level 1 and level 3 used Moore neighborhoods of radius 2 for the South-east and the North-west areas correspondingly. Figure 7 shows the final thematic and overall suitability indexes.
The final rules were applied upon the 1990 data in order to estimate the 2004 urban cover (figure 8) while to evaluate the results four indicators were calculated (table 3): the map error which the percentage of the misallocated cells to the whole
area
the model error which is the percentage of the misallocated cells to the total number of cells allocated by the model
the Kappa index of agreement calculated for the whole area the Lee-Shale index of agreement calculated for the whole area.
The error indexes suggest that the model can provide useful estimations of future urban growth. Nevertheless, a more thorough view of the error indexes and specifically their evolution over the iterations of the algorithm suggests that the optimum – in terms of error indexes – is reached a few steps before the algorithm exits and hence error is slightly increased during the last few steps. This is partially due to the exit criterion which introduces dependencies between the two types of possible error - either a rural cell is considered urban or vice versa. That means that, more or less, for each mistakenly considered urban cell there is another cell, mistakenly considered rural and after some steps more cells are allocated inaccurately rather than accurately.
On top of the numerical indexes, the results of the models appear to visually fit in an excellent way upon actual urban cover. Yet, to some extent, this is due to the low spatial resolution of the Corine database which cannot capture the detailed urban cover but rather provides a homogenous shape with high autocorrelation which is easier to simulate. Even so, a significant part of the error cannot be avoided for two reasons. First, the case study uses only a very small amount of data that cannot diversify easily which cells present higher suitability than others. Second, statistical analysis of the growth occurred during a period can elucidate the average way in which people make their residential choice but cannot describe relatively rare processes that are responsible for a significant part of the growth i.e. constructing the airport or a sport facility.
Table 3: Error indexes for cases studied
Period Growth occurred
Map error Model Error Kappa Lee-Shale
Fig. 7. Thematic suitability indexes based on land use (top left), slope (middle left) and road network (bottom left) are merged into overall suitability for urbanization (right)
9 Conclusions and Future Work
We developed and presented an urban growth model that applies a parallel connection between input variables and can easily be transferred to both data rich and data poor cases. The model was calibrated and applied in Mesogia area in east Attica (Athens) and is capable of providing satisfactory estimations of the future urban growth patterns at least in the short-term. The fitting indicators suggest that the model simulates efficiently the qualitative patterns of the urban expansion in the study area which is further certified by visual comparison.
This is partially due to the CA techniques incorporated, that are proved very efficient in simulating the spread of existing urban cover. What they lack, and this is because of the CA nature, is the ability to capture the urbanization of detached areas. Nevertheless, in our case study, the low spatial resolution of the used data and the homogenous spatial patterns of urban cover in the area conceal this inability. For this reason, the spontaneous growth mechanism (level 3) does not improve significantly the accuracy of the model.
Fuzzy logic is an advisable way to deal with vague data and stochastic relations since it enhances the potential qualitative resolution of the model and provides the proper tools for uncertainty management. It allows the process of information in both a qualitative and a quantitative way and expresses the dynamic of the phenomenon in common linguistic terms. The rules syntax is kept simple and hence comprehensible; as a result the user can easily calibrate the model empirically and introduce changes such as spatial variability or fuzzy hedges to improve the performance of the model. What is more, theory driven rules can be added and applied along with the rules that are extracted by data analysis.
Acquiring a rich data set to experiment on temporal rules is one possible direction towards which future work could be directed. More challenging though is to test this model in data of higher spatial resolution that are less auto-correlated and present more complex patterns of growth. Finally it would be very interesting to investigate the potentials of the modeling framework to study population and employment change along with urban growth.
Acknowledgements. The research leading to these results has received funding from the European Community's Seventh Framework Programme FP7/2007-2013 under grant agreement n° 212034
References
Arijit, L., Nikhil, R. P., & Jyotirmoy, D. (2006). Land Cover Classification Using Fuzzy Rules and Aggregation of Contextual Information Through Evidence Theory. IEEE transactions on geoscience and remote sensing. 44(6), 1633-1641.
Bejaoui, L., Bιdard, Y., Pinet, F., Salehi, M., & Schneiderd, M. (2007). Logical consistency for vague spatiotemporal objects and relations. The International Archives of the Photogrammetry, Remote Sensing and Spatial Information Sciences, Enschede, NLD.
Benenson, I., & Kharbash, V. (2006). Geographic Automata Systems and the OBEUS Software for their Implementation. In Portugali, J. (ed.). Complex Artificial Environments: Simulation, Cognition and VR in the Study and Planning of Cities Springer (pp. 137-153). Berlin, Germany.
Bishop, Y. M. M., Fienberg, S.E., & Holland, P.W. (1975). Agreement as a special case of association. Discrete Multivariate analysis. Cambridge MA, MIT press, 393 – 400.
Blecic, Ι., Cecchini, A., Prastacos, P., Trunfio, G.A., & Verigos, E. (2004). Modelling Urban Dynamics with Cellular Automata: A Model of the City of Heraclion. Paper presented at the 7th AGILE Conference on Geographic Information Science, University of Crete Press, Heraklion, Greece.
Bone, C., Dragicevic, S., & Roberts, A. (2006). A fuzzy-constrained cellular automata model of forest insect infestation. Ecological Modelling. 192(1-2), 107-125.
Cecchini, A., & Rizzi, P. (2001). Is Urban Gaming Simulation Useful?, Simulation Gaming. 32(4), 507-521.
Chen, M. Y., & Linkens, D. A. (2004). Rule-base self-generation and simplification for data-driven fuzzy models. Fuzzy Sets and Systems. 142, 243-265.
Cheng, J., & Masser, I. (2003). Understanding Urban Growth System: Theories and Methods. Paper presented at the 8th International Conference on Computers in Urban Planning and Urban Management, Sendai City, Japan.
Clarke, K. C., Hoppen, S., & Gaydos, L. (1997). A Self-Modifying Cellular Automaton Model of Historical Urbanization in the San Francisco Bay Area. Environment and Planning B: Planning and Design. 24, 247-261.
Colona, A., Di Stefano, V., Lombardo, S., & Papini, L. (1998). L.A.U.D.E.: Learning Automata For Urban Development Exploration. The Case Study Of Rome Urban System. Paper presented at the 38th ERSA Congress, Vienna.
Dietzel, Ch., & Clarke, K. C. (2004). Replication of Spatio-Temporal Land Use Patterns at three Levels of Aggregation by an Urban Cellular Automata. Lecture Notes in Computer Science, 3305, 523-532.
Dietzel, Ch., Oguz, H., Hemphill, J. J., Clarke, K. C., & Gazulis, N. (2005). Diffusion and Coalescence of the Houston Metropolitan Area: Evidence Supporting a New Urban Theory. Environment and Planning B: Planning and Design. , 32, 231-246.
Dragicevic, S. (2004). Coupling Fuzzy Sets Theory and GIS-based Cellular Automata for Land-Use Change Modeling. Paper presented at Fuzzy Information, IEEE Annual Meeting of the Processing NAFIPS'04, Banff, Canada, 1, 203-207.
Dragicevic, S. (2005). Fuzzy Modeling with Spatial Information for Geographic Problems: Multi-Dimensional Interpolations with Fuzzy Sets. In Petry, F. E., Robinson, V. B., & Cobb M., A. (Eds), Fuzzy Modeling with Spatial Information for Geographic Problems.(pp. 143-158). Springer-Verlag Berlin Heidelberg.
Dragicevic, S., & Marceau, D. J. (2000). An application of fuzzy logic reasoning for GIS temporal modeling of dynamic processes. Fuzzy Sets and Systems. 113, 69-80.
Dragicevic, S., & Marceau, D. J. (2001). A fuzzy set approach for modeling time in GIS.
Fisher, P., Wood, J., & Cheng T. (2004). Where is Helvellyn? Fuzziness of multi-scale landscape morphometry. Transactions of the Institute of British Geographers, 29(1), 106-128. Fonte, C. C., & Lodwick, W. A. (2005). Fuzzy Modeling with Spatial Information for Geographic Problems: Modelling the Fuzzy Spatial Extent of Geographical Entities. In Petry, F. E., Robinson, V. B., & Cobb M., A. (Eds), Fuzzy Modeling with Spatial Information for Geographic Problems.(pp. 121-142). Springer-Verlag Berlin Heidelberg.
Guesgen, H. W. (2005). Fuzzy Reasoning about Geographiv Regions. In Petry, F. E., Robinson, V. B., & Cobb M., A. (Eds), Fuzzy Modeling with Spatial Information for Geographic Problems.(pp. 1-14). Springer-Verlag Berlin Heidelberg.
Hatzichristos, Th., & Potamias, J. (2004) Defuzzification operators for geographic data of nominal scale. Paper presented at the Geoinformatics Conference - Gavle, Sweeden.
Heikkila, E. J., Shen, T.Y., & Yang, K. Z. (2002). Fuzzy Urban Sets Theory and Application to Desakota Regions in China. Environment & Planning B: Planning and Design. 29, 239-254. Henning, H. (2003). A fuzzy logic approach to urban land-use mapping. Paper presented at the 9th Scandinavian Research Conference on Geographical Information Science, Espoo, Finland Helsinki University of Technology 2003, p.41-56.
Jasper, V. (2009). Assessing the Accuracy of Changes in Spatial Explicit Land Use Change Models. Paper presented at the 12th AGILE International Conference on Geographic Information Science 2009, Hannover, Germany.
Joss, B. N., Hall, R. G., Sidders, D. M., & Keddy, T. J. (2008). Fuzzy-logic modeling of land suitability for hybrid poplar across the Prairie Provinces of Canada. Environmental Monitoring and Assessment. 141(1-3), 79-96.
Kalogirou, S. (2002). Expert systems and GIS: an application of land suitability evaluation. Computers, Environment and Urban Systems. 26, 89–112.
Kirschfink, H., & Lieven, K. (1999). Basic Tools for Fuzzy Modeling.Tutorial on Intelligent Traffic Management Models in Helsinki.
Kollias, V. J., Kalivas, D. P., & Yassoglou, N. J. (1999). Mapping the soil resources of a recent alluvial plain in Greece using fuzzy sets in a GIS environment. European Journal of Soil Sciense, 50, 261-273.
Kratochwil, S., & Benedikt, J. (2005). Fuzzy Modeling with Spatial Information for Geographic Problems: Talking Space – A Social & Fuzzy Logical GIS Perspective On Modelling Spatial Dynamics. In Petry, F. E., Robinson, V. B., & Cobb M., A. (Eds), Fuzzy Modeling with Spatial Information for Geographic Problems.(pp. 159-284). Springer-Verlag Berlin Heidelberg.
Krawczyk, R. J. (2003). Architectural Interpretation of Cellular Automata, Poster presented at NKS 2003, Boston.
Liu, Y. (2009). Modeling Urban Development with Geographical Information Systems and Cellular Automata. CRC PressTaylor & Francis Group.
Liu, Z., & George, R. (2005). Fuzzy Modeling with Spatial Information for Geographic Problems: Mining Weather Data Using Fuzzy Cluster Analysis. In Petry, F. E., Robinson, V. B., & Cobb M., A. (Eds), Fuzzy Modeling with Spatial Information for Geographic Problems.(pp. 105-120). Springer-Verlag Berlin Heidelberg.
Liu, Y., & Phinn, S.R. (2001). Developing a Cellular Automaton Model of Urban Growth Incorporating Fuzzy Set Approaches. Paper presented at the 6th International Conference on GeoComputation, University of Queensland, Brisbane, Australia.
Liu, Y., & Phinn, S. R. (2003). Modeling Urban Development With Cellular Automata Incorporating Fuzzy-Set Approaches. Computers, Environment and Urban Systems. 27, 637-658.
Liu, Y., Phinn, S. R. (2005). Modeling the driving forces of Sydney‟s urban development (1971-1996) in a cellular environment. Applied GIS. 1(3), 27.1-27.18.
Mantelas, L., Hatzichristos, Th., & Prastacos, P. (2007). A Fuzzy Cellular Automata Based Shell for Modeling Urban Growth – A Pilot Application in Mesogia Area. Paper presented at the 10th AGILE International Conference on Geographic Information Science, Aalborg University, Denmark.
Mantelas, L., Hatzichristos, Th., & Prastacos P. (2008). Modeling Urban Growth using Fuzzy Cellular Automata. Paper presented at the 11th AGILE International Conference on Geographic Information Science, Girona, Spain.
Marshall, A. (2007). The state of world population 2007 - Unleashing the Potential of Urban Growth. UNFPA – 2007.
Matsakis, P., & Nikitenko, D. (2005). Fuzzy Modeling with Spatial Information for Geographic Problems: Combined Extraction of Directional and Topological Relationship Information from 2D Concave Objects. In Petry, F. E., Robinson, V. B., & Cobb M., A. (Eds), Fuzzy Modeling with Spatial Information for Geographic Problems.(pp. 15-40). Springer-Verlag Berlin Heidelberg.
Miranda, V, & Monteiro, C. (1999). Fuzzy Inference Applied to Spatial Load Forecasting. Paper presented at the Power Tech ‟λλ Conference, Budapest, Hungary.
Mraz, M., & Zimic, N. (1999). Intelligent bush fire spread prediction using fuzzy cellular automata. Journal of Intelligent and Fuzzy Systems. 7, 203-207.
Mulianat, I., Hariadi, Y. (2004). Urban Area Development in Stochastic Cellular Automata. Paper presented at Urban/Regional, EconWPA.
Nedeljkovic, I. (2006). Image classification based on fuzzy logic. The International Archives of the Photogrammetry, Remote Sensing and Spatial Information Sciences. Commission VI, 34,1−6, Part XXX.
Ness, G. D., & Low, M. M. (2000). Five Cities: Modeling Asian Urban Population-Environment Dynamics. Oxford University Press, 43-67.
Setnes, M., Babuska, R., & Verbruggen, H. B. (1998). Transparent Fuzzy Modeling. Human & Computer Studies, 49, 159-179.
Stefanakis, E., Vazirgiannis, M., & Sellis, T. (1996). Spatial Decision Making Based on Fuzzy Set Methodologies. Paper presented at the International Society for Photogrammetry and Remote Sensing, XVIII ISPRS Congress, Vienna.
Takemura, C. M., Cesar, R. Jr., & Bloch, I. (2005). Fuzzy Modeling and Evaluation of the
Spatial Relation “Along” in Progress in Pattern Recognition. Image Analysis and Applications, 3773, 837-848.
Vancheri, Α., Giordano, P., Andrey, D., & Albeverio, S. (2004). A Model for Urban Growth Processes with Continuum State Cellular Automata and related Differential Equations. http://ssrn.com/abstract=633969
Wu, F. (1996). A Linguistic Cellular Automata Simulation Approach for Sustainable Land Development in a Fast Growing Region. Computer, Environment and Urban Systems. 20(6), 367-387.
Wu, F. (1998). Simulating Urban Encroachment on Rural Land with Fuzzy-Logic-Controlled Cellular Automata in a Geographical Information System. Journal of Environmental Management. 53, 293-308.