Jejak Vol 10 (1) (2017): 12-29. DOI: http://dx.doi.org/10.15294/jejak.v10i1.9124
JEJAK
Journal of Economics and Policy
http://journal.unnes.ac.id/nju/index.php/jejak
Technical Efficiency of Wet Season Melon Farming
Ananti Yekti1, Dwidjono Hadi Darwanto2, Jamhari3, Slamet Hartono4
1Jurusan Penyuluhan Pertanian, Sekolah Tinggi Penyuluhan Pertanian Magelang 2,3,4Fakultas Pertanian, Universitas Gadjah Mada
Permalink/DOI: http://dx.doi.org/10.15294/jejak.v10i1.9124
Received: June 2016; Accepted: September 2016; Published: March 2017
Abstract
Melon is one of high-value horticulture commodity which is cultivated widely in Kulon Progo regency. The nature of agricultural products is heavily dependent on the season, so it causes the prices of agricultural products always fluctuated every time. In wet season the price of agricultural products tends to be more expensive. Melon cultivation in wet season provide an opportunity to earn higher profits than in the dry season. The price of agricultural products tends to be more expensive in wet season, thus melon cultivation in wet season prospectively generate high profits. In order to achieve high profitability, melon farming has to be done efficiently. Objective of this study was to 1) determined the factors that influence melon production in wet season 2) measured technical efficiency of melon
farming and 3) identified the factors that influanced technical efficiency. Data collected during April – June 2014. Location determined
by multistage cluster sampling. 45 samples of farmers who cultivated melon during wet season obtained based on quota sampling technique. Technical efficiency was measured using Cobb-Douglas Stochastic Frontier. The result reveals that 1) land use, quantity of seed, K fertilizer contributed significantly increasing melon production, while N fertilizer decreased melon production significantly 2)
technical efficiency indeces ranged from 0.40 to 0.99, with a mean of 0.77; 3) farmer’s experience gave significant influence to technical efficiency of melon farming in wet season.
Key words : Melon, Stochastic Frontier, Technical Efficiency, Wet Season, Kulon Progo.
How to Cite: Yekti, A., Darwanto, D., Jamhari, J., & Hartono, S. (2017). Technical Efficiency of Wet Season Melon Farming. JEJAK: Jurnal Ekonomi Dan Kebijakan, 10(1), 12-29. doi:http://dx.doi.org/10.15294/jejak.v10i1.9124
© 2017 Semarang State University. All rights reserved
Corresponding author :
Address: Jalan Kusumanegara No.2. Yogyakarta E-mail: [email protected]
INTRODUCTION
Agricultural sector has contributed to reduce poverty, both directly or indirectly. Direct contribution is through increasing farmers' income, while indirect contribution is through the mechanism of the link forward or backward in the formation of output, value added, employment opportunities, forming foreign exchange, and providing need food consumption as well as a supplier of raw materials for the development of economic sectors, particularly the processing industry. Agricultural sector provides employment to absorb excees labor better than other sectors. The main actor in agriculture is farmers and farm labors who most of them living in rural areas and lower welfare than others communities. Therefore, even relative contribution of agriculture in formation of Gross Domestic Product (GDP) is still low but the role of this sector is strategic, both in the achievement of the Millennium Development Goals (MDGs) as well as the sequel agenda, Sustainable Development Goals (SDGs) (Sumaryanto, 2014).
Horticulture has the largest contribution among agricultural subsectors. Horticulture include fruits, vegetables, ornamental plants, and medicinal plants. Fruits has had the most substantial contribution then others. GDP value of horticulture in 2011 reached Rp88851.00 billion and the contribution of fruit products were Rp 46735.62 billion or about 52.60 percent of the total GDP horticulture (Directorate General of Horticulture, 2014). It describes the contribution of fruits to GDP is the highest, so it is important to be developed further.
Some empirical studies have showed that the role of agriculture in poverty reduction was huge and included not only the quantitative aspects because the nature of
agricultural multifunctionality involved qualitative dimensions that some of them intangible (Sumaryanto, 2014). In line with the agenda of Sustainable Development Goals of poverty reduction, can be achieved by improving the farm production efficiency. Producing efficiently will reduce the gap between actual production with potential production which is expected to improve income and welfare of farmers. Many research has been done to improve agricultural production through enhancement farming efficiency, based on the resources and technology available. But most of studies focused on food and crops commodities. Studies on horticulture farming efficiency are still limited. Bravo-Ureta et al., (2007) using published data between 1979 to 2005 found 167 studies related to efficiency. The most commodities widely analyzed were rice, a dairy farm, then whole farm. Studies in horticulture were still limited, only about 2 percent of the overall studies.
One of horticultural commodities that have the potential to be developed are melon, because it is widely consumed and has a high economic value (Asmara & Sulistyaningrum, 2008). Thus melon farming can be an alternative to increase farmers' income. It is one of alternative that can be done with the limited resources available. Therefore, efficient of
resources’ use will be an important
benchmarking in measuring the performance of farming.
Yogyakarta is one of the melon-producing provinces in Indonesia, with the main production area in Kulon Pogo regency. Based on
topography, Kulon Progo’s region categorized
meters above sea level, covering districts Nanggulan, Sentolo, Compassionate, and parts of Lendah 3) the south is lowland with an altitude of up to 100 meters above sea level including districts Temon, Wates, Panjatan, strain, and parts of Lendah. Development strategies of Kulon Progo Regency mapped out central zone and southern zone intent for aquaculture, while the northern zone for conservation purposes (Martono, 2007). Melon has cultivatied for many years by few farmers in Kulon Progo regency, but has spread widely in last decade. Central melon production in Kulon Progo scattered in five districts, namely: Lendah, Galur, Temon, Panjatan and Wates. Melon farming condition for last 5 years is presented in Table 1.
Tabel 1. Harvested Area, Yield and Productivity of Melon Farming in Kulon
Progo Regency, 2008-2012
Year Harvested Area (Ha)
Yield (ku)
Producti vity (ku/Ha)
2008 529 100.622 207,22
2009 567 112.290 198,04
2010 530 106.792 201,49
2011 985 199.432 202,47
2012 1.253 255.021 203,53
Source: Dinas Pertanian & Kelautan Kabupaten Kulon Progo (processed).
Based on Table 1, melon’ harvested area
in Kulon Progo was increasing every year. This indicates that melon cultivation has high appeal for farmers, mainly because of the potential melon farm’ income is higher than other commodities. Farmers in Kulon Progo cultivated watermelon firstly before swicth to melon commodity. Its result was in line with previous study by Martono (2007), that melon farming more viable financially than
watermelons. Nevertheless, development of production and productivity were fluctuated relatively. In 2012, melon productivity was still below the peak achieved within five years, which was in 2008.
Adenuga et al., 2013; Abiola and Daniel, 2014; Amoah, 2014). They have come to the conclusion that some of structural characteristics and certain managerial characteristics influenced positively or negatively on technical efficiency of farming.
Prices of agricultural products always fluctuated any time, due to changed in number of yield and marketing related to the seasonal nature of agricultural commodities. Majority of horticultural commodities are cultivated during dry season therefore price of agricultural commodities has tended to be more expensive in wet season than dry season due to the availability of fewer production. Empirical evidence was shown by Pranata and Umam (2015), that amount of onion production fluctuated by season and yield at harvest time depended on climate. Thus the season is one of the important factors for horticultural farmers to determine planting season in the pursuit of maximum benefit. Setiadi and Sarimin (2006) explained that the melon could be cultivated in dry and wet season. Eventhough melon cultivation in wet season required outpouring of concern higher and more intensive caredry season. Opportunities to succeed cultivation in dry season is higher than wet season, because its agro-climatic conditions accordance with terms of plant growth. This condition is also provedby the empirical fact that cultivation in dry season is more prevalent than wet season. Seasonal nature of agricultural product provides an opportunity for farmers to achieve higher profits by performing off-season cultivation. In the early years of melon cultivation, farmers have growth only in dry season. But through more experienced and improvement technologies, has encouraged farmers to tried cultivation in wet season. The higher selling price of melons in wet season has been seen as an opportunity to achieved
higher profits and motivated them to cultivated in wet season, although they have known that it had higher potential of failure because melon cultivation more appropriate technically agronomic in dry season. A part of it, profit is not only determined by the high selling price. Optimal production is needed to obtain maximum profit. The profit is determined by
amount of farm’ income and production costs, where farm’ income is the product of the sale
price and a number of yield. In order to achieve optimal production, farmers should be run their business efficiently. By knowing the technical efficiency index could be assessed whether farmers have used its resources optimally to achieved the purpose of farming (Guestami et al., 2012).
Technology was one of the decisive factors in the production process (Nicholson, 1998). Application of new technology will lead to improvements in the use of one or more inputs in the production process, so it can bring possiblity to achieve farm efficiency. Problem is not only about the use of factors production, but managerial skills possessed by farmers also can lead to an inefficient farming. Thus enhancement of technical efficiency does not only involve technological improvements and resource allocation, but also involves enhanced
ability and capability farmers’ managerial.
(2006), stated one of the factors causing the decline in productivity was technical
inefficiency. Thus melon’ farmers need to
encourage for fully utilizing available resources and technology to maximize yield. So this study has been designed to: 1) identify the factors that affect melon production in wet season 2) determine technical efficiency of melon cultivation in wet season and 3) identify factors responsiable for various level of melon farming technical efficiency in wet season.
Measurement of Technical Efficiency Efficiency was an important indicator to measuring the overall performance of business unit activities (Sutanto, 2015), and important to knew as a first step towards saving resources and the allocation of resources appropriately (Rahman et al., 2012). The concept of efficiency refers to the writings of Farrell (1957) in Coelli et al., (2005) suggested that efficiency was composed of two components, namely technical efficiency and allocative efficiency. Technical efficiency was associated with the ability of a company to get the maximum output from the use of a set (bundle) input, while allocative efficiency reflected farm ability to use input to optimal portion at a certain level and price. In other word allocative efficiency was the ability to generated a number of output under conditions minimizing input cost ratio. Technical efficiency gave an idea of how far a deviation of business unit operated from frontier production function at a particular technology. If the production closed to the maximum potential of a production process on the available technology (the best practice) in the same environmental conditions, it can be said that farmers had manage their farming efficiently. Khan and Ali, (2013) mentioned technical inefficiency reflected the deviation
from the position frontier of isoquant line, while allocative inefficiency associated with deviation from the minimum ratio of input costs. Efforts to enhanced efficiency is generally associated with a smaller cost production to obtain a certain result, or with certain cost earned more results. All the things that made it possible to reduced these costs was done for efficiency (Susanto & Imaningati, 2014).
Measurement of efficiency can be done in two methods, parametric methods and non-parametric methods. Parametric methods are divided into stochastic and deterministic approach. These approach are widely used in various studies and literature to measure the technical efficiency. Parametric method that most frequently used is stochastic frontier analysis (SFA) while non-parametric methods using Emvelopment Data Analysis (DEA). The nature of the agricultural production process, particularly crops are highly affected by the disruption that can be controlled (structural factors and managerial) and distruption that can not be controlled by the farmer (pest-deases attack, climate, fluctuations in input prices, fluctuations in output prices). It makes stochastic frontier approach more appropriateto be applied in this study.
Stochastic Frontier Approach
beyond the farmer’ control (such as climate, pest attack). Stochastic frontier approach entered factors related to random error measurement in which the output of a farm was a function of random noise (disturbance term), measurement error and exogenous shocks that were beyond out of farmers’ control. The output was assumed to be limited by a stochastic production function that was known as stochastic frontier production (SFP). Because it required a certain production functions in the analysis, therefore it could be used to test the hypothesis directly (Dijk & Szirmai, 2006). The production function that widely used to measuring technical efficiency in agriculture research was Cobb-Douglas production function and Translog.
Coelli et al., (2005) described the frontier production function as a production function of the maximum output that could be achieved on any use of certain inputs. In other word, frontier production function is a function that indicates the possibility of maximum production in which the production process is highly technical efficient and there is no attempt to produce a higher output without using more inputs. Frontier production function model gave possibility to estimated relative efficiency of a particular farm by relationship between actual production and potential production (Green, 1993). General form of stochastic frontier production function, purposed by Aigner et al., (1977) and Meeusen and van Broeck (1977) was:
ln qi = xi′β + vi - ui (1)
Following Cobb-Douglas production function, the stochastic frontier function can be written in the form:
Ln qi= βo+ β1 lnxi + vi– ui (2) qi= exp(βo+ β1 lnxi + vi– ui)
Where qi is the i-th output; xi reflects the k x 1 vector of (transformations) input to the i-th in a production-process; β is a vector of parameters to be estimated; vi is a random error is assumed to be identically independenly
distributed as N (0, σv2) which captures the effect
of stochastic out of farmers and ui is a non-negative random variable which is assumed to be caused by technical inefficiency in production
and distributed as iid ~ N+(0,σu2), ui component
is assumed the one hand, it is a non-negative random variables, describing the achievement shortage of farm output i-th production frontiernya (Guestami et al., 2012). Thus u = 0 for output which lies on its line frontier, and u < 0 for output under the frontier line (Amaza et al., 2006). The model in equation (2) is called stochastic frontier production function for the output values are limited by stochastic variable (random), namely exp (Xiβ + vi). Random error, vi, can be positive or negative. Thus the stochastic frontier output varies around the deterministic part of the model frontier, namely
exp (Xiβ). ui component affirms that farmers are
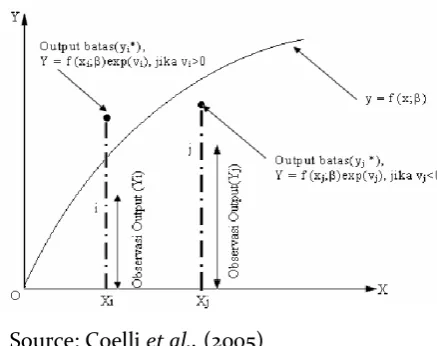
always under its frontier and it strongly associated with the characteristics of farmers. Stochastic frontier model is illustrated in the form of two-dimensional as shown in Figure 1.
Figure 1 illustrates that the input X on the horizontal axis and the output Y on the vertical axis. The results of the production function in the form of a deterministic approach frontier models, exp (Xiβ), assumed at the diminishing return scale. The results of observation output and input from two farm, i and j have been determined.
farming using Xj input and produce output Yj. Frontier output YJ* = exp (Xjβ + vj) was under production function deterministic. It was occured because production process was affected by unfavorable circumstances which vj variable was negative. Note that the outputs stochastic frontier Yi* and Yj* was not observable due to random error vi and vj could not be observed. But the deterministic part of stochastic frontier model had to lie between stochastic frontier output. In both cases, the production was under deterministic production function Y = exp (Xiβ). This specification allows non-negative random component in the error term to produced a measure of technical inefficiency, or the actual ratio for maximum output expected at certain inputs and existing technologies (Kompas, 2001).
Source: Coelli et al., (2005)
Figure 1. Stochastic Frontier Production Function
Stochastic frontier production function was being introduced by Aigner et al., (1977) pointed out that the ui were the components of the specific error term (ɛi) which ɛi = vi - ui. Farm technical efficiency that used in this study refers to Coelli et al., (2005) as follows:
TE = exp(𝑥𝑞𝑖 𝑖
′𝛽+𝑣𝑖) (3)
= exp(𝑥𝑖′𝛽+𝑣𝑖−𝑢𝑖) exp(𝑥𝑖′𝛽+𝑣𝑖) = exp(-ui)
Maximum likelihood estimation method on stochastic frontier production function
produces β, λand σ2parameters where σ2 = σ
u
2 +
σv2 and λ= σu/σv. Jondrow et al. (1982) showed technical efficiency of each farm unit could be calculated from the expected value of ui on condition ɛi as follows:
E(ui | ɛj) = 𝜎𝑢𝜎𝜎𝑣[
𝑓∗(𝜀𝑗𝜆𝜎)
1−𝐹∗(𝜀𝑗𝜆𝜎)−
𝜀𝑗𝜆
𝜎] (4)
Where f (•) is the standard normal density function while F (•) is the standard normal
distribution function. Therefore N(μi,σ2) is
non-negative, the magnitude of the technical efficiency index is between 0 -1 or 0 ≤ 1 ≤ ET.
Battase and Coelli (1992) and Coelli et al. (2005) suggested that in order to examined determinants of technical efficiency and at the same time technical efficiency could be done by two methods. First method used a two-stage procedure, the first stage was estimating efficiency using frontier production function, second stage was estimated using a regression model where efficiency was defined as a function of socio-economic variables. The second method was a one step or simultaneous procedure, where the effects of the inefficiency in the stochastic frontier production function was modeled using relevant variables to explained technical inefficiency.
Some researchers (Coelli, 1995; Battese and Coelli, 1996; Amaza et al., 2006; Bozoğlu and
Battese and Coelli (1995), technical inefficiency effect model was measured by equation:
ui = δ0 + δ1Z1 + δ2Z2 + ... + δiZi + ɛi (5) which:
ui = Technical inefficiency
δ = parameters
Z = Management variable which supposed effecting technical inefficiency
Coelli et al., (2005) stated that estimation of stochastic frontier production function using Maximum Likelihood Estimation (MLE) was more efficient than using Corrected Ordinary Least Squared (COLS) methods. Empirical studies showed that level of significance MLE better than COLS when contributions from technical inefficiency effect to total variants were large.
β, and δ was the coefficient of the parameters
in the equation (1) and (3) estimated simultaneously using MLE, along with the variance parameters (Coelli & Battese, 1996; Amaza et al., 2006) as:
σ2 = σv2 + σu2 dan γ = σu2
σ2 (6)
Where σ2 is the total variance of error
term. Parameter γ describe contribution of
technical efficiency to total residual (ε), with
value between 0 -1. If the value of the
parameter γ close to zero indicates that the
deviation from the frontier tends to the
residual effects (error), whereas if the γ value
close to one indicates that the deviation leads to technical inefficiency effects.
RESEARCH METHODS
Research location had been determined using multistage cluster sampling technique. Districts Lendah was chosen under consideration of its territory simultaneously represented a zone of central and south
district of Kulon Progo regency. Gulurejo was selected as a village production centers melon.
Melon’ farmers selected using quota sampling
technique, i.e. 45 farmers who had cultivated melons during wet season. Primary data were collected during April-June 2014, through interview techniques guided by a questionnaire that has been prepared. Data were gathered on various information on demographics, farm inputs and outputs as well as price.
Measurement of technical efficiency in this study refers to the technical inefficiency effects model developed by Coelli (1995), Battese and Coelli (1995) and Coelli et al., (2005). This model has been widely applied in various fields. Measurement of technical efficiency using a model of Cobb-Douglas stochastic frontier by incorporating effect inefficiency simultaneously on agriculture has applied some researchers (Abedullah et al., 2006; Bozoglu and Ceyhan, 2007; Nahraeni et al., 2012; Khan and Ali, 2013; Rizkiyah et al., 2014; Navky et al., 2014). Cobb-Douglas stochastic frontier used in this study is a function of melon production per farm, modeled:
ln Y = β0+ β1 lnX1+ β2 lnX2+ β3 lnX3+ β4 lnX4+ β5 lnX5 + β6 lnX6+ β7 lnX7 + β8 lnX8 + (vi-ui) (7)
Keterangan:
Yi = Yield (kg) X1 = Land area (m2) X2 = Seed (gr)
X3 = Nitrogen fertilizer (kg) X4 = Phosfor fertilizer (kg) X5 = Kalium fertilizer (kg) X6 = Organik fertilizer (kg) X7 = Pesticide (kg)
X8 = Labor (Man day)
To determine influence of managerial and structural characteristics ontechnical inefficiency, single-stage procedure is used, with the following equation:
Which:
ui = Technical inefficiency Z1 = Age (years)
Z2 = Formal education (years) Z3 = Farm experience (years) D4 = dummy acces to credit
(1=acces; 0=no)
Cobb-Douglas stochastic frontier and technical inefficiency effects model estimated simultaneously using Frontier 4.1c software package written by Coelli (1996). Technical inefficiency effects model can only be estimated if technical inefficiency effects is stochastic and has a particular distribution, so it required the test about presence of technical inefficiency. According Coelli et al., (2005), one-sided generalized likelihood ratio (LR) test was the appropriate test for estimation using MLE method. LR test obtained from equation:
LR = -2 {ln [L (H0) - ln [H1)]} (9)
Where L (H0) and L (H1) is the value of likelihood function on the null hypothesis (Ho) and alternative hypothesis (H1).
The hypothesis is:
H0: γ = 0, there is no technical inefficiency
effects
H1: γ> 0, there is technical inefficiency effects
Because the value of γ is always positive,
then used LR one-sided test. LR test is
compared with the value χ2mix table (Table
Kodde and Palm, 1986).
RESULTS AND DISCUSSION
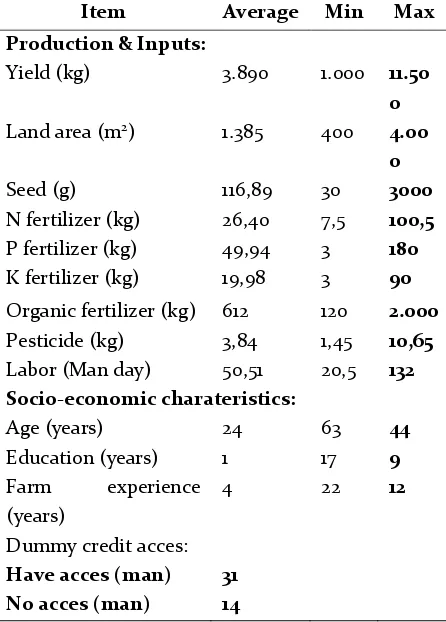
Farmer’ Chataretistics and Melon Farming Descriptive statistics of the variables used in testimation of stochastic frontier production function is presented in Table 2. It shows the average melon production per farm during wet season was 3.890kg with average
land area of 1.385m2. According melon’ farmers, dominant variety cultivated in wet season was Action, because it was more resistant to pest-deases attack and still produced good quality fruit on unfavourable environmental conditions. The amount of anorganic fertilizer is measured in terms of the macro nutrients nitrogen (N), Phosfor (P) and Kalium (K). They are sourced from a single fertilizer: ZA, SP-36, KCl, KNO3 and NPK compound fertilizers. Melon farmers used organic fertilizers sourced from manure and manufacturized organic fertilizer (petroganik). Petroganik dose recommendation is 2 tons / ha, much lower than non-manufacturer which is 20 tons / ha. Average of organic fertilizer was obtained from calculation of manufacturer and non-manufacturer organic fertilizers usage. Farmers used 3 to 7 types of trademarks pesticides. For sake of labor saving, farmers mixed more than one type of pesticides in sprayer tank. Pesticides were sprayed once every two days, but it could turn into every day if conditions of the plants or the environment was unfavourable. Main source of labor is family labor. Hire labors were needed at land preparation, installation of mulch, bamboo trellis (stake) and planting of seedlings. Nurseries and maintenance such: supplementary fertilization, pest and disease control, selection of flowers and fruit, binding plants on trellis, farmland sanitation were done by family labors. Farmers has sold melon before it was harvested, so transportation cost and harvesting cost were responsibility of buyer.
Average of farmers was 44 years old melon, catagorized in productive age, with a range of 24-63 years. Average formal education was found 9 years (graduated junior high school) with a range of education levels from did not finish elementary school to college graduation.
Table 2. Summary Statistics of Variables
Item Average Min Max
Production & Inputs:
Yield (kg) 3.890 1.000 11.50
0
Land area (m2) 1.385 400 4.00
0
Seed (g) 116,89 30 3000
N fertilizer (kg) 26,40 7,5 100,5
P fertilizer (kg) 49,94 3 180
K fertilizer (kg) 19,98 3 90
Organic fertilizer (kg) 612 120 2.000
Pesticide (kg) 3,84 1,45 10,65
Labor (Man day) 50,51 20,5 132 Socio-economic charateristics:
Age (years) 24 63 44
Education (years) 1 17 9
Farm experience (years)
4 22 12
Dummy credit acces:
Have acces (man) No acces (man)
31 14
Source: Data processed, 2015.
Average farm experience was 12 years. It was total farm melon experience as a whole, not specific experience melon cultivation in wet season only. Melon production cost is more expensive than crop commodities. It became logical if the majority of farmers have access to credit. Farmers in the study area had good access to financial institutions, particularly banks and pawnshops. Not found any access to the stalls of agricultural inputs and moneylenders.
Stochastic Frontier Production Function
Estimation of Cobb-Douglas stochastic frontier and the factors that contributed to technical inefficiency, carried out simultaneously. The results of the analysis are discussed and presented separately in Table 3 and Table 5.
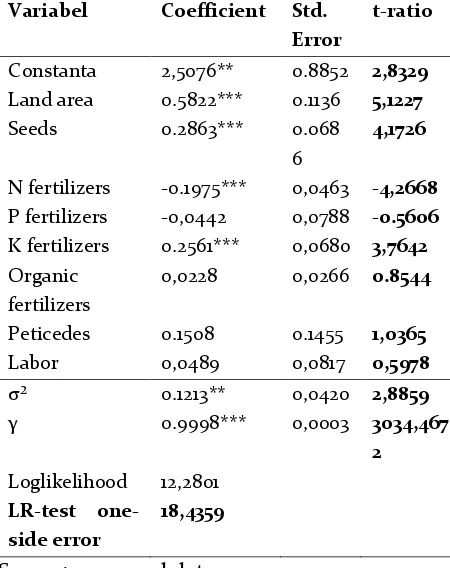
Based on Table 3, were found four independent variables significantly affected melon production in wet season: land area, seeds, N fertilizer and K fertilizer. Four other variables: P fertilizer, organic fertilizer, pesticides and labor did not significantly affect production of melon in wet season.
Maximum likelihood method provides a
variant parameter σ2 and γ. Sigma-squared (σ2) described distribution of the error term, which was 0.1213, significantly different at α = 5%. It means that production was really varied, so there was no evidence that all farming was already
100% efficient. Parameter gamma (γ) of 0.999
and significant at 99% confidence level, give meaning that 99.9% of output variation among farmers due to technical inefficiency effects and only remaining 0.1% are caused by external influences that could not be controlled by farmers. It revealed variations in the output of the production frontier could be considered as a result of the level of technical efficiency gain related to managerial problems in farm management.
LR test one-side error was 18.43, exceeded
and could represent actual conditions than estimated by OLS.
Table 3. Maximum Likelihood Estimation of Cobb-Douglas Stochastic Frontier
Variabel Coefficient Std. Error
t-ratio
Constanta 2,5076** 0.8852 2,8329
Land area 0.5822*** 0.1136 5,1227
Seeds 0.2863*** 0.068
6
4,1726
N fertilizers -0.1975*** 0,0463 -4,2668
P fertilizers -0,0442 0,0788 -0.5606
K fertilizers 0.2561*** 0,0680 3,7642
Organic fertilizers
0,0228 0,0266 0.8544
Peticedes 0.1508 0.1455 1,0365
Labor 0,0489 0,0817 0,5978
σ² 0.1213** 0,0420 2,8859
γ 0.9998*** 0,0003 3034,467
2
Loglikelihood 12,2801
LR-test one-side error
18,4359
Source: processed data, 2015
Note: ***,**,* indicate significant at 1%, 5% and 10% levels, respectively
This study used Cobb-Douglas production function, so regression coefficient also showed elasticity of input. Regression coefficient of land area was 0.5821, significant and positively impact on melon production during wet season. It meaned additional 1% land area would increase 0.58% production of melons. Melon production is highly dependent on plant populations, because only one fruit is maintenanced each plants. Addition of land area will increase number of populations, thus amount of fruit produced are multiplied, then output quantity gains heavier weight. Many studies have reported that land area significantly increased
production (Sukiyono, 2005; Saptana et al., 2010; Nwaru et al., 2011; Khan and Ali, 2013).
Coefficient of seed was 0.2863, had positive sign and significantly effected on level of convidence 99%. It implies additional amount of seed by 1% would increase production of melon 0.2863%. Many studies reported same conclusion to the findings of this study, that seeds contributed significantly increasing production (Banani et al., 2013; Amoah, 2014; Nahraeni et al., 2012; Darmansyah et al., 2013; Abiola and Daniel, 2014). Melon plantation always uses hybrid seeds, which has high response to fertilization and potential to gain a high production. Increasing the number of seeds implied the more fruits produced.
Coefficient of N fertilizer was -0.1975, mean has negative sign and significantly take effect on the production of melon during wet season. Increasing N fertilizer as much as 1% will reduce melon production in wet season to 0.1975%. Theoretically, extra inputs are expected increasing production, but in this study was found to differ. It could be occurred because N fertilizer was applied excessive its dosage recommendation showing a negative effect as a result. Assumption that more provision of input production could lead to produced more output, motivated farmers to applied excessive doses fertilizers (Setiawan and Prajanti, 2011).
synthesis of carbohydrates which were then converted into protein, and improved cell formation, as well as increasing the size of the cells that caused cells to be succulent (Buckman and Bradey, 1982). Melon cultivation during wet season caused plants were susceptible to failured due to unfavourable agro-climatic conditions. Excessive N fertilizer would cause plant to became more vulnerable, and tend to vegetative growth than generative growth. The addition of N fertilizer showed a negative influence and significantly affected the production of red chilli (Saptana et al., 2010). Similarly, Darmansyah et al., (2013) reported addition of urea and NPK fertilizer caused decreasing production of cabbage. As it was known that urea fertilizer and NPK fertilizer contained N nutrient was relatively high. Thus melon farmers in the study area needs to reduce dose of N fertilizer to increase their production.
Coefficient of P fertilizer is -0,04 and found to be insignificant. This was similar to Saptana et al., (2010) and Suharyanto et al., (2013). Provision of P nutrient through SP-36 fertilizer and compound fertilizer which caused excessive P nutrient was not absorbed by plants and only accumulated in the soil eventually.
Regression coefficient of K fertilizer is 0.2561, significant at the 99% level of convidence. This implies that 1% increase in K fertilizer will increas farm yield by 0.2561%. K nutrient serves a role in improving process of photosynthesis, efficient water used, maintained turgor pressure, forming rod stronger, activators of various enzyme systems, strengthen plant roots and improve plant resistance to disease. This was in line with research by Saptana et al., (2010) that the K fertilizer (K2O) significantly increased production of red chilli.
Organic fertilizer had positive sign but not significant increased melon production during wet season. This was presumably because application of organic fertilizer was still below the recommended dose of 20 tons/ha, which was only 4.5 tons/ha caused effect on the production was very slight so it was not significant different statistically. But it could also be caused by some farmers at study area implementated manufactured organic fertilizers (petroganik), wherein the dose per hectare was relatively lower than nature organic fertilizer. Several studies have found that organic fertilizer did not significantly affect production (Abedullah et al.,
2012; Rizkiyah et al., 2014).
Technical Efficiency of Melon Farming Distribution of technical efficiency index can give an idea of managerial capabilities, and breaks it down so it is useful for agricultural extention and formulated other activities that aim to improve the managerial capacity of farmers in accordance with target group.
Based on distribution of technical efficiency index in table 4 was known that efficiency of melon farming in wet season ranged from 0.40 to 0.99, with the average of 0.77. These results gave a meaning that on average 23% of potential production lost due to technical inefficiency.
Table 4. Frequency Distribution of Technical Efficiency Indeces
TE index Farmer (man) Percent (%)
0,40 – 0,49 3 6,67
0,50 – 0,59 6 13,33
0,60 – 0,69 6 13,33
0,70 – 0,79 10 22,22
0,80 – 0,89 6 13,33
0,90 – 1,00 14 31,11
Total 45 100,00
Mininum 0,4007
Maximum 0,9872
Average 0.7691
Source: Data processed, 2015.
Study of technical efficiency, especially in the horticultural commodities have resulted good technical efficiency indeces relatively. Fauziah (2010) on tobacco in Madura provided technical efficiency index between 0.56 to 0.99 with an average of 0.78. Saptana et al., (2010) found that average technical efficiency was 0.90 for red chili in Central Java. Study by Banani et al., (2013) on the onions in Brebes found levels of technical efficiency ranged from 0.65 to 0.99, with an average of 0.80. Darmansyah et al., (2013) on
cabbage in Rejang Lebong regency producesd technical efficiencies among 0.78 to 0.99, with an average value of 0.91. While Abiola and Daniel (2014) examined melon technical efficiency in Nigeria provided indices between 0.43 to 0.97, with an average of 0.84. Studies conducted Baree, (2012) on the onions in Bangladesh produces technical efficiency index ranged from 0.58 to 0.99 with average of 0.83.
Referring to the previous study (Bravo-uretra and Penheiro, 1997; Nwaru et al., 2013)
which categorized level of technical efficiency ≥
0.70 has been efficient, majority of melon farmers in Kulon Progo regency were catagorized in already technically efficient because 66.67% of the farmers had technical efficiency index above 0.70. However, it still leaves 33.33% of farmers who have not technically efficient yet, so they need efforts to enhanced their technical efficiency through improving technical skills and managerial capability of farmers in aspects of melon cultivation, respectively. Usage of input production efficiently can be increased to achieve its production frontier.
Farmers who have achieved average technical efficiency index and want to reach maximum efficiency likely have opportunity to increase production by 22% i.e. (1- 0.77 / 0.99). The same calculation if the most inefficient farmer wants to achieve maximum efficiency, then there is an opportunity to increase production by 40.5% i.e. (1 to 0.40 / 0.99).
website (www.tanindo.com), Action’ variety had potential productivity of 31.5 to 42 tons/hectare. While based on calculation of technical efficiency in study area, potential productivity that could be achieved with existing technology was 36.5 tons/ha (1 / 0.77 x 21704 kg). Average productivity achieved at the study time was 28.01 tons/hectare. Potential productivity in study area was in the range of maximum productivity test results by seed producers, so there are still opportunities to improved productivity of 8.49 tons/ha. An effort to increasing production could be done through improving allocation of usage input production and enhanced technical efficiency index
Determinat of Technical Efficiency
Factors affecting farmers' technical efficiency was analyzed simultaneously with technical inefficiency effects model in equation (7). In model of technical inefficiency, a positive sign of regression coefficient implies that its variables increasing technical inefficiency, or in other words giving effect of to reduce technical efficiency, and vice versa.
Table 5 presents regression coefficients of the predictor variables of technical inefficiency model, i.e. age, formal education, farm experience and access to credit. One variable found to significantly affect the technical inefficiency during wet season,
which was farmer’ experience.
Age variable had positive sign and found insignificant to technical inefficiency of melon farming. Older farmers tend to be more resistant to adopted technological innovations (Navqi and Ashfaq, 2014) as well as be more traditional and conservative, and less willing to adopted cultivation practices and usage of modern inputs (Rajendran, 2014). Similar results were found in studies
Abid et al., (2012) as well as Abiola and Daniel (2014).
Table 5. Determinant of Technical Inefficiency Effect
Variable Coefficient Std. Error
t-ratio
Constanta -1,5823 1,4301 -1,1064
Age 0.4032 0.3671 1,0985
Eduction 0.1236 0.1269 0.9744
Experiance -0.1003*** 0.0162 -6,1757 Dummy acces
to credit
0.1379 0.2062 0.6688
Source: processed data, 2015
Note: ***,**,* indicate significant at 1%, 5% and 10% levels, respectively.
Coefficient of education showed positive sign and did not significantly affect technical inefficiency, which meaned the technical inefficiency effect increased aligned with increasing levels of education. These results were not as expected. However, this was likely happened if the majority of farmers who were well educated had an alternative source of income, and they were not completely dependent on agriculture for their livelihoods (Baree, 2012). Thus there would be lack of attention by well educated farmers than less educated workers where they relied on melon farming as main source of income for their family. Findings Fauziyah (2010) and Ibrahim et al., (2014) supported results of this study.
Saptana et al., (2010) argued that more experienced farmer would be more efficient because it generally had networking wider so they had opportunity to obtained more information and tend to applied it. Further more experienced farmers had better managerial capabilities, through a learning process in previous years. This was consistent with results of previous studies. The longer farm experience would further enhance technical efficiency of farming (Sukiyono, 2005; Bozoglu and Ceyhan, 2007; Manganga, 2012; Islam et al., 2012; Mapemba, 2013; Ibrahim et al., 2014, Lubis, 2014; Abiola and Daniel, 2014). Experience of melon cultivation technology would make farmers more skilled and had good managerial abilities, because accumulation of knowledge and technical ability in previous cropping season.
Dummy access to credit did not significantly affect technical inefficiency. In other word there was no difference of technical inefficiency between farmers who had access and farmers who did not have access to credit. Similar findings were also found by Bogale and Bogale (2005) and Guestami et al., (2012). It becomes a note that farmer who has acces to credit was more inefficient. It could be caused due to the credit usage for unproductive purposes (Navqi and Ashfaq, 2014) or impropered credit allocation (Rajendran, 2014).
CONCLUSION
There is still quite wide gap between actual and potential melon production in wet season. Enhanced melon production during wet season can be done by increasing land area, use of seeds, reducing N fertilizer and increaseing K fertilizer on melon cultivation.
The average index of technical efficiency in wet season melon farming was
0.77, categorized as already efficient. However, there are still opportunities to enhanced achievement of technical efficiency through improved technical skills and managerial capability of farmers. To reduce occurrence of technical inefficiency can be done by improving farm experience of melon cultivating in wet season. Experience is factors that affect achievement of technical efficiency. The experience gained not only through a number of cultivation years, but the experience of farmers can also be enriched by involving farmers in training / courses / school field, especially melon cultivation during rainy season. So it would need to for stakeholders to facilited these activities.
REFERENCES
Abedullah, Khuda Bakhsh and Bashir Ahmad. (2006). Technical Efficiency and Its Determinants in Potato Production, Evidence from Punjab, Pakistan. The Lahore Journal of Economics,11 (2): 1-22.
Abiola, M. O., and I. Daniel. (2014). Efficiency of Melon Production In Oredo And Egor Local Government Area of Odo state, Nigeria. International Journal of Agriculture Innovation and Research, 2 (5): 732-738. Adenuga, A. H., A. Muhammad-Lawal, O. A. Rotimi. (2013). Economics and Technical Efficiency of Dry Season Tomato Production in Selected Areas in Kwara State, Nigeria. Agris on-line Papers in Economics and Informatics, 5 (1): 11-19.
Aigner, D.J., C.A.K. Lovell and P. Schmidt. (1977). Formulation and Estimation of Stochastic Frontier Production Function Models. Journal of Econometrics, 6 (1): 21-37.
Amaza, P.S., Y. Bila, and A. C. Iheanacho. (2006).
Identification of Factors that Influence Technical
Efficiency of Food Crop Production in West Africa: Empirical Evidence from Borno State, Nigeria. Journal of Agriculture and Rural Development in the Tropics and Subtropics, 107 (2): 139–147.
Amoah, Samuel Twumasi. Irene Akobar Debrah, Razak Abubakari. (2014). Technical Efficiency of Vegetable In Peri-Urban Ghana Influence and Effects Of Resource Inequalities. American Journal of Agriculture and Forestry, 2 (3): 79-87.
Kasus Di Desa Kori Kecamatan Sawoo Kabupaten Ponorogo), AGRISE. VIII (1): 15-27. Banani, Ade., Muslich Mustadjab, Djoko Koestiono,
Syafrial. (2013). Production Management and Technical Efficiency of Red Onion Farming in Brebes Regency. Journal of Basic and Applied Scientific Research, 3 (3): 85-90.
Bare, M. A. (2012). Measuring Technical Efficiency of Onion (Allium cepa L.) Farms in Bangladesh. Bangladesh Journal of Agricultural Research, 37 (1): 171-178.
Battese, G. E. and T. J. Coelli. (1992). Frontier Production Functions, Technical Efficiency and Panel Data: With Application to Paddy Farmers in India. Journal of Productivity Analysis, 3: 153-169. _______. (1995). A Model for Technical Inefficiency
Effect in Stochastic Frontier Production Function for Panel Data. Empirical Economics, 20 (2): 325-332.
Bogale, Temesgen and Ayalneh Bogale. (2005). Technical Efficiency Of Resource Use in the Production of Irrigated Potato: A Study Of Farmers Using Modern and Tradiotional Irrigation Schemes In Awi Zone, Ethiophia. Journal of Agriculture And Rural Development In the Tropics And SubTropics, 106 (1): 49-70. Bokusheva, R. And H. Hockmann. (2006). Production
Risk and Technical Inefficiency in Russian Agriculture. Journal European Review of Agricultural Economics, 33 (1): 93-118.
Bozoğlu, Mehmet. and Vedat Ceyhan. (2007).
Measuring The Technical Efficiency and Exploring The Inefficiency Determinants Of Vegetable Farms In Samsun Province, Turkey. Agricultural Systems, 94: 649–656.
Bravo-Ureta, Boris E. and António E. Pinheiro. (1997). Technical, Economic, And Allocative Efficiency In Peasant Farming: Evidence From The Dominican Republic. The Developing Economies, XXXV (1): 48–67.
Bravo-Ureta, Boris E., Daniel Solıs, Vıctor H. Moreira Lopez, Jose F. Maripani, Abdourahmane Thiam and Teodoro Rivas. (2007). Technical Efficiency in Farming: A Meta-Regression Analysis, J Prod Anal, 27: 57–72.
Buckman, H. O. and Brandy N. C. (1982). Ilmu Tanah (Terjemahan Soegiman). Jakarta: Bharata Karya. Coelli. T.J. (1995). Recent Developments In Frontier Modelling And Efficiency Measurement. Australian Journal of Agricultural Economics, 39 (3): 219-245.
_______. (1996). A Guide to FRONTIER Version 4.1: A Computer Program for Stochastic Frontier
Production and Cost Function Estimation, CEPA Working Paper 96/07, Departemen of Econometrics, University of New England, Armidale, NSW, 2351, Australia.
Coelli, T.J. and Battese, G. E. (1996). Identification of Factors Which Influence The Technical Eficiency of Indian Farmers. Australian Journal of Agricultural Economics. Vol. 40: 103-128.
Coelli, T. J., D. S. P. Rao and G.E. Battese. (2005). An Introduction to Efficiency and Productivity Analysis 2nd. USA: Springer Science+ Business Media, Inc. Darmansyah, A.N., Ketut Sukiyono dan Sri Sugiarti. (2013).
Analisis Efisiensi Teknis Dan Faktor Yang Mempengaruhi Efisiensi Pada Usaha Tani Kubis Di Desa Talang Belitar Kecamatan Sindang Dataran Kabupaten Rejang Lebong. AGRISEP, 12 (2): 177–194. Dijk, M. Van, and A. Szirmai. (2006). Technical Efficiency
and Embodied Technical Change in the Indonesian Pulp and Paper Industry. Journal of International Development, 18: 163-178.
Dinas Pertanian Dan Kelautan Kabupaten Kulon Progo. (2013). Laporan Tahunan 2012. Kulon Progo. Direktorat Jendral Hortikultura. (2004). Standard Prosedur
Operasional (SOP) Melon. Kementrian Pertanian. Republik Indonesia.
_______. (2014). Basis Data Ekspor-Import Komoditi Pertanian. Kementrian Pertanian Republik Indonesia.
Fauziyah, Elys. (2010). Analisis Efisiensi Teknis Usahatani Tembakau (Suatu Kajian Dengan Menggunakan Fungsi Produksi Stokhastik Frontier). Embryo, 7 (1): 1-7.
Guestami, B., T. Sera, Z. Kallas and J. M. Gil Roig. (2012). The Productive Efficiency of Or9ganic Farming: The Case of Grape Sector In Catalonia. Spanish Journal of Agricultural Research, 10(3): 552-566.
Green, W. H. (1993). The Economic Approach to Efficiency Analysis. In Fried H.O., C.A.K. Lovel, and P. Schmidt (eds). The Measurment of Productivity Efficiency: Technique and Applications. New York: Oxford University Press.
Ibrahim, U.W., Umar, A. S. S., Ahmed, B. (2014). Technical Efficiency and its Determinants in Water Melon Production in Borno State, Nigeria. Journal of Economics and Sustainable Development, 5 (27): 205-211.
Islam, K. M. Z., J. Sumelius, S. Backman. (2012). Do differences in technical efficiency explai the adoption rate of HYV rice? Evidene from Bangladesh. Agricultural Economics Reviews 13 (1) : 93-110.
Peshawar, Pakistan. Agric. Econ. – Czech, 59 (8): 381-388.
Kodde, David A. and Franz C Palm. (1986). Wald Criteria for Jointly Testing Equality and Inequality Restrictions. Econometrica, 54 (5): 1243-1248. Kompas, Tom. (2001). Cacth Efficiency and
Management: A Stochastic Production Analysis of the Australian Northern Prawn Fishery. International and Development Economics Working Paper 1-8. The Australian National University.
Kumbhakar, C. S. (2002). Specification and Estimation of Production Risk, Risk Preferences and Technical Efficiency. American Journal of Agricultural Economic, 84 (1): 8-22.
Lubis, Riatania Rizal Basjrah. (2014). Analisis Efisiensi Teknis, Alokatif dan Ekonomi Produksi Nanas Di Kabupaten Subang, Propinsi Jawa Barat. Unpublish Dissertation. Sekolah Pasca Sarjana. Bogor: Institut Pertanian Bogor.
Manganga, A. M. (2012). Technical Efficiency and Its Determinants in Irish Potato Production : Evidence from Dedza District, Central Malawi. AmericanEurasian J. Agric. & Environ. Sci. 12 (2): 192-197.
Mapemba, Lawrence D. (2013). Farm Household Production Efficiency in Southern Malawi: An Efficiency Decomposition Approach. Journal of Economics and Sustainable Development, 4 (2): 236-245.
Martono, Arif. (2007). Kesesuaian Lahan dan Perencanaan Penggunaan Lahan untuk Pertanian di Kawasan Pesisir Kabupaten Kulon Progo, Yogyakarta. Unpublish Thesis. Sekolah Pasca sarjana. Bogor: Institut Pertanian Bogor. Nahraeni, Wini. S. Hartoyo, Y Syaukat, Kuntjoro. (2012).
Pengaruh Kemiringa Lahan Dan Sistem Konservasi terhadap Efisiensi Usahatani Kentang Dataran Tinggi. Jurnal Pertanian, 3 (1): 1-12.
Navqi, Syed Asif Ali dan Muhammad Ashfaq. (2014).
Estimation of Technical Efficiency And It’s
Determinat In The Hybrid Maize Production In District Chiniot: A Cobb-Douglas Model Approcach, Pakistan Journal of Agricultal Sciences. 51 (1): 181-185.
Nicholson, Walter. (1998). Teori Ekonomi Mikro – Prinsip Dasar dan Perluasannya. Jakarta: Binarupa Akasara.
Nwaru, J.C, B. Okoye, and P.C. Ndukwu. (2011). Measurement Aand Determinants of Production
Efficiency among Small-Holder Sweet Potato (Ipomoea batatas) Farmers in Imo State, Nigeria. European Journal of Scientific Research, 59 (3): 307-317.
Pranata, Ade dan Ahmad Takhlishul Umam. (2015). Pengaruh Harga Bawang Merah Terhadap Produksi Bawang Merah Di Jawa Tengah. JEJAK Journal of Economics and Policy, 8 (1): 36-44.
Rahman, K.M.M, M.I.A. Mia and M.K.J. Bhuyan. (2012). A Stochastic Frontier Approach to Model Technical Efficiency of Rice Farmers in Bangladesh: An Empirical Analysis. The Agriculturists, 10 (2): 9-19. Rajendran, Srinivasulu. (2014). Technical Efficiency of Fruits
and Vegetables Producers in Tamil Nadu, India: A Stochastic Fronter Approach. Asian Jounal of Agriculture and Development, 11 (1): 77-93.
Rizkiyah, Noor., Syafrial dan Nuhfil Hanani. (2014). Faktor-Faktor Yang Mempengaruhi Efisiensi Teknis Usahatani Kentang (Solanum tuberosum L) Dengan Pendekatan Stochastic Production Frontier (Kasus Desa Sumber Brantas Kecamatan Bumiaji Kota Batu). Habitat, XXV (1): 25-31.
Saptana, Arief Daryanto, Heny, K. Daryanto, Kuntjoro. (2010). Analisis Efisiensi Teknis Produksi Usahatani Cabai Merah dan Perilaku Petani dalam Menghadapi Risiko. Agro Ekonomi, 28 (2): 153-188.
Setiadi dan Parimin. (2006). Bertanam Melon. Jakarta: Penebar Swadaya.
Setiawan, Avi Budi dan Sucihatiningsih Dian Wisika Prajanti. (2011). Analisis Efisiensi Penggunaan Faktor-Faktor Produksi Usaha Tani Jagung Di Kabupaten Grobogan Tahun 2008. Jurnal Ekonomi dan Pembangunan JEJAK, 4 (1): 69-75.
Suharyanto, Jangkung Handoyo Mulyo, Dwidjono Hadi Darwanto dan Sri Widodo. (2013). Analisis Efisiensi Teknis Pengelolaan Tanaman Terpadu (PTT) Padi Sawah Di Provinsi Bali. SEPA, 9 (2): 219 – 230. Sukiyono, Ketut. (2005). Faktor Penentu Tingkat Efisiensi
Usahatani Cabai Merah Di Kecamatan Selepu Rejang Kabupaten Rejang Lebong. Agro Ekonomi. 23 (2): 176-190.
Suratiyah, Ken. (2014). Ilmu Usahatani. Jakarta: Penebar Swadaya.
Sutanto, Himawan Arif. (2015). Analisis Efisiensi Teknis Bank Pembangunan Daerah. JEJAK Journal of Economics and Policy, 8 (1): 23-35
Sumaryanto. (2014). Peran Sektor Pertanian Dalam MDGs dan Kesiapan Menyongsong SDGs. In: Haryono, Effendi Pasandaran, Muchjidin Rachmat, Sudi Mardianto, Sumedi, Handewi P. Salim dan Agung Hendriadi (Eds). Reformasi Kebijakan Menuju Transformasi Pembangunan Pertanian. Jakarta: IAARD Press.
Tanindo Intertraco, PT. (2014). Melon. http://www.tanindo.com/index.php?option=co m_content&view. Diunduh pada 16 Januari 2014. Taraka, Kallika., Mad Nasir Shamsudin, Ismail Abd. Latif and Shaufique. (2012). Estimation of Technical Efficiency for Rice Farms in Central Thailand Using Stochastic Frontier Approach. Asian Journal of Agriculture and Development, 9 (2): 1-11.