Research Paper
Drying kinetics and quality of Monukka seedless grapes
dried in an air-impingement jet dryer
Hong-Wei Xiao
a, Chang-Le Pang
a, Li-Hong Wang
a,b, Jun-Wen Bai
a,
Wen-Xia Yang
c,**
, Zhen-Jiang Gao
a,b,*
aCollege of Engineering, China Agricultural University, P.O. Box 194,17 Qinghua Donglu, Beijing 100083, China bCollege of Machinery and Electricity Engineering, Shihezi University, Shihezi 832003, China
cGanNan Normal University, Ganzhou, Jiangxi 341000, China
a r t i c l e
i n f o
Article history:
Received 13 September 2009 Received in revised form 13 October 2009
Accepted 5 November 2009 Published online 27 November 2009
Drying kinetics and quality of Monukka seedless grapes were investigated in an impingement dryer under different drying temperatures (50,55,60 and 65C) and air velocities (3,5,7 and 9 m s1). Results indicated that the effect of drying temperature on drying time was more distinct than air velocity. The moisture effective diffusivity ranged from 1.821010to 5.841010m s2calculated using the Fick’s second law of diffusion. The activation energy determined from Arrhenius equation was 67.29 kJ mol1. The hardness of dried Monukka seedless grapes changed from 9.53 to 17.16 N showing an increasing trend as drying temperature increased. The retention ratio of vitamin C of the samples varied from 10.26 to 39.73% compared to the fresh one. The results also illustrated that the drying temperature was the major factor controlling the retention of vitamin C, while there was no direct correlation between air velocity and vitamin C retention.
ª2009 IAgrE. Published by Elsevier Ltd. All rights reserved.
1.
Introduction
As one of the world’s most popular and largest fruit crops, grape production all over the world was about 66,271,676 tons and China produced about 6,250,000 t according to Food and Agri-culture Organization (FAO) data for 2007 (FAO, 2008). The five major grape producing countries are Italy (about 8.52106t), France (about 6.50106t), China, the United States (about 6.11106t) and Spain (about 6.01106t) (FAO, 2008). In China, the Xinjiang Uigur Autonomous Region is one of the main grape production areas. In this region the Monukka seedless grape is the mainly cultivated variety. This is an insect and disease-resistant and high-yielding cultivar (Yanget al., 2009).
Grapes are a seasonal fruit being harvested during July– September in China. Fresh grapes, having relatively high
moisture contents, are very sensitive to microbial spoilage during storage, even under refrigerated conditions. Therefore, within a few weeks following harvest they must either be consumed or processed into various products. Drying is the most common form for grape processing. It can process grapes into raisins for longer shelf-life by reducing the mois-ture content to a low level. Raisins can be consumed either directly as ready-to-eat food or as ingredients in biscuits, breads and porridges.
The drying technology used is important for raisin quality. Currently, almost all raisins are directly or indirectly produced by natural drying in sunlight (Liet al., 2009). The most common drying method is sun drying, which is traditionally practiced in many countries (Pangavhane and Sawhney, 2002). This technique has the advantages of simplicity and small capital
*Corresponding author. College of Engineering, China Agricultural University, P.O. Box 194,17 Qinghua Donglu, Beijing 100083, China. **Corresponding author.
E-mail addresses:[email protected](W.-X. Yang),[email protected](Z.-J. Gao).
A v a i l a b l e a t w w w . s c i e n c e d i r e c t . c o m
j o u r n a l h o m e p a g e : w w w . e l s e v i e r . c o m / l o c a t e / i s s n / 1 5 3 7 5 1 1 0
investment. However, it requires large areas, high labour costs and the drying time usually takes 15–20 days which is unde-sirable economically (Basunia and Abe, 2001; Doymaz, 2006). Furthermore, the final product may be contaminated by dust and insects and the exposure to solar radiation results in colour deterioration(Andritsoset al., 2003). In order to improve the quality, traditional sun drying techniques can be replaced by industrial drying methods such as hot-air mechanical and solar drying (Ertekin and Yaldiz, 2004). Much research has been carried out to investigate the solar and hot-air drying of grapes. Azzouz et al. (2002) experimentally evaluated the drying kinetics and moisture diffusivity of convective drying of grapes. Ramoset al.(2004) observed the microstructural changes of grapes during hot-air drying.Fadhelet al.(2005) studied the solar drying of grapes by three different processes and found that the solar tunnel greenhouse drying was satisfactory and competitive to a natural convection solar drying process.Bennamoun and Belhamri (2006)investigated the drying kinetics of grapes undergoing solar drying and Esmaiiliet al.(2007b)determined the thin-layer drying char-acteristics of seedless grapes when they were processed using a tray dryer.Margaris and Ghiaus (2007)studied experimen-tally the hot-air drying characteristics of Sultana grapes.
Texture and nutrition are important quality attributes evaluating the quality of dried grapes (Esmaiiliet al., 2007a). Apart from the variety and growing conditions, the texture and nutritional value of grape raisins are mainly related to the drying conditions (Mahmutoglu et al., 1996). Undesirable changes in texture and nutrition of dried grapes may lead to a decrease in its quality and marketing value. Usually, if the texture of the dried grapes is softer the quality is better. In hot-air drying, the nutritional quality of the product can be adversely affected by high temperature and long drying time. It was observed that if vitamin C is well retained during drying, other nutritional components are also well preserved (Lin et al., 1998). Therefore, vitamin C can be taken as an indicator of the nutritional quality of Monukka seedless grapes.
Air-impingement drying technology is an efficient drying process and has been used successfully in both the paper and textile industries. During air-impingement processing, the air impinges on the product surface at high velocity, removes the thermal boundary layers and increases the rate of heat transfer (Anderson and Singh, 2006). The heat transfer coef-ficient is about 5 times higher than with cross-circulation dryers (Seyedeinet al., 1995) which greatly accelerates the drying rate and reduces the drying time. However, to date few
research results concerning air-impingement drying charac-teristics and the subsequent quality of the dried grapes are available (Yanget al., 2009). Therefore, the objectives of the current work were to investigate the effect of air-impinge-ment drying temperature and air velocity on the drying characteristics of Monukka seedless grapes, to calculate moisture effective diffusivity and activation energy, and to evaluate the quality of dried grapes in terms of their texture and vitamin C content.
2.
Materials and methods
2.1. Raw material
Fresh Monukka seedless purple grapes were harvested from Shihezi in the Xinjiang Uigur Autonomous Region of China. The samples were checked carefully to discard spoiled fruit in order to prevent contamination by bacteria or fungi. To ensure the uniformity of the physical characteristics of experimental materials, the grape samples with the same size (average berry radius, length and weight is 7.6 mm, 34.1 mm and 4.34 g, respectively) were selected. The average initial moisture content of the grape samples was 4.24 kg kg1in dry basis, as determined by vacuum drying at 70C for 24 h following the Association of Official Analytical Chemists (AOAC) method no.934.06 (AOAC, 1990). The samples were washed with tap water to remove the dust then blown with air for about 5 min to eliminate excess water from the surface. No chemical pretreatments or preservatives were applied. The prepared samples were wrapped with a plastic film and stored in a refrigerator at 31C and 90% relative humidity for several hours in order to prevent moisture loss before the experi-ments were carried out.
2.2. Experimental set-up and procedure
A schematic diagram of equipment used for air-impingement drying is shown inFig. 1.This apparatus basically consist of series of round nozzles in lines, an electric heater to heat the air, a centrifugal fan to supply the air flow and circulate the air flow, and a Proportional-Integral-Derivative (PID) controller (Omron, model E5CN, Tokyo, Japan) to control drying temperature. The distance between the round impingement nozzles and the up surface of grape samples is about 80 mm. Air outlet velocity was measured with Founder Probe Anemometer (Founder, China) having an accuracy of Nomenclature
D0 Constant diffusivity basis (m2s1) Deff Effective diffusivity (m2s1) Ea Activation energy (kJ mol1)
Me Equilibrium moisture content (kg [water] kg1[dry matter])
R2 Correlation coefficient (dimensionless) M0 Initial moisture content (kg [water] kg1[dry
matter])
Mt Moisture content at timet(kg water/kg dry matter) n Positive integer
r Volume equivalent radius (m) R Universal gas constant (J mol1K1) t Drying time (s)
0.1 m s1. During the drying experiments, temperature and relative humidity of the surroundings is at the range of from 18.1C to 33.2C and from 22.3% to 42.3%, respectively. A ACS100 Frequency Converter (ABB, Switzerland) was used to vary the air velocity. After the dryer had reached steady state conditions for the set points (at least 30 min), the grape samples were spread into a single layer onto a stainless steel wire mesh in the drying chamber. Each sample was located so as not to touch the adjacent ones. The sample weight was kept at 434.000.50 g for all runs. The experiments were per-formed according to Table 1. Weight loss of samples was measured by means of removing the drying tray from the drying chamber and weighing on an electronic balance (0.01 g) at 1 h intervals during drying. It took less than 15 s to weigh the sample. Drying was continued until the grapes dried to raisins with 0.25 kg kg1(d. b.) moisture content. The product was cooled and packed in low density polyethylene (LDPE) bags that were heat-sealed. The experiments were replicated three times and the drying kinetics were calculated as the average of the three replicates.
2.3. Mathematical modelling of drying curves
The moisture ratio (MR) of grape samples during drying experiments was calculated using Eq.(1).
MR¼MtMe M0Me
(1)
WhereM0is the initial moisture content,Meis the equilibrium moisture content andMtis the moisture content at timet. The values of the equilibrium moisture content,Meare relatively small compared toMtorM0. Thus the Eq.(1)can be written in a more simplified form as follows (Doymazet al., 2004; Goyal
et al., 2007):
MR¼Mt
M0 (2)
The drying rate of grape samples during drying experiments was computed using Eq.(3)and expressed as g [water] g1[dry solids] h1.
Drying Rate¼Mt1Mt2
t2t1 (3)
Wheret1andt2are the drying times in hours at different times during dying; Mt1 andMt2 is the moisture content of grape samples at timet1andt2, respectively expressed on a dry basis.
2.4. Calculation of moisture effective diffusivity
Generally, moisture effective diffusivity was used to describe the drying characteristics, due to limited information on the mechanism of moisture movement during drying and complexity of the process, which may involve molecular diffusion, capillary flow, Knudsen flow, hydrodynamic flow, surface diffusion and all other factors (Souraki and Mowla, 2008). It was assumed that the whole drying process occurs during the falling rate period and moisture diffusion controls the process, the Fick’s second law of diffusion can be used to describe the drying course of Monukka seedless grapes ( Doy-maz and Pala, 2002; Srikiatden and Roberts, 2006). The solution of the Fick’s second law equation can be given as Eq.(4)with the assumption that neglecting shrinkage, constant temperature and diffusion coefficients and uniform initial moisture distri-bution (Matteoet al., 2000; Doymaz, 2006; Xiaoet al., 2009). Fig. 1 – Schematic diagram of hot-air impingement dryer 1. PID controller 2. Frequency converter 3. Electric motor 4. Electric heater 5. Centrifugal fan 6. Series of circular nozzles 7. Drying chamber 8. Temperature and air velocity sensor 9. Drying tray 10.grapes being dried.
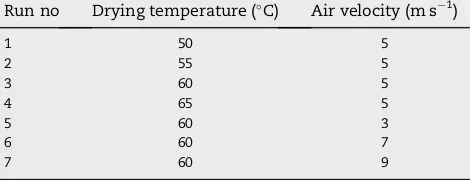
Table 1 – Design for the experiments with run conditions included.
Run no Drying temperature (C) Air velocity (m s1)
1 50 5
2 55 5
3 60 5
4 65 5
5 60 3
6 60 7
M
Where,Deffis the moisture effective diffusivity (m2s1);ris volume equivalent radius of the Monukka grape samples, with 0.9102m as its value; t is the drying time expressed in second (s); andnis positive integer. For long drying time, the Eq.(4)can be simplified as Eq.(5)by taking the first term of series solution (Crank, 1975; Matteoet al., 2000; Doymaz, 2006).
M
The natural logarithm form of Eq.(5)was given as Eq.(6). The moisture effective diffusivity can be calculated using the method of slopes. It is typically determined by plotting the experimental drying data in terms ofln(MR)versustime. So the slope can be given from the linear regression ofln(MR) versustime curves, then the effective diffusion coefficients (Deff) can be determined as shown in Eq.(7).
Deff¼ r2
p2Slope (7)
2.5. Calculation of activation energy
Activation energy is the relative ease with which the water molecules pass the energy hurdle while migrating within the sample. The dependence of effective moisture diffusivity (Deff) on drying temperature has been shown to follow an Arrhenius relationship (Parket al., 2002; Srikiatden and Roberts, 2006; Doymaz, 2007a,b; Singh and Gupta, 2007) presented as follows (Eq.(8)): activation energy (kJ mol1);Ris the universal gas constant with 8.31 J mol1K1as its value;Tis the drying air tempera-ture (C). By taking the natural logarithm of both sides, the Eq. (8) can be transformed into a linear-logarithmic form, as shown in Eq.(9). Consequently, the activation energy (Ea) can be calculated from the slope of ln (Deff)versusthe reciprocal of the temperature (1/(Tþ273.15)).
lnDeff
The textural properties of dried grape samples were evaluated by a compressive test using a texture analyser (Instron 430, Buckinghamshire, UK). A dried grape sample was placed on
a hollow planar base. The force was then applied to the sample by a 2.0 mm spherical probe at a constant speed of 0.5 mm s1 with a penetration distance of 2.0 mm. The maximum compression force of a rupture test of each sample was used to describe the sample texture in terms of hardness. All tests were duplicated and the average values were reported.
2.7. Determination of vitamin C content
Vitamin C content of Monukka seedless grape samples was determined by a titration method following the methodology described by Marfil et al. (2008) with slight modification. Vitamin C was measured as dehydroascorbic acid following oxidation of reduced ascorbic acid with 2, 6-dichloro-indo-phenol (0.01 g/100 g solution) and expressed as mg vitamin C/ 100 g raisins on wet basis. All determinations were performed in duplicate. The vitamin C retention ratio of the dried samples was then calculated using Eq.(10)as follows:
Retention ratio¼Vitamin C content of dried samples Vitamin C content of fresh samples
100% (10)
3.
Results and discussion
3.1. Drying curves
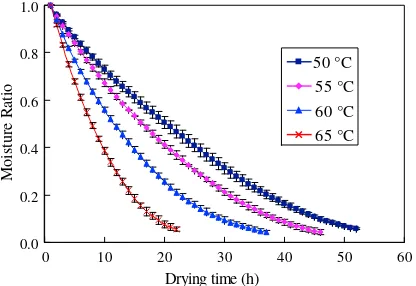
To compare the effect of different drying temperature and air velocity on the drying kinetics of Monukka seedless grapes, the curves of MRversusdrying time and curves of drying rate versusmoisture content under different processing parame-ters are shown inFigs. 2–4. FromFigs. 2 and 3, it can be seen that MR of grape samples decreased with the increase of drying time. It can also be seen that the drying time taken to reduce the moisture content of Monukka seedless grape samples from the initial moisture 4.24 kg kg1(d. b.) to a final 0.25 kg kg1(d. b.) was 51, 45, 37 and 21 h with a constant hot-air velocity of 5 m s1at drying temperatures of 50, 55, 60, and 65C, respectively. While it took 39, 37, 34 and 31 h at a constant drying temperature of 60C with air velocities of 3,
0.0
Fig. 2 – Drying kinetics of Monukka seedless grapes at different drying temperatures with constant air velocity of
5, 7 and 9 m s1, respectively. This illustrates that increasing the drying temperature and air velocity can enhance the drying rate and decrease the drying time of Monukka seedless grape samples. The effect of drying temperature on drying rate of Monukka seedless grape samples was more distinct than the effect of air velocity. This might be because moisture diffusion from interior layer to grape surface controlled the drying process and its rate mainly depended on drying temperature. This is in agreement with the earlier research on the drying of various vegetables and fruits such as Thompson seedless grapes (Pangavhaneet al., 2000), apricot (Bozkir, 2006) and carrot (Xiaoet al., 2009).
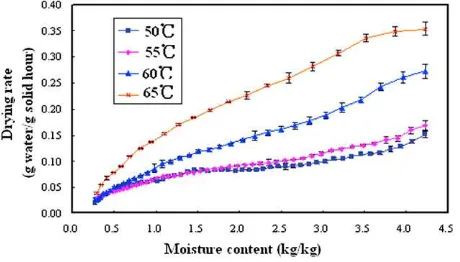
The drying rateversusmoisture content curves of Monukka seedless grape samples are illustrated in Fig. 4. The curves show that the drying rate decreased continuously with moisture content. The drying rate was rapid during the initial period but it became very slow at the last stages during the drying process. As shown inFig. 4, there was no constant drying rate period, and the entire drying process occurred during a falling rate period. The absence of constant rate period might be due to the reason that at initial stages of
drying the product could not provide a constant supply of water for an appreciable period of time (Togrul and Pehlivan, 2003; Prakashet al., 2004; Singh and Gupta, 2007). It is clear that diffusion is the dominant physical mechanism governing moisture movement from interior to surface of Monukka seedless grapes during drying process. Similar results have been reported in literature by other researchers, such asSingh
et al. (2006)for sweet potato, Doymaz (2007a)for pumpkin slices andSingh and Gupta (2007)for carrot.
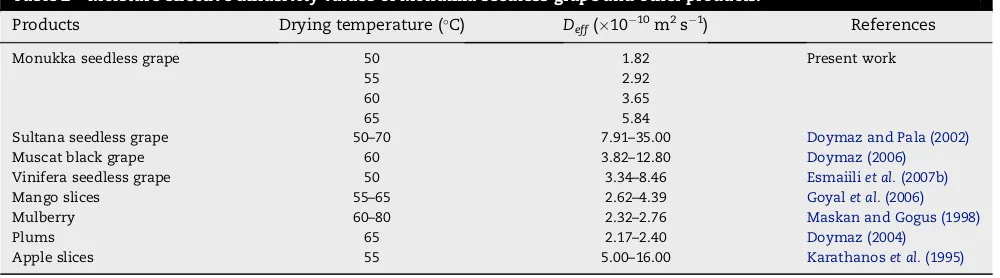
3.2. Moisture effective diffusivity
The results of moisture effective diffusivity (Deff) of Monukka seedless grape and other related products under different drying temperatures are summarised inTable 2. It shows that the Deff values of the Monukka seedless grape samples changed from 1.821010 to 5.841010m2s1, which lie within the general range from 1011to 109m2s1for food materials (Madamba et al., 1996). It was noted that Deff increased with the increase of drying temperature. This phenomenon might be due to the fact that moisture effective diffusivity depends on drying temperature, variety and composition of the drying samples (Rizvi, 1986). When samples were dried at higher temperature, increased heating energy would increase the activity of the water molecules leading to higher moisture diffusivity. This finding agrees with that reported byShiet al.(2008)for drying blueberries with infrared radiation heating, Souraki and Mowla (2008) for drying green beans using a fluidised bed dryer,Sharmaet al.
(2009)for drying carrot slices by convective drying method, Sharma et al. (2009) for drying garlic cloves undergoing microwave-convective drying.
3.3. Activation energy
The activation energy (Ea) of Monukka seedless grape samples was 67.29 kJ mol1calculated from the slope of the Arrhenius plot as presented in Fig. 5. It is in the range of 12.7– 110.0 kJ mol1for most food materials (Troncoso and Pedre-schi, 2007). The activation energy is an indication of the required energy to remove moisture from inside to the outside of the drying product. For the sake of comparison activation energy of grapes and other agricultural products are presented in Table 3. FromTable 3, it was found that the activation energy of Monukka seedless grape is higher than the activa-tion energy of Sultanin grapes, Chasselas grapes, potato slices, broad beans, carrot slices, and chopped coconuts, but lower than the activation energy of black tea, pumpkin slices and nettle leaves.
This phenomenon might be due to the fact that the components, tissue structures and specific surface area of the product have a significant effect on its activation energy. In general, the products which have high content of sugar or pectin, compact tissue structures and small specific surface area may have higher activation energy than the ones which have low content of sugar or pectin, porous structures and large specific surface area. Furthermore, pretreatments, which can change the physical properties of the sample cell structure or remove the waxy layer on the surface of the
0.0 0.1 0.2 0.3 0.4 0.5 0.6 0.7 0.8 0.9 1.0
0 5 10 15 20 25 30 35 40 45
Drying time (h)
M
o
istu
re
R
atio
Fig. 3 – Drying kinetics of Monukka seedless grapes at different air velocities with constant drying temperature of
608C.
Fig. 4 – Drying rateversusmoisture content curves of
Monukka seedless grapes at different drying temperature
products that impede moisture transport during drying, also have an important effect on the activation energy of products.
3.4. Textural properties
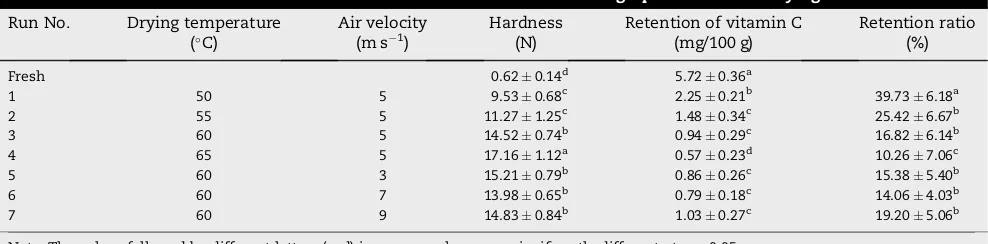
The texture of dried Monukka seedless grape subjected to different process parameters is reported in terms of hardness inTable 4. Its values ranged from 9.53 to 17.16 N, which was the maximum breaking force of the dried Monukka seedless grapes. It was also established that drying temperature (from 55 to 65C) significantly effected the hardness of Monukka seedless grapes during the drying process. In addition, its hardness values showed an increasing trend as the drying temperature increased. However, no significant difference (p>0.05) was found among the hardness values of the
Mon-ukka seedless grapes when they were dried at different air velocities with a constant drying temperature. Hardness is an important parameter used to investigate case hardening in dried products, which is related to the strength of the struc-ture under compression (Chonget al., 2008). The above results are probably due to the fact that if Monukka seedless grapes are dried at high temperature the water removal rate from the surface is faster than the rate at which water migrates from the interior and a hard layer, containing previously dissolved solutes, is formed on the surface.
3.5. Retention of vitamin C
The retention of vitamin C of Monukka seedless grape samples under different drying conditions is presented in Table 4. In all dried samples the retention ratio of vitamin C was lower than 39.73%. The sample with the highest retention of vitamin C was the that dried at the lowest drying temper-ature 50C (2.25 mg vitamin C/100 g w. b.), whilst the most degradation of vitamin C occurred at the highest drying temperature 65C (0.57 mg vitamin C/100 g w. b.). However, drying air velocity did not significantly influence the vitamin C retention (p>0.05). Hence it can be concluded that the
drying temperature was the major factor controlling the retention of vitamin C, while there was no direct correlation between drying air velocity and vitamin C retention. Similar results were reported by Kayaet al.(2009b); Kuljarachanan
et al.(2009), andMirandaet al.(2009). The loss of vitamin C, which is a thermo-sensitive compound, was probably due to oxidation and thermal degradation (Hawlader et al., 2006; Marfilet al., 2008).
In general, the quality of foodstuff is determined by its nutrition. Vitamin C is very important for human health and must be taken into the body. It has a protective effect against lung, bladder and prostate cancers (Halliwell, 1994). It also has antioxidant roles against oxidative damage and cardiovas-cular disease (Kritchevsky, 1992). An increase in drying temperature has a negative effect on vitamin C preserving. This finding suggests that in the grape drying process higher drying temperatures should not be adopted for preserving vitamin C and other nutritional components.
Table 2 – Moisture effective diffusivity values of Monukka seedless grape and other products.
Products Drying temperature (C) D
eff(1010m2s1) References
Monukka seedless grape 50 1.82 Present work
55 2.92
60 3.65
65 5.84
Sultana seedless grape 50–70 7.91–35.00 Doymaz and Pala (2002)
Muscat black grape 60 3.82–12.80 Doymaz (2006)
Vinifera seedless grape 50 3.34–8.46 Esmaiiliet al.(2007b)
Mango slices 55–65 2.62–4.39 Goyalet al.(2006)
Mulberry 60–80 2.32–2.76 Maskan and Gogus (1998)
Plums 65 2.17–2.40 Doymaz (2004)
Apple slices 55 5.00–16.00 Karathanoset al.(1995)
Fig. 5 – Arrhenius-type relationship between moisture effective diffusivity and drying temperature of Monukka seedless grapes.
Table 3 – Activation energies of Monukka seedless grape and other related products.
Products Ea (kJ mol1) References
Monukka seedless grape 67.29 Present work Sultanin grape 54.00 Azzouzet al.(2002)
Chasselas grape 49.00 Azzouzet al.(2002)
Potato slices 39.49–42.34 Aghbashloet al.(2009)
Broad beans 17.10–27.71 Hashemiet al.(2009)
Carrot slices 23.00 Kayaet al.(2009a)
Chopped coconut 25.93 Madhiyanonet al.(2009)
Nettle leaves 79.87–109.00 Kaya & Aydin (2009)
Pumpkin slices 78.93 Doymaz (2007a)
4.
Conclusions
The effect of drying temperature and air velocity on the drying kinetics and quality of Monukka seedless grapes, which sub-jected to thin-layer air impingement drying, were examined in this investigation. In case of the drying kinetics the drying temperature and air velocity were found to have an effect on the drying rate of Monukka seedless grapes. Compared to air velocity, the effect of drying temperature on the drying time was more significant. Because the entire drying process occurred during the falling period, Fick’s second law was used to describe the drying characteristics of Monukka seedless grapes. The moisture effective diffusivity (Deff) was determined using the slope of a linear plot (ln(MR)versustime) and its value changed from 1.821010to 5.841010m2s1for 5 m s1and temperature between 50 and 65C. The drying temperature was found to have a significant effect onDeff. TheEaof Monukka seedless grapes was determined as 67.29 kJ mol1. In terms of the quality of dried grapes, the texture and vitamin C retention were studied. Regarding textural quality, the hardness values showed an increasing trend as the drying temperature increased but no significant relationship was found between air velocity and sample hardness. The retention of vitamin C was mainly controlled by the drying temperature. However, drying air velocity did not show any significant influence on the vitamin C retention (p>0.05).
Acknowledgements
This research is funded by the Science and Technology Support Project for Xinjiang Production and Construction Corps of China (No.2008ZJ28), the National High Technology Research and Development Program of China (863 Program) under Grant No.2007AA100406-04 and the Funding System for Scientific Research Projects of Doctor Subject of Chinese Advanced University (No.20060019011).
r e f e r e n c e s
Aghbashlo M; Kianmehr M; Arabhosseini A(2009). Modeling of
thin-layer drying of potato slices in length of continuous band dryer. Energy Conversion and Management,50(5), 1348–1355.
Anderson B A; Singh R P(2006). Modeling the thawing of frozen foods using air impingement technology. International Journal of Refrigeration,29(2), 294–304.
Andritsos N; Dalampakis P; Kolios N(2003). Use of geothermal energy for tomato energy. GMC Bulletin (March) 9–13. AOAC. (1990). Official Methods of Analysis of the Association of
Official Analytical Chemists, Official Method 934.06. AOAC International, Arlington, VA, USA.
Azzouz S; Guizani A; Jomaa W; Belghith A(2002). Moisture diffusivity and drying kinetics equation of convective drying of grapes. Journal of Food Engineering,55(4), 323–330. Basunia M A; Abe T(2001). Thin-layer solar drying characteristics
of rough rice under natural convection. Journal of Food Engineering,47(4), 295–301.
Bennamoun L; Belhamri A(2006). Numerical simulation of drying under variable external conditions: application to solar drying of seedless grapes. Journal of Food Engineering,76(2), 179–187. Bozkir O(2006). Thin-layer drying and mathematical modeling for
washed drying apricots. Journal of Food Engineering,77(1), 146–151.
Chong C H; Law C L; Cloke M; Hii C L; Abdullah L C; Daud W R W (2008). Drying kinetics and product quality of dried
Chempedak. Journal of Food Engineering,88(4), 522–527. Crank J(1975). The Mathematics of Diffusion (second ed). Oxford
University Press, London, UK.
Doymaz I(2004). Effect of dipping treatment on air drying of plums. Journal of Food Engineering,64(4), 465–470. Doymaz I(2006). Drying kinetics of black grapes treated with
different solutions. Journal of Food Engineering,76(2), 212–217. Doymaz I(2007a). The kinetics of forced convective air-drying of pumpkin slices. Journal of Food Engineering,79(1), 243–248. Doymaz I(2007b). Air-drying characteristics of tomatoes. Journal
of Food Engineering,78(4), 1291–1297.
Doymaz I; Gorel O; Akgun N A(2004). Drying characteristics of the solid by-product of olive oil extraction. Biosystems
Engineering,88(2), 213–219.
Doymaz I; Pala M(2002). The effects of dipping pretreatments on air-drying rates of the seedless grapes. Journal of Food Engineering,52(4), 413–417.
Ertekin C; Yaldiz O(2004). Drying of eggplant and selection of a suitable thin layer drying model. Journal of Food Engineering,63(3), 349–359.
Esmaiili M; Sotudeh-Gharebagh R; Cronin K; Mousavi M A E; Rezazadeh G(2007a). Grape drying: a review. Food Reviews International,23(3), 257–280.
Esmaiili M; Sotudeh-Gharebagh R; Mousavi M A E; Rezazadeh G (2007b). Influence of dipping on thin-layer drying
characteristics of seedless grapes. Biosystems Engineering, 98(4), 411–421.
Fadhel A; Kooli S; Farhat A; Bellghith A(2005). Study of the solar drying of grapes by three different process. Desalination, 185(1–3), 535–541.
Table 4 – The hardness and vitamin C retention of dried Monukka seedless grapes at different drying conditions Run No. Drying temperature
(C)
Air velocity
(m s1) Hardness(N) Retention of vitamin C(mg/100 g) Retention ratio(%)
Fresh 0.620.14d 5.720.36a
1 50 5 9.530.68c 2.250.21b 39.736.18a
2 55 5 11.271.25c 1.480.34c 25.426.67b
3 60 5 14.520.74b 0.940.29c 16.826.14b
4 65 5 17.161.12a 0.570.23d 10.267.06c
5 60 3 15.210.79b 0.860.26c 15.385.40b
6 60 7 13.980.65b 0.790.18c 14.064.03b
7 60 9 14.830.84b 1.030.27c 19.205.06b
FAO. (2008). FaoStat database. Available from.http://faostat.fao.org. Goyal R K; Kingsly A R P; Manikantan M R; Ilyas S M(2006).
Thin-layer drying kinetics of raw mango slices. Biosystems Engineering,95(1), 43–49.
Goyal R K; Kingsly A R P; Manikantan M R; Ilyas S M(2007). Mathematical modelling of thin layer drying kinetics of plum in a tunnel dryer. Journal of Food Engineering,79(1), 176–180. Halliwell B(1994). Free radicals, antioxidants, and human disease: curiosity, cause, or consequence. Lancet,344(8924), 721–724. Hashemi G; Mowla D; Kazemeini M(2009). Moisture diffusivity and shrinkage of broad beans during bulk drying in an inert medium fluidized bed dryer assisted by dielectric heating. Journal of Food Engineering,92(3), 331–338.
Hawlader M N A; Perera C O; Tian M; Yeo K L(2006). Drying of guava and papaya: impact of different drying methods. Drying Technology,24(1), 77–87.
Kaya A; Aydin O(2009). An experimental study on drying kinetics of some herbal leaves. Energy Conversion and Management, 50(1), 118–124.
Kaya A; Aydin O; Demirtas C(2009a). Experimental and theoretical analysis of drying carrots. Desalination,237(1–3), 285–295. Kaya A; Aydin O; Kolayli S(2009b). Effect of different drying
conditions on the vitamin C (ascorbic acid) content of Hayward kiwifruits (Actinidia deliciosa Panch). Food and Bioproducts Processing. doi:10.1016/j.fbp.2008.12.001. Karathanos V T; Kostaropoulus A E; Saravacos G D(1995). Air
drying behavior of osmotically dehydrated fruits. Drying Technology,13(5–7), 1503–1521.
Kritchevsky D(1992). Antioxidant vitamins in the prevention of cardiovascular disease. Nutrition Today,27(1), 30–33. Kuljarachanan T; Devahastin S; Chiewchan N(2009). Evolution of
antioxidant compounds in lime residues during drying. Food Chemistry,113(4), 944–949.
Li L L; Wang Z F; Hu X S; Wu J H; Liao X J; Chen F; Zhao G H(2009). Drying effects of two air-drying shelters in a pilot test on sultana grapes. Journal of Food Processing Engineering. doi:10. 1111/j.1745-4530.2008.00266.x.
Lin T M; Durance T D; Scaman C H(1998). Characterization of vacuum microwave, air and freeze dried carrot slices. Food Research International,31(2), 111–117.
Madamba P S; Driscoll R H; Buckle K A(1996). The thin layer drying characteristics of garlic slices. Journal of Food Engineering,29(1), 75–97.
Madhiyanon T; Phila A; Soponronnarit S(2009). Models of fluidized bed drying for thin-layer chopped coconut. Applied Thermal Engineering,29(14–15), 2849–2854.
Mahmutoglu T; Emir F; Saygi Y B(1996). Sun/Solar drying of differently treated grapes and storage stability of dried grapes. Journal of Food Engineering,29(3–4), 289–300.
Marfil P H M; Santos E M; Telis V R N(2008). Ascorbic acid degradation kinetics in tomatoes at different drying conditions. LWT-Food Science and Technology,41(9), 1642–1647.
Margaris D P; Ghiaus A G(2007). Experimental study of hot air dehydration of Sultana grapes. Journal of Food Engineering, 79(4), 1115–1121.
Maskan M; Gogus F(1998). Sorption isotherms and drying characteristics of mulberry (Morus alba). Journal of Food Engineering,37(4), 437–449.
Matteo M D; Cinquanta L; Galiero G; Crescitelli S(2000). Effect of a novel physical pretreatment process on the drying kinetics of seedless grapes. Journal of Food Engineering,46(2), 83–89. Miranda M; Maureira H; Rodriguez K; Vega-Ga´lvez A(2009).
Influence of temperature on the drying kinetics,
physicochemical properties, and antioxidant capacity of Aloe Vera (Aloe Barbadensis Miller) gel. Journal of Food
Engineering,91(2), 297–304.
Panchariya P C; Popovic D; Sharma A L(2002). Thin-layer modeling of black tea drying process. Journal of Food Engineering,52(4), 349–357.
Pangavhane D R; Sawhney R L(2002). Review of research and development work on solar dryers for grape drying. Energy Conversion and Management,43(1), 45–61.
Pangavhane D R; Sawhney R L; Sarsavadia P N(2000). Drying kinetics studies on single layer Thompson seedless grapes under controlled heated air conditions. Journal of Food Processing and Preservation,24(4), 335–352.
Park K J; Vohnikova Z; Brod F P(2002). Evaluation of drying parameters and desorption isotherms of garden mint leaves (Mentha crispa L.). Journal of Food Engineering,51(3), 193–199. Prakash S; Jha S K; Datta N(2004). Performance evaluation of
blanched carrots dried by three different driers. Journal of Food Engineering,62(3), 305–313.
Ramos I N; Silva C L M; Sereno A M; Aguilera J M(2004). Quantification of microstructural changes during first stage air drying of grape tissue. Journal of Food Engineering,62(2), 159–164.
Rizvi S S H(1986). Thermodynamic properties of foods in dehydration. In: Engineering Properties of Foods (Rao M A; Rizvi S S H eds). Marcel Dekker, New York, USA.
Seyedein S H; Hasan M; Mujumdar A S(1995). Turbulent flow and heat transfer from confined multiple impinging slot jet. Numerical Heat Transfer,27(1), 35–51.
Sharma G P; Prasad S; Chahar V K(2009). Moisture transport in garlic cloves undergoing microwave-convective drying. Food and Bioproducts Processing,87(1), 11–16.
Shi J L; Pan Z L; McHugh T H; Wood D; Hirschberg E; Olson D (2008). Drying and quality characteristics of fresh and sugar-infused blueberries dried with infrared radiation heating. LWT-Food Science and Technology,41(10), 1962–1972. Singh B; Gupta A K(2007). Mass transfer kinetics and
determination of effective diffusivity during convective dehydration of pre-osmosed carrot cubes. Journal of Food Engineering,79(2), 459–470.
Singh S; Raina C S; Bawa A S; Saxena D C(2006). Effect of pretreatments on drying and rehydration kinetics and color of sweet potato slices. Drying Technology,24(11), 1487–1494. Souraki B A; Mowla D(2008). Axial and radial moisture diffusivity
in cylindrical fresh green beans in a fluidized bed dryer with energy carrier: modeling with and without shrinkage. Journal of Food Engineering,88(1), 9–19.
Srikiatden J; Roberts J S(2006). Measuring moisture diffusivity of potato and carrot (core and cortex) during convective hot air and isothermal drying. Journal of Food Engineering,74(1), 143–152. Togrul I T; Pehlivan D(2003). Modelling of drying kinetics of
single apricot. Journal of Food Engineering,58(1), 23–32. Troncoso E; Pedreschi F(2007). Modeling of textural changes
during drying of potato slices. Journal of Food Engineering, 82(4), 577–584.
Xiao H W; Gao Z J; Lin H; Yang W X(2009). Air impingement drying characteristics and quality of carrot cubes. Journal of Food Process Engineering. doi:10.1111/j.1745–4530.2008.00314.x. Yang W X; Gao Z J; Tan H M; Yang Y; Chen Z; Xiao H W(2009).