MORPHOGENETIC VARIATION OF SHALLOT (Allium cepa L. Aggregatum Group)
Alfu Laila1, Endang Sulistyaningsih2, Arif Wibowo2
ABSTRACT
There are many shallot cultivars cultivated in Java with varying greatly morphological traits and yield. Morphological and yield variation indicate that there are genetic variation and varying in resistance to pest and disease. One of major disease that cause yield losses of shallot is Fusarium Basal Rot (FBR) caused by Fusarium oxysporum f. sp. cepae (Foc). The pathogen could cause yield losses of shallot in field up to 90%.
The number of sixteen shallot cultivars were collected and studied for determining polymorphisms of nuclear based on Random Amplified Polymorphism DNA (RAPD) and the morphological traits. Potted research was conducted at greenhouse from December to February 2012, in Department of Agriculture, Universitas Gadjah Mada (UGM), Yogyakarta. Four shallot cultivars were selected for study the response to Foc under biofertilizer application. They were Kuning, Trisula, Tiron, and Crok cultivars. The field experiment was carried out from June to August 2012 at the Agricultural Training, Research and Development Station (ATRD/KP4) in Kalitirto, Sleman, Yogyakarta. The research design was split plot 4 x4, with three replications. The plots consisted of shallot which cultivated in Foc inoculation, biofertilizer application, combination of Foc inoculation and biofertilizer application, and without any treatments. The subplot consisted of shallot cultivars. All data were statistically analyzed using the variance analysis. Standard error was tested to determine the significant differences among treatment means.
Similarity coefficient among shallot cultivars as revealed by UPGMA cluster analysis of RAPD markers generated to molecular dendogram. The similarity of genetic dendogram ranged from 0.85 to 0.66 and separated of cultivars into two groups. Based on morphological analysis, there were variations of all variable that tested. Mophological dendogram made possible to identify four group.
Fusarium Basal Rot (FBR) incidence caused by seedborne was 6.94%. Biofertilizer application could not decrease significantly FBR incidence but it could increase number of bulb per plant in Crok and Kuning cultivars. FBR incidence with 43.75% caused by Foc inoculation was significantly decreasing plant height, number of bulbs, diameter of bulbs, and length of bulbs. However, yield of shallot decreased significantly from 1.05
1 Mahasiswa Pascasarjana Agronomi Fakultas Pertanian UGM, Yogyakarta 2
kg/m2to 0.63 kg/m2 when the shallot plantation was inoculated by Foc. The shallot plantation was inoculated by Foc under biofertilizer application did not show significantly decreasing FBR incidence and increasing the yield. FBR incidence and yield of Trisula, Crok and Tiron cultivars did not show difference significantly from Kuning cultivar as susceptible to Foc.
Key words: cultivar, shallot, RAPD, Fusarium oxysporum f. sp. Cepae (Foc),
biofertilizer
INTRODUCTION
Shallot (Allium cepa L. Aggregatum Group) is a botanical variety
which produces aggregation of bulbs (Jones and Mann, 1963). In
Indonesia, consumers prefer shallot as bulb for the main seasoning
ingredients in food or culinary qualities. There are many shallot cultivars are
cultivated in Java with varying greatly morphological traits and yield
(Anonymous, 2011). Morphological and yield variation indicate that there are
genetic variation and varying in resistance to pest and disease.
Study of genetic resources based on morphological trait is essential
in plant breeding as it reveals important trait to plant breeders. However,
morphological trait does not always reflect real genetic trait because of
genetic and environment interaction. It possibly influences plant growth
and genes expression (Hartl et al., 1988).
Currently, molecular markers are considered the best tools in genetic
studies due to the possibility to differentiate at the DNA level. Random
amplified polymorphic DNA (RAPD) technique has been commonly used
because its simplicity, easy, low cost, requirement for only a small quantity
of DNA and the ability in generate numerous polymorphisms (Bardakci,
2001).
In this case, study of morphological and genetic variation is important
for conserving, evaluating, and utilizing genetic resources; and for studying
the diversity of pre-breeding and breeding germplasm. Study of genetic
variation is necessary for identifying diverse parental combination with high
MATERIAL AND METHODS
Fresh bulbs of sixteen different cultivars were collected. All cultivars
of shallot were cultivated in the greenhouse, Faculty of Agriculture, Gadjah
Mada University, Yogyakarta from December 2011 to February 2012. Two
plants per cultivar were collected were used for genetic analysis. Twenty
plants per cultivar were collected for morphological data.
0.2 g of young leaf materials were ground in 2% CTAB in a mortar,
and 1.5 ml 2% CTAB was added to each of the samples. The extracts of
samples were incubated at 65oC water bath for 30 minutes by shaking gently
every ten minutes. The samples were centrifuged for 5 min at 5,000 rpm in
pellet allowed to air dry until only slightly moist for an hour. It was added with
aqua bides ±20-30µl. Finally, it was store at 20oC.
Amplification was carried out using five primers. The primers
detail is shown in Table 1.
Table 1. Primers used for RAPD analysis
CMN-A45 5’-TGGCCTCTTGGA-3’
Arifin et al., 2000
CMN-A53 5’-GACGCCCATTAT-3’
OPA-1 5’-CAGGCCCTTC-3’ Phuong et al., 2006
OPA-11 5’-CAATCGCCGT-3’ Peredes et al., 2008
UBC-391 5’-GCGAACCTCG-3’ Asili, 2010
The reaction mixture (25µl) for PCR was composed with 12 µl PCR
kit, 0.5 primer DNA, 1 µl 20 ng template DNA, and 11 µl dW. The
preheating 4 minutes 95oC; forty two cycles denaturation 1 minutes 94oC,
annealing 1 minutes 37oC, extension 1.5 minutes 72oC, and final extension
7 minutes 72oC).
Eight µl of the reaction mixture was separated by electrophoresis on
1.2% agarose gel in Tris Base buffer (1x) at 80 volt for 60 minutes. The gel
electrophoresis was placed in ethidium bromide for 15 minutes and then the
gel was photographed above UV light. The electrophoresis gel was carried
out at least twice to obtain reproducible bands.
Polymorphic DNA fragments were scored as either present (1) or
absent (0). Only distinct and reproducible fragments were scored. Binary
matrix was used to estimate the genetic similarities between pairs, by
similarity matching coefficient. These similarity coefficients were used to
construct dendrogram using the unweighted pair group method with arithmetic
averages (UPGMA), through the NTSYS Version 2.1 (Microsoft windows
based Freeware for population Genetic Analysis) program.
The experiment was completely randomized design. The experiment
was involved one factor which was cultivar. The details of data recorded
consist of plant height, number of leaf per plant, leaf greenness, number of
tillages per plant, number of bulbs per plant, weight of bulb, diameter of bulb,
length of bulb, color scale, total soluble solids (TSS) content of bulb and
disease incidence.
Morphological clustering was used to construct morphological
dendogram using SAS 9.1 program. Analyses of variance (ANOVA) were
carried out for all variables to check the differences in their mean values
among the groups obtained from the clustering stage and complemented with
a Duncan’s Multiple Range Test would be tested to determine the significant
RESULT AND DISCUSSION
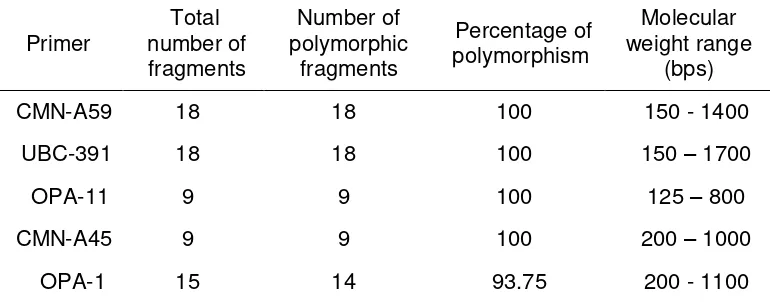
A total of 68 fragments were generated using five primers. The
number of polymorphic fragments varied from 9 to 18 in the size ranging
from 150 to 1700 bases pairs (bps). The five primers assessed were
polymorphic (Table 2).
Table 2. Details of RAPD analysis of 16 different cultivars of shallot
Primer
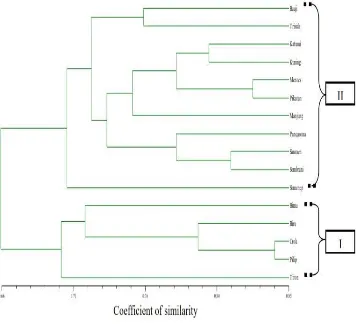
Figure 2.3 presented the molecular dendogram based on similarity
coefficient among shallot cultivars as revealed by UPGMA cluster analysis of
RAPD markers. The dendogram showed a clear separation into two groups.
The first group included a total of 5 cultivars. The second group clustered 11
cultivars.
Cluster 1 consisted of Bima, Crok, Tiron, Biru and Pilip cultivars. The
percentage of the similiarity ranged between 0.72 to 0.86. Bima cultivar is
local cultivar from Central Java whereas Crok, Tiron and Biru cultivars are
local from Yogyakarta. Pilip cultivar is introduction cultivar from Philipine
which is cultivated in Yogyakarta. Cluster 1 was clearly separated into
two sub group. Sub group 1 consist of Sumenep cultivar and the others
cultivars generated into sub group 2. In this case, Sumenep cultivar belongs
to Allium × wakegi Araki was clearly separated from group one into sub group
one.
Pikatan, Sanraen, Sembrani and Sumenep cultivars. Bauji and Manjung are
local cultivar from East Java whereas Bima and Kuning cultivars are local
cultivar from Central Java. Katumi and Sembrani cultivasr are hybrid
cultivar. Sanraen, Mentes, Pancasona, Pikatan and Trisula cultivars will
be released by Balitsa. The percentage of the similiarity ranged between
0.715 and 0.87.
RAPD analysis were conducted to establish the phylogenetic
relationship among collected accession in Indonesia by Arifin et al. (2000).
The research resulted that the grouping of shallot cultvars separated into two
main group.
Figure 2. Morphological dendogram based on quantitative traits of sixteen cultivars of shallot.
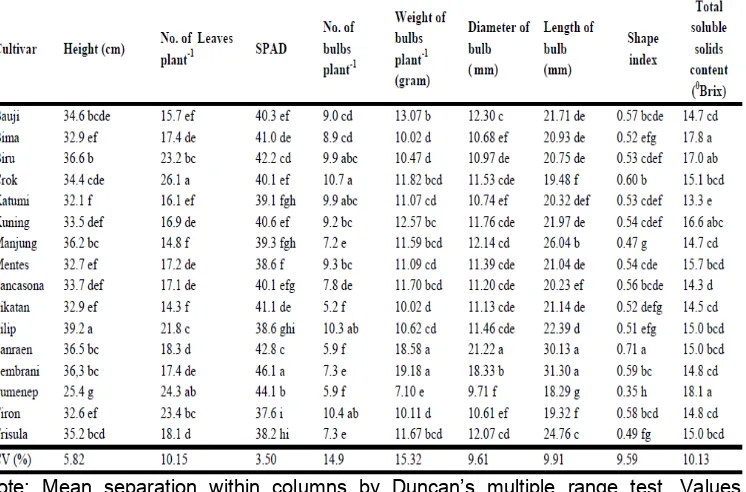
Analysis of variance for plant height, number of leaf, leaf grenness,
number of tillage, number of bulbs per plant, weight of bulbs per plant,
diameter of bulb, length of bulbs, total soluble solid content, skin and fleshy
color scale revealed significant difference among sixteen different shallot
cultivars (Table 2).
Figure 2 showed the morphological dendogram based on average
distance among cultivars. The dendogram made possible to identify four
up Sembrani and Sanraen cultivar. Third group was most characterized of
Trisula cultivar. The others cultivars were made up of fourth group.
Table 2. Morphological traits of sixteen shallot cultivars
Note: Mean separation within columns by Duncan’s multiple range test. Values followed by the same letter within columns did not show significant differences at 0.05 probability level
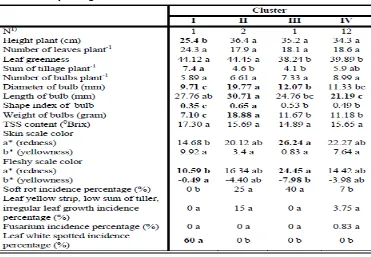
Table 3 was carried out for all variables to check the differences in
their mean values among the groups obtained from the clustering stage.
Group 1 was mostly characterized by the shortest plant height, the lightest
of bulb diameter, the lowest bulb shape index, the lightest weight of bulb,
the lowest both of redness and yellowness of fleshy color scale, and the
highest leaf white spot incidence. Group 2 showed the highest of bulb
diameter, bulb length, shape index and weight of bulb. Group 3 was formed
by medium bulb diameter, the highest of red direction skin color scale of bulb
and fleshy color scale and the lowest yellow direction of fleshy color scale of
bulb. It means Trisula cultivar is the most redness than the others. Group 4
Tabel 3. Morphological values for each cluster
Notes: Mean separation within rows by Duncan’s multiple range test. Values followed by the same letter within columns did not show significant differences at 0.05 probability level.1) Number of accessions per cluster
In this study, RAPD technique was succesfully utilized to determine
the genetic relationship among sixteen different cultivars. This research
tested five primers resulted in satisfactory amplification fragments with a
polymorphism rate of 93.75% - 100%. The variations in fragments pattern as
well as the total number of fragments amplified in different cultivars from 9 to
18 fragments. The size of fragments ranged from 150 to 1700 bases pairs
(bps). Similarity coefficient among shallot cultivars as revealed by UPGMA
cluster analysis of RAPD markers generated to molecular dendogram. The
similarity of genetic dendogram ranged from 0.85 to 0.66 and separated of
cultivars into two groups. First group consisted of Bima, Crok, Tiron, Biru and
Pilip cultivars. Second group was formed by Bauji, Trisula, Katumi, Kuning,
Mentes, Pikatan, Sanraen, Sembrani and Sumenep cultivars. RAPD analysis
accession in Indonesia by Arifin et al. (2000). The research resulted that the
grouping of shallot cultivars grown in Java separated into two main group.
Analysis of variance for plant height, number of leaves, leaf grenness,
number of tillage, number of bulbs per plant, weight of bulbs per plant,
diameter of bulb, length of bulbs, total soluble solid content, skin and fleshy
color scale revealed significant difference among sixteen different shallot
cultivars. Mophological dendogram made possible to identify four group.
Some of cultivars remained the same group in both genetic and
morphological dendogram. Biru, Crok, Pilip and Tiron cultivars were grouped
in first cluster of genetic dendogram which were reflected medium size bulb in
fourth cluster of morphological dendogram. Sanraen and Sembrani cultivars
were close similarity genetic which showed big size grouped in the
morphological dendogram. The grouping of shallot by RAPD analysis may
thus reflect part of the morphological traits of shallot. The other case, some
of cultivars remained the different between genetic and morphological
dendogram. There is possible reason. According to Hart et al. (1988),
morphological traits are influenced by environmental condition so it
showed considerable variation, due to unknown mechanism of genetic control
and great environmental effects in the process of trait expression. The result
reflected that morphological traits were not always reliable in estimating
genetic relationship among shallot cultivars. It should be use mainly
of genetic variation for discrimination.
Plant breeders often select hybridization targets with large differences
in morphological traits, rarely considering their genetic background.
Therefore, breeders often have to trying to get ideal traits due to some
hybridization combination distinct morphological differences and possible
share high genetic similarity in their genome. It is necessary for plant
CONCLUSION
1. There were genetic and morphological variation among sixteen different
shallot cultivar. Similarity of genetic dendogram among sixteen different
cultivars showed high variation ranging between 0.85 to 0.66 and
separated into two groups whereas mophological dendogram made
possible to identify four group.
2. Morphological traits were not always reliable in estimating genetic
relationship among sixteen different shallot cultivars. It should be use
mainly of genetic variation for discrimination.
REFERENCES
Anonymous. 2011. Pedoman Pemurnian Varietas Bawang Merah. Direktorat Perbenihan Hortikultura. Direktorat Jendral Hortikultura Kementrian Pertanian.
Arifin, N.S., Y. Ozaki, and H. Okubo. 2000. Genetic Diversity in Indonesian Shallot (Allium cepa var. Ascalonicum) and Allium × wakegi Revealed by RAPD markers and origin of A.× wakegi Identified by
RFLP Analyzes of Amplified Chloroplast Genes. Euphytica 111:
23-31.
Asili, Ali, J. Behravan, M. R. Naghavi, and J. Asili. 2010. Genetic diversity of persian shallot (Allium hirtifolium) ecotypes based on morphological traits, allicin content and RAPD markers. Open Access Journal of Medicinal and Aromatic Plants 1: 1-6.
Bardakci, F. 2001. Random amplified polymorphic DNA (RAPD) markers. Turkey Journal Biology 25 :185-196.
Hartl, D. L., D. Freifedler, and L. A. Snyder. 1988. Basic Genetics. Jones and Bartlett Publishers.
Jones, H.A and Mann, L. K. 1963. Onions and Their Allies. Botany, Cultivation and Utilization. Interscience Publishers, New York. Mallor, C., M. Carravedo, G. Estopañan1 and F. Mallor. 2011.
Characterization of Genetic Resources of Onion (Allium cepa L.) from The Spanish Secondary Centre of Diversity. Spanish Journal of Agricultural Research 9(1): 144-155.