Full Terms & Conditions of access and use can be found at
http://www.tandfonline.com/action/journalInformation?journalCode=cbie20
Download by: [Universitas Maritim Raja Ali Haji] Date: 18 January 2016, At: 19:41
Bulletin of Indonesian Economic Studies
ISSN: 0007-4918 (Print) 1472-7234 (Online) Journal homepage: http://www.tandfonline.com/loi/cbie20
The economics of pest and production
management in small-holder cocoa: lessons from
Sulawesi
Jessica Grace Perdew & Gerald E. Shively
To cite this article: Jessica Grace Perdew & Gerald E. Shively (2009) The economics of pest and production management in small-holder cocoa: lessons from Sulawesi, Bulletin of Indonesian Economic Studies, 45:3, 373-389, DOI: 10.1080/00074910903416288
To link to this article: http://dx.doi.org/10.1080/00074910903416288
Published online: 16 Nov 2009.
Submit your article to this journal
Article views: 135
View related articles
ISSN 0007-4918 print/ISSN 1472-7234 online/09/030373-17 © 2009 Indonesia Project ANU DOI: 10.1080/00074910903416288
THE ECONOMICS OF PEST AND PRODUCTION
MANAGEMENT IN SMALL-HOLDER COCOA:
LESSONS FROM SULAWESI
Jessica Grace Perdew Gerald E. Shively*
Kraft Foods Global Inc., Chicago IL Purdue University, West Lafayette IN
We examine pest control and production management methods used by farmers in Sulawesi to improve cocoa bean quality and increase income from cocoa. Strategies investigated include those directed at increasing the number and size of cocoa pods, those aimed at reducing hosts for pest transmission, two input-intensive approach-es, and the alternative of doing nothing beyond harvesting mature cocoa pods. Using 2005 production data from 600 cocoa farms, we identify factors correlated with adoption of each treatment and, controlling for treatment, isolate factors that infl uence cocoa yields. To study the conditional profi tability of input allocation, we
compare observed factor shares with profi t-maximising input levels and derive
les-sons for extension efforts. We conclude that the average increase in private returns arising from more intensive cocoa management appears suffi cient to compensate
for higher production costs, but that observed extension efforts have not been cor-related with higher profi ts among farmers in the sample.
INTRODUCTION
Cocoa trees thrive in tropical climates, and 90% of cocoa is produced by small-holders on farms less than fi ve hectares in size (ICCO 2008). Approximately 70% of
world cocoa supply comes from West Africa. During the 1990s Indonesia rapidly expanded production and is now the third-largest producer after Côte d’Ivoire and Ghana, producing slightly more than 400,000 tonnes in 2004–05. Of Indonesia’s cocoa, 70% – nearly one-tenth of the world’s supply – is grown in Sulawesi.
The development and potential long-term viability of Sulawesi’s cocoa sector has received considerable attention, beginning with the work of Jamal and Pomp (1993) and continuing with the more recent analyses of Neilson (2007) and Ruf and co-authors (for example, Ruf, Ehrut and Yoddang 1996; and Ruf and Yoddang
* Corresponding author: shivelyg@purdue.edu. We thank the editor and three anonymous
reviewers for substantial constructive comments on earlier versions of this paper. We have also benefi ted greatly from conversations with Smilja Lambert, Peter van Grinsvin, Josef
Toledano, Will Masters, John Mumford, Sally Thompson and Steve Yaninek. Financial sup-port for this research was provided by Mars Inc. and the United States Agency for In-ternational Development under the auspices of the Sustainable Agriculture and Natural Resource Management Collaborative Research Support Program (SANREM CRSP). The opinions expressed are those of the authors and do not necessarily refl ect the views of the
sponsoring agencies or Kraft Foods Global Inc.
1998, 2001, 2004). Shapiro and Rosenquist (2004) discuss the important and ongo-ing role of the private sector in facilitatongo-ing the sustainability of the cocoa indus-try, and Akiyama and Nishio (1997) describe the policy environment for cocoa in Sulawesi. Nearly all of these observers stress that one of the main threats faced by Indonesia’s cocoa farmers at present is infestation by a moth (Conopomorpha cramerella) known as the cocoa pod borer (CPB). CPB infestation in Indonesian cocoa was confi rmed in 1997 by Matlick (1998), and the industry estimates that
infestation in Sulawesi adversely affects up to 80% of cocoa farms (Neilson et al. 2005). If infestation occurs when the cocoa pod is ripe, near harvest, most of the beans in the pod remain unaffected. However, if infestation occurs when the pod is immature, its entire contents can be lost. Unfortunately it is often diffi cult to
detect the presence or severity of infestation.
Large production losses have serious implications for farmers, processors and manufacturers of chocolate.1 Industry observers estimate production losses due
to infestation in Sulawesi to be approximately $300 million annually (Shapiro et al. 2008). Furthermore, relatively little is known about the physiology of the CPB moth and how best to control it. CPB has now spread throughout the islands of Indonesia, and has recently appeared in Papua New Guinea (CABI 2006).
Despite industry arguments that there is a profi t incentive to control CPB and
other pests and diseases, infestation rates and yield losses remain signifi cant. This
pattern is widely blamed on lack of information, lack of training in control meth-ods, and problems with maintaining quality incentives along the supply chain. Accordingly, our analysis is motivated by an interest in how farmers differentially respond to perceived cocoa problems, depending on – among other things – the degree and method of their exposure to local extension services. We investigate three questions. First, given reported farm problems, what explains patterns of production practices, especially techniques to resolve or address cocoa produc-tion problems? Second, are the techniques farmers use to improve cocoa quality and reduce pest infestation working? And third, have cocoa extension services been associated with increased profi tability for farmers? Given the importance
of the CPB problem and the likely spread of CPB to other production locations in Southeast Asia, our goal is to generate fi ndings that will be relevant to farmers in
Sulawesi and in other locations in Indonesia and beyond.
FRAMEWORK
Our initial empirical aim is to identify factors correlated with choice of technique. We then ask whether the techniques chosen infl uence cocoa yields and profi
tabil-ity. Our underlying assumptions are that farmers are motivated by profi ts and can
respond to problems from a menu of available interventions. Individual choices will refl ect a range of resource constraints and expected outcomes. To measure the
likelihood of a particular response, we use a multinomial logit (MNL) model, a multiple outcome model in which outcomes are not ordered (Borooah 2001). Our MNL model measures the likelihood of a behavioural response given conditioning
1 Neilson (2007) argues that declines in quality are largely a problem for the domestic processing industry, since US and European grinders have found ways to adapt to low-quality beans.
factors such as household and farm characteristics. The response groups are formed such that one response is not found in any of the other response catego-ries. This model can be motivated by a framework in which one assumes that a decision maker will choose options that will maximise expected profi t (Greene
2000). Given that our focus is cocoa – a cash crop that has no subsistence value to the household – the assumption of profi t maximisation seems appropriate.
To formalise the model, we denote choices by θ, characteristics by x and prof-its by π. A farmer will choose option j over option k if prob
( )
πj >prob( )
πk ∀ ≠k j, that is, if the probability of profi t for option j is larger than the probability of profi tunder option k, for all values of k that are not equal to j. Following Greene (2000) and Gensch and Recker (1979), this MNL model for adoption can be written as:
prob j e
e i
x
x
j n
ij
ij (θ )
β
β
= =
∑
′
′
=1
, j=1 2, ,...n
where the equations provide an exhaustive set of probabilities for the plot-level responses in which one possible choice is compared to all others. In the empirical section we examine fi ve such categories of response for cocoa farmers. The results
from these regressions are of interest in their own right for what they reveal about patterns of behaviour. But we also employ the MNL model to provide a set of instrumenting regressions for our categories of response, retaining for subsequent analysis the predicted probabilities for each farmer-choice combination. Equipped with these predicted probabilities of response, we then estimate a set of cocoa yield regressions, subsequently incorporating the instrumented choice probabilities as control variables. We do this to explain observed yields in the sample, controlling for the latent characteristics of adopters. We ask whether, once one has controlled for farmer characteristics, extension exposure and the self-reported farm-specifi c
problems that precipitated behavioural responses, observed yields are correlated with available treatments and data on farmer exposure to project and extension efforts. Furthermore, since farmers are interested in profi ts and not just yields, we
investigate the profi t-maximising levels of inputs in the sample and assess the
possible impact of extension efforts on profi ts.
DATA
Study location and characteristics of cocoa farms
Our data come from Noling Village in Luwu district, 325 kilometres north of Makassar, the capital of South Sulawesi province. The island of Sulawesi is home to an estimated 400,000 cocoa-producing families. This site, occupying approxi-mately 12 square kilometres, was chosen because of the severity of its CPB infes-tation, and the involvement, beginning in 2003, of the Pest Reduction, Integrated Management (PRIMA) project aimed at educating and training farmers in pest control for cocoa.2 The site is divided into nine blocks based on natural borders
2 The PRIMA project is a joint initiative of Masterfoods Veghel BV and PSOM (Program of Cooperation with Emerging Markets), funded by the development cooperation budget of the Netherlands Ministry of Foreign Affairs.
and existing neighbourhoods. Eight blocks (A–H) are covered by the PRIMA project. The other block (I) lies outside the PRIMA project site and serves as a con-trol. Data on household characteristics, production and input use were collected for production year 2005.
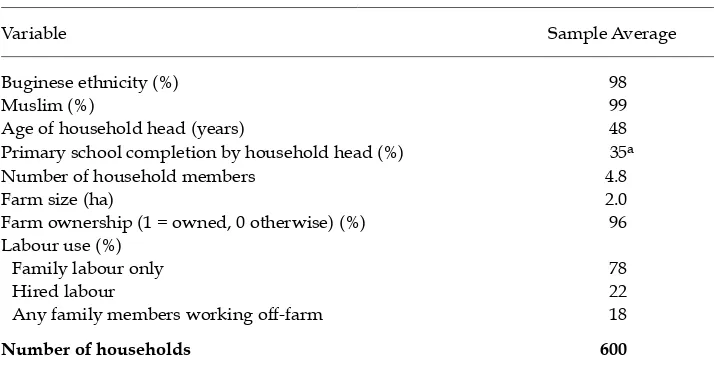
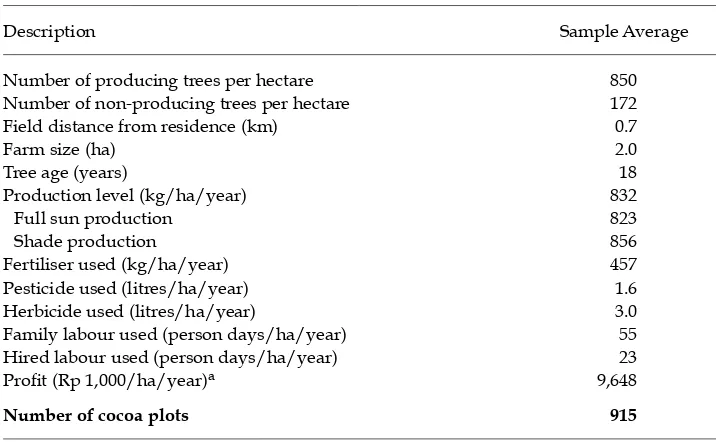
Descriptive data for 600 households and 915 cocoa fi elds are provided in
tables 1 and 2. All sample farmers grew cocoa on at least one fi eld.
Addition-ally, 269 farmers reported a second cocoa fi eld, 40 reported a third fi eld and six
reported a fourth. The average size of the primary cocoa fi eld was 1.16 hectares.
The additional fi elds were somewhat smaller on average. Land tenure in the area,
despite being insecure de jure for a range of historical reasons, is considered secure
de facto by most farmers: 96% of the sample reported fi eld ‘ownership’, which
in this case refl ects a perceived right to farm the land. Average total farm size is
slightly less than two hectares, and most households (78%) manage their own farms without the use of hired labour. The sample consists almost exclusively of Buginese, a group widely known for cocoa production (Li 2002).
A one-hectare cocoa fi eld can accommodate 800–1,000 trees with 3m x 3m
spac-ing. We fi nd fairly uniform spacing in our sample. Non-producing or dead trees
account for 20% of all trees, on average.3 The average tree age in the sample is
18 years, and the average production level is 832 kg/ha.4 Purchased input use is
3 Sample farmers do not seem to be replacing unproductive trees at a high rate: data indi-cate one new tree is planted for every two trees that are deemed unproductive.
4 Estimated coeffi cients from a regression of yield on age and age squared suggest that
cocoa production in the sample appears to peak at a tree age of approximately 22 years. Although cocoa trees can remain productive for much longer than this under ideal condi-tions, old trees are not typical in the growing area.
TABLE 1 Characteristics of Cocoa-growing Households in the Sample
Variable Sample Average
Buginese ethnicity (%) 98
Muslim (%) 99
Age of household head (years) 48
Primary school completion by household head (%) 35a
Number of household members 4.8
Farm size (ha) 2.0
Farm ownership (1 = owned, 0 otherwise) (%) 96 Labour use (%)
Family labour only 78
Hired labour 22
Any family members working off-farm 18
Number of households 600
a The most frequently reported educational attainment was ‘primary school attendance but not
com-pletion’.
Source: The source for all tables is the authors’ survey data.
ubiquitous in the sample and we observe relatively frequent use of hired labour, including occasional outside management of a family’s cocoa plots.5 Cocoa
farm-ers harvest pods throughout the year, but two harvest periods predominate: a main crop from mid-October through November and a mid crop from late April through June. The average pod carries 40–60 beans, and each bean contains approximately one gram dry weight (2.6 grams if wet). Farmers dry beans for roughly two days before selling them to a local trader, a collection centre or up-country buying station, or an input supplier.6
The majority of farmers in the sample depend heavily on income from cocoa for their livelihoods. On average, 69% of the total household income of survey respondents comes from the sale of cocoa beans; a number of farmers in the sam-ple also grow coconut, rice, cloves and local fruits for cash. The majority of house-holds rely on family labour; 22% of househouse-holds hire labour. Over 80% of sample farms own sprayers for the application of pesticide, fertiliser or herbicide. Tools
5 The use of outside management is a potential complicating factor in the analysis, but we observe relatively few instances in which the family relinquishes complete oversight of the farm to an outside party. Instead, the use of contracted spraying and fertilising seems to be the most regular form of outside management. We cannot reject the hypothesis that average yield and average profi t are equivalent on contractor-managed and owner-managed plots,
although we recognise that this may be due to the relatively small number of contractor-managed plots in the sample.
6 In general, Indonesian cocoa farmers do not ferment cocoa beans, because the beans are valued mainly for butter content, which is unaffected by fermentation (Neilson 2007).
TABLE 2 Characteristics of Cocoa Production among Sample Farms
Description Sample Average
Number of producing trees per hectare 850
Number of non-producing trees per hectare 172
Field distance from residence (km) 0.7
Farm size (ha) 2.0
Tree age (years) 18
Production level (kg/ha/year) 832
Full sun production 823
Shade production 856
Fertiliser used (kg/ha/year) 457
Pesticide used (litres/ha/year) 1.6
Herbicide used (litres/ha/year) 3.0
Family labour used (person days/ha/year) 55
Hired labour used (person days/ha/year) 23
Profi t (Rp 1,000/ha/year)a 9,648
Number of cocoa plots 915
a During the survey year (2005) the average rupiah/dollar exchange rate was 9,721, with a low of
10,802 and a high of 9,064. For computation of profi t, we impute the cost of family labour using the
market wage.
needed for cocoa production include pruning shears, harvesting poles with sharp hooks, and machetes for opening cocoa pods. The majority of the sample, 73%, reported having one or more of these agricultural tools.
Factors affecting cocoa production and farmer behaviour
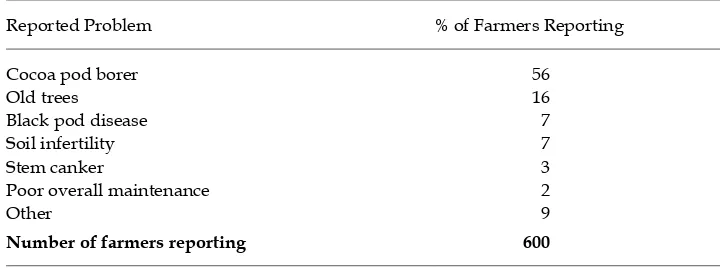
Our survey data identifi ed factors perceived to limit income generation from cocoa
production. Survey participants were asked to rank problems adversely affect-ing cocoa production and quality. Farmers with multiple fi elds provided separate
rankings for each fi eld. Farmers reported 23 distinct production problems,
rang-ing from pests and diseases to agerang-ing trees, poor soil fertility and rodent damage. Table 3 lists the primary problems most frequently reported in the sample. More than half of all farmers perceived CPB as their primary cocoa-related problem.
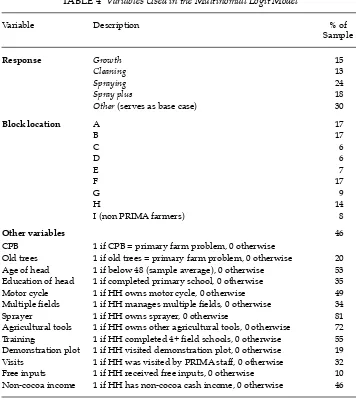
The dependent variable for the MNL model is derived from a survey question about the farmer’s reported fi eld-level response to the perceived primary problem
limiting cocoa profi tability on that fi eld. Using both pre-determined categories
and an open-ended format, the survey recorded 51 different responses, many of them thematically related. For the purposes of the MNL model, these 51 responses were grouped into one of fi ve categories: (1) growth (applied to 15% of fi elds, and
requiring, on average, 70 annual person days of labour per hectare), that is, tech-niques to promote the growth of healthy trees, including use of fertiliser, grafting and tree rehabilitation; (2) cleaning (13%, 74 days), comprised of techniques to promote a sanitised fi eld, including pruning, sanitation and spraying (as a
com-bined effort), removing and burying infested pod husks, raking excess leaf litter and removing infested pods; (3) spraying (24%, 90 days), identifi ed as the use of
pesticides with no other strategy or technique; and (4) spray plus (18%, 94 days), the most labour-intensive response, which includes spraying pesticide in combi-nation with use of fertiliser, pruning and/or regeneration practices. The fi nal
cat-egory, (5) other (30%, 61 days) includes no specifi c action, or a technique that was
idiosyncratic and not easily categorised; of the responses categorised in ‘other’, 73% correspond to no course of action.
The independent variables used in the MNL model are defi ned in table 4. The fi nal column of the table provides each variable’s frequency in the sample (as
a percentage). Binary location variables (A, B … I) are included to control for unobservable block-specifi c factors and network effects. Key variables identifying
reported problems are used to control for the likelihood of correlation between a TABLE 3 Main Cocoa-growing Problems Reported by Sample Farmers
Reported Problem % of Farmers Reporting
Cocoa podborer 56
Old trees 16
Black pod disease 7
Soil infertility 7
Stem canker 3
Poor overall maintenance 2
Other 9
Number of farmers reporting 600
particular response and an identifi ed problem. Household characteristics,
includ-ing asset variables, are included to account for household-specifi c factors in the
behavioural responses. Finally, we include several project-related variables (for example, training) to assess the impact of the PRIMA project on farmer behav-iour and outcomes. The PRIMA project trained farmers primarily in methods to improve productivity and bean quality. These methods included frequent har-vesting, pruning, sanitation and fertilisation. In addition, PRIMA maintained eight demonstration plots to disseminate alternative farming techniques to farmer groups and leaders. One of the issues we explore below is whether exposure to the PRIMA project conferred benefi ts on farmers within the project catchment.7
7 For additional information about the PRIMA project, see Neilson et al. (2005).
TABLE 4 Variables Used in the Multinomial Logit Model
Variable Description % of
Sample
Response Growth 15
Cleaning 13
Spraying 24
Spray plus 18
Other (serves as base case) 30
Block location A 17
B 17
C 6
D 6
E 7
F 17
G 9
H 14
I (non PRIMA farmers) 8
Other variables
CPB 1 if CPB = primary farm problem, 0 otherwise
46
Old trees 1 if old trees=primary farm problem, 0 otherwise 20 Age of head 1 if below 48 (sample average), 0 otherwise 53 Education of head 1 if completed primary school, 0 otherwise 35 Motor cycle 1 if HH owns motor cycle, 0 otherwise 49 Multiple fi elds 1 if HH manages multiple fi elds, 0 otherwise 34
Sprayer 1 if HH owns sprayer, 0 otherwise 81
Agricultural tools 1 if HH owns other agricultural tools, 0 otherwise 72 Training 1 if HH completed 4+ fi eld schools, 0 otherwise 55
Demonstration plot 1 if HH visited demonstration plot, 0 otherwise 19 Visits 1 if HH was visited by PRIMA staff, 0 otherwise 32 Free inputs 1 if HH received free inputs, 0 otherwise 10 Non-cocoa income 1 if HH has non-cocoa cash income, 0 otherwise 46
a HH = household.
RESULTS
Behavioural responses to cocoa problems
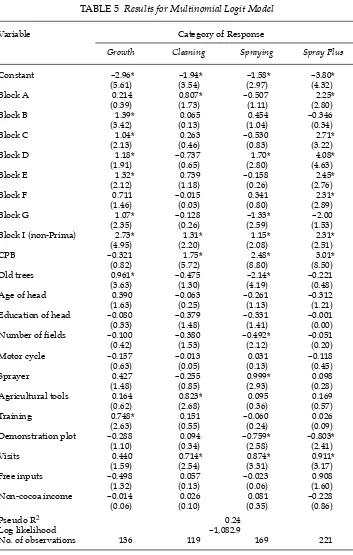
Results from the MNL regressions are presented in table 5. Results are listed for each of four response categories: growth, cleaning, spraying and spray plus. The fi fth
response category, other (in 73% of cases amounting to doing nothing other than harvesting), is the base case. All statistical results are interpreted in comparison to this response.
Looking across all columns of table 5, we fi nd a scattering of relatively strong
block effects. Observations are grouped into nine blocks, and all coeffi cients can
be interpreted relative to block H. Non-signifi cant coeffi cients can be considered
to be zero (i.e. no different from block H). Location-specifi c coeffi cients are
statis-tically signifi cant in 17 of 32 cases. Although we cannot observe the factors
cor-related with these spatial differences, in all likelihood they refl ect differences in
soil conditions, pest or disease spillovers, and network effects among households in particular blocks. Patterns suggest that, overall, farmers in the non-PRIMA area (block I) tended to respond to problems at a higher rate than farmers in the PRIMA blocks, the non-PRIMA block being the only group for which the response
coef-fi cient is positive and signifi cant across all four response categories. Moreover, for
almost all responses except those in the spray plus category, the non-PRIMA block has a higher coeffi cient than the PRIMA blocks. The sole exception is spraying in
block D. Overall, therefore, we conclude that PRIMA farmers were less likely than their cohorts in the non-PRIMA block to undertake activities aimed at promoting cocoa tree growth, or to carry out cleaning or spraying. This is somewhat surpris-ing, since the extension services were intended precisely to encourage farming practices of this kind. Below, we explore this point further in the context of yields and profi tability.
Focusing attention on the CPB variable, we see that if CPB was identifi ed as
the primary cocoa problem, farmers were more likely, on average, to respond through cleaning, spraying or spray plus activities. In contrast, when old trees were perceived by farmers to be the primary limiting factor in production, a farmer was more likely to respond with growth-enhancing interventions and was far less likely to spray. Farmers with multiple fi elds were less likely to spray,
per-haps indicating labour constraints for this time-intensive activity among farmers managing multiple fi elds. Ownership of a back-pack sprayer is positively
corre-lated with spraying, as expected, but not with other activities. Ownership of other agricultural tools (including, but not limited to, knives and cutting and trimming tools) is correlated with a higher proportion of responses in the cleaning category. In short, we fi nd, not surprisingly, that farmers’ responses are closely correlated
with what they perceive to be their major problems, and with their ownership of particular kinds of equipment.
Four explanatory variables in the MNL model (training, demonstration plot, free inputs and visits) are related to specifi c aspects of the PRIMA project. Several
interesting patterns emerge with respect to these variables. First, we fi nd that those
farmers who attended four or more of the eight farmer fi eld school (FFS) training
sessions were more likely to adopt growth-oriented interventions than to do noth-ing. This is not surprising, given that many of the fi eld school sessions focused on
promoting technologies to enhance the growth of cocoa trees and increase yields (for example, side grafting, tree rehabilitation and regeneration, and pruning).
TABLE 5 Results for Multinomial Logit Model
No. of observations 136 119 169 221
a Omitted response category is ‘Other’ (n= 270) and includes ‘no response’. Absolute values of t-statistics are in parentheses. An asterisk (*) indicates that the estimated coeffi cient is signifi cantly different from zero at the 90% confi dence level or greater.
Participation in FFS training had no obvious correlation with other behavioural responses in the sample. Farmers who had participated in fi eld visits to PRIMA
demonstration plots were less likely to respond to problems with spraying or spray plus activities. In part, this may refl ect the role of demonstration plots in
pro-viding farmers with better information to help them identify pest and disease problems, and thereby avoid unnecessary use of chemical inputs. An alternative explanation is that farmers with an enhanced ability to identify pest and disease problems would also be able to use chemicals in a more focused and informed attempt to overcome those problems. Training at the demonstration plots did not necessarily discourage pesticide use, but rather encouraged proper, prudent and safe use of agricultural chemicals. Those who reported being frequently visited by PRIMA staff were more likely to adopt active responses other than growth-oriented activities (which were addressed in the FFS setting). Such one-on-one contact with project staff raised the likelihood of response above that for farmers who did not receive frequent visits. We can see no obvious explanation, however, for the curious result that the signs on the coeffi cients for spraying and spray plus
are negative in relation to visits by farmers to demonstration plots but positive in relation to visits to farmers by PRIMA staff. Finally, somewhat surprisingly, farm-ers who reported having received some of their inputs free of charge from the PRIMA project did not display higher rates of response in any category.
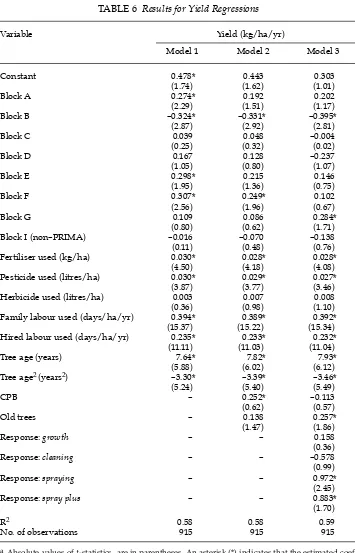
Cocoa yields
We now turn to a set of three Cobb–Douglas production functions to identify fac-tors correlated with yields. The results are reported in table 6. Where appropriate, independent variables have been scaled to per-hectare amounts. Models are esti-mated in log–log form. Model 1 is a short regression that includes location vari-ables and input levels; model 2 adds indicators for farmers’ self-reported cocoa problems; and model 3 includes the predicted probabilities for each response cat-egory. To repeat, after estimating the MNL model, we generated these predicted probabilities for each farmer–response combination. For each fi eld these predicted
probabilities sum to one and provide in-sample predictions of adoption for each response.8
Model 1 focuses attention on the infl uence of location, physical input use and
tree age on yield. We fi nd a small number of block-specifi c differences in yield.
Importantly, despite the fact that the MNL model indicated generally higher response activity in the non-PRIMA area, evidence that farms outside the PRIMA project site have signifi cantly different yields from those within the project site is
generally weak and mixed. For example, a simple comparison of outcomes inside and outside the PRIMA project site suggests differences in cocoa yields; the mean yield within the project area (836 kg/ha/yr) exceeds the mean outside the project
8 Viewed in terms of a two-stage least squares (2SLS) regression, the four PRIMA project variables included in the MNL regression serve in conjunction with the farmer characteris-tic variables (age and education) to identify the response variables for inclusion in the yield regressions. We have assumed that the infl uence of the project on outcomes worked solely
through the indirect pathway of infl uencing choice of response, and had no direct impact
on yields. Test results for endogeneity and over-identifi cation restrictions are not reported
here, but are available upon request.
TABLE 6 Results for Yield Regressions
Block I (non–PRIMA) –0.016 –0.070 –0.138
(0.11) (0.48) (0.76)
Fertiliser used (kg/ha) 0.030* 0.028* 0.028*
(4.50) (4.18) (4.08)
Tree age (years) 7.64* 7.82* 7.93*
(5.88) (6.02) (6.12)
Response: growth – – 0.158
(0.36)
Response: cleaning – – –0.578
(0.99)
Response: spraying – – 0.972*
(2.45)
Response: spray plus – – 0.883*
(1.70)
R2 0.58 0.58 0.59
No. of observations 915 915 915
a Absolute values of t-statistics are in parentheses. An asterisk (*) indicates that the estimated coef-fi cient is signifi cantly different from zero at the 90% confi dence level or greater. Plot-level yields are
measured in natural log of kilograms per hectare per annum.
area (733 kg/ha/yr). However, a two-sample t-test (t = 1.40) fails to support the hypothesis that yields are statistically different at standard test levels. Yield dif-ferences appear to be limited to block-by-block patterns. Block comparisons based on the estimated coeffi cients for the models reported in table 6 suggest that yields
in three blocks (A, E and F) tended to be higher than those in the reference block (H), and yields observed in one block (B) were lower. Yields in the non-PRIMA block (G), did not differ from those in the reference block (H).
Input–output relationships follow the expected patterns, with all inputs posi-tively correlated with yield, and all correlations (with the exception of herbicides) statistically signifi cant.9 Family and hired labour are both important inputs, with
comparable – and statistically indistinguishable – impacts on yield, on average. Our measure of tree age indicates a positive correlation between age and yield, at least up to the peak production age of approximately 22 years (see footnote 4).
For model 2 we add to model 1 binary variables for the top two cocoa problems identifi ed by respondents: CPB and old trees. The results from model 1 are robust
to the inclusion of these variables, with relatively little change in magnitude or statistical signifi cance across the regressions. Although a substantial percentage
of the sample farmers perceive old trees to be their primary on-farm problem, model 2 provides no empirical support for the view that farmers who identify old trees as a primary problem have below-average production levels. Despite farmers’ perceptions, those who report old trees as a problem tend to have higher yields, on average, than those who do not, although the coeffi cient is not
statisti-cally signifi cant.10 One important and curious result from model 2 is the fact that
the estimated coeffi cient for CPB is positive and signifi cant. On the face of it, this
suggests that the presence of CPB results in higher yields, which is highly implau-sible. We believe the explanation for this pattern is that farmers who recognise CPB problems are responding to the risk of infestation in appropriate and effec-tive ways, while those who fail to perceive and act on this problem suffer lower yields as a result.
Evidence in support of this conjecture can be found in the results from model 3, which adds to model 2 the instrumented probabilities of farmer response. Again, the basic patterns in the yield regression remain robust to the inclusion of these variables. Two important exceptions emerge, however. First, the coeffi cient on
the ‘old tree’ variable increases in magnitude and becomes signifi cant, indicating
9 As an anonymous reviewer pointed out, the positive association of pest infestation with yields is probably due to the fact that farmers with pests are responding to the problem ef-fectively. On the other hand, in separate regressions not reported here we fi nd a relatively
weak correlation between herbicide use and profi ts. This may or may not be evidence that
herbicide use is unprofi table, as the weak correlation may be attributable to the fact that
herbicides are used in response to severe weed infestations. In the absence of a measure of weed infestation, herbicide use can be a proxy for the intensity of weed infestation. Therefore it should not immediately be concluded that herbicides have no effect on yields or profi tability.
10 Given that the average tree age is 18 years, which is less than the 22-year optimum (see footnote 4), our results do confi rm that farmers with trees older than 22 years obtain less
than optimum yields, as do those with younger trees. Nevertheless, those who own the older trees face a problem of declining yields and are therefore justifi ed in their concern,
whereas those who own younger trees will not face this problem for some time.
that, controlling for farmer behavioural response, those who perceive that their problem rests with the age of their trees are actually performing better than aver-age. This suggests that these farmers may be under-estimating the yield advan-tage associated with having mature trees. Second, the correlation between CPB and yield becomes insignifi cant when we include a farmer’s response
informa-tion. This provides evidence that model 2 probably over-estimates the importance of perceived problems, owing to the omission of the behavioural responses, which we include in model 3. Most importantly, the responses that are most highly and signifi cantly correlated with cocoa yield are the most intensive practices associated
with spraying. On average, if we control for location, input use and cited prob-lems, farmers who engage in these practices report above-average yields. Spraying
appears to provide a slightly greater yield advantage than spray plus, although a hypothesis that the estimated coeffi cients are the same cannot be rejected.
Over-all, these results suggest that, on average, farmer interventions through spraying seem to be compensating for CPB infestation. Although many farmers perceive their problem to be old trees, there is no evidence that the yields of this group of farmers are signifi cantly different from the sample average.
Cocoa profi tability
What matters to the farmer is profi t. Therefore, to augment the results of the yield
regressions, we now examine cocoa profi tability in the sample. The most basic
comparisons, based on a set of two-sample t-tests for differences in annual cocoa profi ts per hectare, indicate statistically similar profi ts inside and outside the
PRIMA project sites (Rp 9.6 million vs Rp 10.1 million; t = 0.94); somewhat higher (but again statistically similar) profi ts among those who received project training
than among those who did not (Rp 12.0 million vs Rp 9.5 million; t = 1.20); and signifi cantly higher profi ts among those who reported contact with PRIMA staff
(Rp 13.0 million vs Rp 8.8 million; t = 3.93). Taken together, these results provide only modest support for the conjecture that extension efforts were correlated with higher cocoa profi ts.
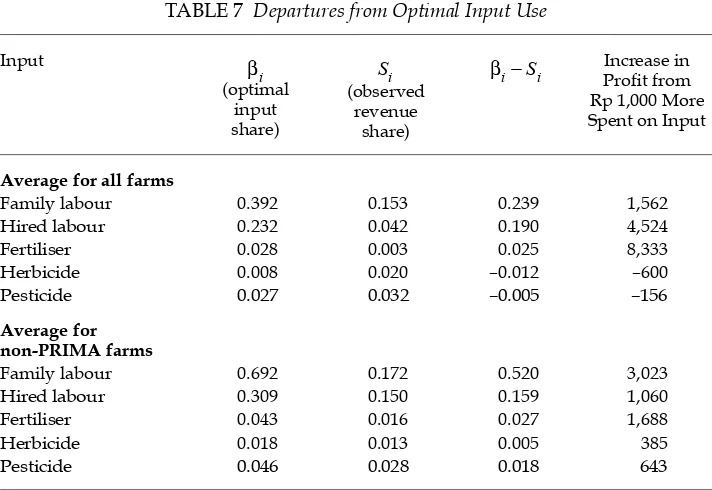
One simple way to assess whether farmers’ observed levels of profi tability
refl ect optimising behaviour, in the context of a Cobb–Douglas production
func-tion, is to compare observed factor shares with profi t-maximising factor shares,
where the latter can be derived from the yield regression equation, recognising that the fi rst-order necessary condition for profi t maximisation requires the marginal
value product of each input to equal its marginal cost. So, for example, if we let
βi represent the coeffi cient on the ith input and let Si represent this input’s share
in the value of production – that is, the ratio of payments to this input divided by total revenue from sales – profi t maximisation simply requires that β
i=Si.11
Furthermore, (βi−Si) is equal to the potential increase in profi ts, expressed as a
percentage of the total revenue from sales, that would accompany a 1% increase in the use of input i.
To measure these differences, we work with our preferred yield regression (model 3 in table 6) and employ the estimated production function coeffi cients in
11 Let π be profi t, Y output, P the price of output, X
i the quantity used of input i and Wi the price of input i. Then ∂ ∂π/ Xi=P Y∂ /∂ −Xi Wi. Therefore ⎡⎣∂π/PY⎤⎦ ⎡⎣/ ∂Xi/Xi⎤⎦=βi−W Xi i/PY.
conjunction with sample-average values for input levels, cocoa revenue and input and output prices, valuing household labour at the market wage. Our computa-tions are presented in table 7, where we also show the estimated potential increase in profi t that could be obtained by increasing spending on each input by Rp 1,000.
We present results both for the sample average and for non-PRIMA farmers spe-cifi cally. The results indicate that, at the sample average for all farms (the top
panel of table 7), optimal input shares (measured by βi) for herbicides and pes-ticides are less than the observed revenue shares (measured by Si), indicating over-use of these inputs. For labour, the results indicate that farmers are using signifi cantly less than the optimal amounts of both family and hired labour.
How-ever, it is important to keep in mind that we impute the value of family labour using the market wage, and hence the estimated value of revenue share for family labour depends on the arbitrary assumption that its opportunity cost is the same as the cost of hired labour. If one sums across all factor-specifi c revenue shares, we fi nd that approximately 25% of annual cocoa revenues are being paid to the
non-land, non-tree factors of production; in other words, 75% of the revenue accrues to the owners of the fi xed factors – land and trees – over and above the assumed
opportunity cost of family labour.12
Focusing on the sub-group of non-PRIMA farmers alone (the lower panel of table 7), we fi nd that approximately 38% of annual cocoa revenues are being paid
to the non-land, non-tree factors of production and the remaining 62% accrue to the owners of the fi xed factors, land and trees. In other words, farmers in the
12 Of course if the assumed opportunity cost of labour were higher, the apparent profi t
forgone would be correspondingly lower.
TABLE 7 Departures from Optimal Input Use
Input β
i
(optimal input share)
Si (observed
revenue share)
βi−Si ProIncrease in fi t from
Rp 1,000 More Spent on Input
Average for all farms
Family labour 0.392 0.153 0.239 1,562
Hired labour 0.232 0.042 0.190 4,524
Fertiliser 0.028 0.003 0.025 8,333
Herbicide 0.008 0.020 –0.012 –600
Pesticide 0.027 0.032 –0.005 –156
Average for non-PRIMA farms
Family labour 0.692 0.172 0.520 3,023
Hired labour 0.309 0.150 0.159 1,060
Fertiliser 0.043 0.016 0.027 1,688
Herbicide 0.018 0.013 0.005 385
Pesticide 0.046 0.028 0.018 643
PRIMA blocks appear to be enjoying somewhat higher returns to land and trees. Outside the PRIMA site, the potential returns to all inputs are positive.
CONCLUSIONS AND POLICY IMPLICATIONS
Our analysis reveals that the behavioural responses of cocoa farmers to per-ceived production problems in Sulawesi can be traced to a range of observable factors, including location, identifi ed problems, ownership of specifi c assets,
and access to information (including extension project resources). Signifi cant
positive yield differentials are associated with adopting responses in two of the four categories studied here (spraying and spray plus). Evidence suggests that spraying is a profi table response, even though it is a relatively labour-intensive
management strategy and involves a large set of environmental and farmer health concerns that we cannot address directly in the context of this paper. Approximately 42% of the sample adopted a spraying strategy of some kind. This shows that a large proportion of farmers in the sample are actively engaged in efforts to manage CPB and other production problems, and are managing them in a profi table way.
From a policy perspective, farm profi tability is a key consideration. From an
extension viewpoint, providing guidelines for optimising input use seems impor-tant. Our analysis of profi tability sheds light on both issues and suggests that, for
the average farmer in the sample, modest gains in profi t could be realised through
greater use of fertiliser, and of both household and hired labour. Some evidence suggests that there is modest over-use of pesticides and herbicides from an eco-nomic perspective, at least within the larger sub-sample of PRIMA farms.
Results from the MNL model suggest a pathway by which improved produc-tion practices could be achieved: the number of visits from project staff is posi-tively correlated with adoption of CPB control treatments. Moreover, farmers who communicated with project staff had signifi cantly higher profi ts per hectare than
those who did not. We believe from this evidence that extension efforts may be an effective way of addressing the needs of farmers and reducing CPB-related losses. However, we fi nd no strong evidence that average profi ts within the project area
were signifi cantly higher than profi ts outside the project area. Moreover, the
non-PRIMA farms exhibit stronger responses in three categories of activity. Given that the PRIMA and non-PRIMA groups are equally profi table, on average, this
evi-dence suggests that extension services are probably not being targeted in a way that is increasing profi tability (unless, of course, one’s counter-factual belief is that
farmers in the PRIMA blocks were far worse off than those outside the PRIMA area before the project, an assertion that we cannot test).
If new and existing demonstration plots focus on ways to reduce CPB infesta-tion, analysis of progress and effectiveness should also be disseminated to farm-ers. However, moderately strong location effects uncovered in the adoption and yield regressions indicate that the effectiveness of treatments may be site specifi c.
While our data do not allow us to identify these site-specifi c features of the
land-scape, the latter probably include soil and micro-climate conditions and localised pest and disease pressures. This spatial fi nding implies that multi-location testing
and fl exible tailoring of treatment recommendations to specifi c sites may enhance
both technology adoption and outcomes. It also indicates that successful control
and dissemination strategies might be based on identifying relatively successful farmers to serve as leaders in extension and education efforts. We also point out that the overall variance of adoption outcomes cannot be completely explained by our regressions. The location specifi city of treatment effi cacy and the variability in
farmer response suggest that a more nuanced analysis, taking into account farm-ers’ risk attitudes and cash constraints, may be of value.
An overall policy implication that arises from this analysis is that extension visits appear to facilitate adoption of effective pest management strategies. How-ever, we cannot conclude that these efforts have translated into appreciably higher on-farm profi tability. For this reason, we believe that extension efforts should be
examined closely. A case could be made for examining the benefi ts and costs of
increased investment in delivery of extension services to cocoa farmers, espe-cially because our results do not reveal measurable differences in outcomes inside and outside the extension project site. Such a benefi t–cost analysis has not been
undertaken here, because it requires quantifying all of the benefi ts arising from
extension, including the potential gains in adoption arising from extension, and comparing them with the budgetary costs of delivering those interventions, costs that we do not observe. If undertaken, such an analysis should also account for any potential spatial or temporal spillover effects of improved pest management. Finally, although the sample studied here is probably broadly similar to farmer populations in other cocoa-growing areas of Sulawesi, we make no strong claims to the sample’s representativeness of all cocoa-producing regions of the country. Given the importance of the cocoa sector to Indonesia, expanded analysis along geographic and thematic lines seems warranted.
REFERENCES
Akiyama, T. and Nishio, A. (1997) ‘Sulawesi’s cocoa boom: lessons of smallholder dyna-mism and a hands-off policy’, Bulletin of Indonesian Economic Studies 33 (2): 97–121. Borooah, V.K. (2001) Logit and Probit: Ordered and Multinomial Models, Sage University Paper
Series on Quantitative Application in the Social Sciences, 07-138, Sage, Thousand Oaks CA.
CABI (CAB International) (2006) ‘Confronting the threat of cocoa pod borer to cocoa in Papua New Guinea: project brief’, available at <http://cocoa-association-asia.org/ PNGCocoaProject.pdf>.
Gensch, D.H. and Recker, W.W. (1979) ‘The multinomial, multiattribute logit choice model’, Journal of Marketing Research 16 (1): 124–32.
Greene, W.H. (2000) Econometric Analysis, Prentice-Hall, Inc., Upper Saddle River NJ. ICCO (International Cocoa Organization) (2008) Cocoa economy production statistics,
accessed 4 July 2008 at <http://www.icco.org/economics/promotion.aspx>.
Jamal, S. and Pomp, M. (1993) ‘Smallholder adoption of tree crops: a case study of cocoa in Sulawesi’, Bulletin of Indonesian Economic Studies 29 (3): 69–94.
Li, T.M. (2002) ‘Local histories, global markets: cocoa and class in upland Sulawesi’, Devel-opment and Change 33 (3): 415–37.
Matlick, B.K. (1998) Machete technology? What small farmers need! Paper presented at the First International Workshop on Sustainable Cocoa Growing, Smithsonian Migratory Bird Center, Panama City, 30 March – 2 April 1998, available at <http://www.si.edu/ smbc/matlick.htm>.
Neilson, J. (2007) ‘Global markets, farmers and the state: sustaining profi ts in the
Indo-nesian cocoa sector’, Bulletin of Indonesian Economic Studies 43 (2): 227–50.
Neilson, J., Gusli, S., Palinrungi, R. and Sau, A. (2005) ‘Integrating smallholder cocoa farm-ers within quality-driven supply chains: learning from the PRIMA project’, Report submitted to the PENSA (Program for Eastern Indonesia SME Assistance) offi ce of the
International Finance Corporation (IFC), Makassar, May.
Ruf, F., Ehrut, P. and Yoddang (1996) ‘Smallholder cocoa in Indonesia: why a boom in Sulawesi?’, in Cocoa Pioneer Fronts since 1800: The Role of Smallholders, Planters and Mer-chants, ed. W.G. Clarence-Smith, Macmillan, London: 212–31.
Ruf, F. and Yoddang (1998) ‘The cocoa marketing sector in Sulawesi: a free market and “almost perfect” competition’, Plantations, Recherche, Developpement [Plantations, Research, Development] 5 (3): 170–5.
Ruf, F. and Yoddang (2001) ‘Cocoa migrants from boom to bust’, in Agriculture in Crisis: People, Commodities and Natural Resources in Indonesia, 1996–2000, eds F. Gerard and F. Ruf, Curzon Press, Richmond: 97–156.
Ruf, F. and Yoddang (2004) ‘Pod borer and pesticides’, in From Slash-and-Burn to Replant-ing: Green Revolutions in the Indonesian Uplands?, eds F. Ruf and F. Lançon, World Bank, Washington DC: 147–72.
Shapiro, L.H. and Rosenquist, E.M. (2004) ‘Public/private partnerships in agroforestry: the example of working together to improve cocoa sustainability’, Agroforestry Systems 61: 453–62.
Shapiro, Leo H., Scheffer, Sonja J., Maisin, Navies, Lambert, Smilja, Purung, Hussin Bin, Sulistyowati, Endang, Vega, Fernando E., Gende, Paul, Laup, Samson, Rosmana, Ade, Djam, Sylvia, and Hebbar, Prakash K. (2008) ‘Conopomorpha cramerella (Lepidoptera: Gracillariidae) in the Malay archipelago: genetic signature of a bottlenecked popula-tion?’, Annals of the Entomological Society of America 101 (5): 930–8.