TECHNIQUE TO INCREASE SENIOR HIGH SCHOOL STUDENTS’ ACHIEVEMENT
Kiki Arianto
Mathematics Education, Mathematics and Natural Sciences Faculty, State University of Surabaya e-mail: [email protected]
Dr. Agung Lukito, M.S.
Mathematics Education, Mathematics and Natural Sciences Faculty, State University of Surabaya e-mail: [email protected]
Abstract
Mind map technique is a technique for taking notes where a student creates a collection of words structured by his/her own mental context with visual mnemonics, and through the use of colours, icons, and visual links. Mind mapping is an effective tool to improve students’ mathematics achievement and offer a welcome and delightful change in mathematics education (Brinkmann 2003; Onyishi, 2009). The advantages of mind map technique may lead to the effectiveness of teaching and learning limits. Finally, students’ learning achievement on limits will be increased when using mind map technique. This research aims were to describe the effectiveness of teaching and learning limits using mind map technique for senior high school and to confirm whether senior high school students’ learning achievement on limits when using mind map technique is better than that of those without using mind map technique. The research hypothesis was “Senior high school students’ learning achievement on limits when using mind map technique is better than that of those without using mind map technique.”
Type of this research was quantitative research. The design was quasi-experimental design. Population of the study was all students of class XI-Science in SMA Hang Tuah 1 Surabaya of the school year 2015-2016. Two intact classes were drawn for experimental and control classes. The independent variable was teaching and learning technique, the covariate variable was students’ initial knowledge, and the dependent variable was students’ learning achievement. Data collection methods were paper-based test, observation, and questionnaire. The data collected was analysed by using descriptive statistical analysis and inferential statistical analysis techniques namely analysis of covariance (ANACOVA).
This research revealed that teaching and learning limits using mind map technique in SMA Hang Tuah 1 Surabaya was effective since category of the teaching management was excellent, students were active during teaching and learning, class mastery was achieved and students’ response toward teaching and learning was positive. Furthermore, the research also revealed that students’ learning achievement taught by using mind map technique was better than that of those without using mind map technique. Therefore, researcher generalized the conclusion that teaching and learning limits using mind map technique increased senior high school students’ achievement. Hence, mathematics teachers were recommended to teach limits and other mathematics topics using mind map technique to increase students’ mathematics achievement.
Keywords: achievement, increase, limits, mind map technique, teaching and learning. Abstrak
Teknik peta pikiran adalah sebuah teknik untuk membuat catatan dimana siswa membuat kumpulan kata-kata yang tersusun berdasarkan isi pikirannya sebagai alat bantu mengingat secara visual dengan menggunakan warna-warna, ikon-ikon, dan garis-garis penghubung. Pemetaan pikiran adalah sebuah cara yang efektif untuk meningkatkan hasil belajar matematika siswa dan menawarkan sebuah perubahan yang menggembirakan dan menyenangkan dalam pendidikan matematika (Brinkmann 2003; Onyishi, 2009). Kelebihan-kelebihan dari teknik peta pikiran bisa mengarahkan ke pembelajaran limit yang efektif. Akhirnya, hasil belajar siswa pada materi limit akan meningkat ketika menggunakan teknik peta pikiran. Penelitian ini bertujuan untuk mendeskripsikan keefektifan pembelajaran limit dengan teknik peta pikiran untuk sekolah menengah atas dan untuk mengkonfirmasi apakah hasil belajar siswa sekolah menengah atas pada materi limit ketika menggunakan teknik peta pikiran lebih baik daripada tidak menggunakan teknik peta pikiran. Hipotesis penelitiannya adalah “Hasil belajar siswa sekolah menengah atas pada materi limit ketika menggunakan teknik peta pikiran lebih baik daripada tidak menggunakan teknik peta pikiran.”
adalah hasil belajar siswa. Metode pengumpulan datanya adalah tes tulis, pengamatan dan angket. Data yang terkumpul dianalisis dengan teknik analisis statistik deskriptif dan teknik analisis statistik inferensial yakni analisis kovarian (ANAKOVA).
Penelitian ini menemukan bahwa pembelajaran limit dengan teknik peta pikiran di SMA Hang Tuah 1 Surabaya efektif karena kategori pengelolaan pembelajarannya sangat baik, siswa aktif selama pembelajaran, ketuntasan klasikal tercapai, dan respon siswa tehadap pembelajaran positif. Selanjutnya, penelitian ini juga menemukan bahwa hasil belajar siswa yang diajar dengan teknik peta pikiran lebih baik dari pada yang tidak menggunakan teknik peta pikiran. Maka, peneliti menarik kesimpulan bahwa pembelajaran limit dengan teknik peta pikiran meningkatkan hasil belajar siswa sekolah menengah atas. Oleh karena itu, guru-guru matematika disarankan untuk mengajar limit dan materi matematika lainnnya dengan teknik peta pikiran untuk meningkatkan hasil belajar matematika siswa.
INTRODUCTION AND must do anything quickly, including study. Mathematics is one of subjects that students learn from elementary school to university. Students need a technique that helps them to learn the entire mathematics topic in short time and easiest way. On the other hand, most mathematics teachers, even those with years of experience, are sometime faced with the problem how to present lesson content so that students understand it and accept it through meaningful learning. Solution may be found in reducing the amount of mathematics teaching material. Changes are definitely needed, not necessarily in the content, but in finding ways to represent it.
Mathematical
knowledge has the character of network. In didactical discussion there is a widespread consensus that mathematics should be experienced by students as a network of interrelated concepts and procedures rather than a collection of isolated rules and facts. The network character of mathematics may be experienced but also learned by visualizing graphically structure in mathematics. Two especially suited means for this purpose are mind
mapping and concept mapping. Their special fitting as a pedagogical tool for mathematics education, especially with regard to build structure,
is pointed out
(Brinkmann: 2005). However in this study, researcher uses mind map since mind map helps students to learn and
memorize the
mathematical knowledge. Marinković (2014) described that mind maps are collections of words structured by the mental context of the author itself with visual mnemonics, and, through the use of colour, icons and visual links. Ever since mind maps were invented, they have been used in many fields includingeducation, but rarely yet in mathematics. The advantages of mind map technique in mathematics education are; mind maps help to organise information, mind map encourages brainstorming, mind maps foster creativity, mind maps can be used as a memory aid, new concepts may be introduced by mind maps, mind maps help meaningfully connect new information with given knowledge, mind maps may show the connections between mathematics and the rest of the world, a mind map may summarize the ideas of several students, mind maps help to repetition and summary, and mind maps let cognitive structures of students become visible.
In conducting this effectively in teaching measures of central tendency and other topics in mathematics. Further, it motivates researcher to conduct research about the effectiveness of mind map technique to increase senior high school students’ achievement. In Kurikulum Tingkat Satuan Pendidikan (KTSP), limits is taught in the even semester of eleventh grade of senior high school. Conducting teaching and learning limits using mind map technique is a perfectly brilliant idea. The advantages of mind map technique may lead to the effectiveness of teaching and learning. Finally, students’ learning achievement on limits will be increased when using students’ mathematics achievement and offer a welcome and delightful change in mathematics education.
Based on the foregoing description, researcher would like to
know about the
effectiveness of mind map technique to increase senior high school students’ achievement. Further, the research
question can be broken down into following research questions: (1) How is the effectiveness of teaching and learning limits using mind map technique for senior high school? (2) Is senior high school students’ learning achievement on limits when using mind map technique better than that of those without using mind map technique?
According to the research questions, this research aims are: (1) To describe the effectiveness of teaching and learning limits using mind map technique for senior high school. (2) To confirm whether senior high school students’ learning achievement on limits when using mind map technique is better than that of those without using mind map technique.
Mind Map Technique Mind mapping was invented by Buzan, a mathematician,
mathematics would be better for the contribution of the two halves of the brain to cooperate, complement, and enhance each other, rather than for them to conflict and interfere.
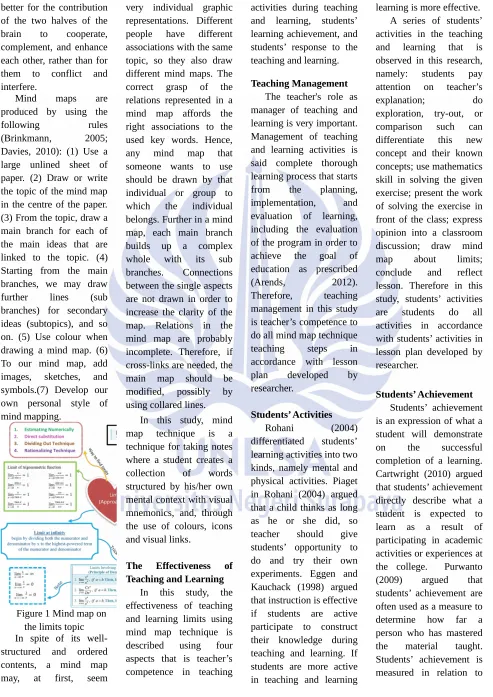
Mind maps are produced by using the following rules (Brinkmann, 2005; Davies, 2010): (1) Use a large unlined sheet of paper. (2) Draw or write the topic of the mind map in the centre of the paper. (3) From the topic, draw a main branch for each of symbols.(7) Develop our own personal style of mind mapping.
Figure 1 Mind map on the limits topic In spite of its well-structured and ordered contents, a mind map may, at first, seem
confusing. Mind maps are very individual graphic representations. Different people have different associations with the same topic, so they also draw different mind maps. The correct grasp of the relations represented in a mind map affords the belongs. Further in a mind map, each main branch builds up a complex whole with its sub branches. Connections between the single aspects are not drawn in order to increase the clarity of the map. Relations in the mind map are probably incomplete. Therefore, if cross-links are needed, the main map should be modified, possibly by using collared lines.
In this study, mind map technique is a technique for taking notes where a student creates a collection of words structured by his/her own mental context with visual mnemonics, and, through the use of colours, icons and visual links.
The Effectiveness of Teaching and Learning
In this study, the effectiveness of teaching and learning limits using mind map technique is described using four aspects that is teacher’s competence in teaching
management, students’ activities during teaching and learning, students’ learning achievement, and students’ response to the teaching and learning.
Teaching Management The teacher's role as manager of teaching and learning is very important. Management of teaching and learning activities is said complete thorough learning process that starts from the planning, implementation, and evaluation of learning, including the evaluation of the program in order to achieve the goal of education as prescribed (Arends, 2012). Therefore, teaching management in this study is teacher’s competence to do all mind map technique teaching steps in differentiated students’ learning activities into two kinds, namely mental and physical activities. Piaget in Rohani (2004) argued that a child thinks as long as he or she did, so teacher should give students’ opportunity to do and try their own experiments. Eggen and Kauchack (1998) argued that instruction is effective if students are active participate to construct their knowledge during teaching and learning. If students are more active in teaching and learning
then the teaching and learning is more effective.
A series of students’ activities in the teaching and learning that is observed in this research, namely: students pay concepts; use mathematics skill in solving the given exercise; present the work of solving the exercise in front of the class; express opinion into a classroom discussion; draw mind map about limits; conclude and reflect lesson. Therefore in this study, students’ activities are students do all activities in accordance with students’ activities in lesson plan developed by researcher.
what is attained at the end of a course, since it is the accomplishment of medium or long term objective of education. In other words, achievement can be measured as stagnating, falling or improving over a long period. Kemp (2011) argued that method to know the effectiveness of instruction is begun by posing question “what have students achieved after teaching and learning?” Therefore, we need to measure students’ learning achievement.
In this study, the students’ learning achievement is obtained from cognitive domain. Students’ achievement in the cognitive domain is obtained by assessing students' work in doing the given post-test. Therefore, the definition of students’ achievement is the students’ post-test score that describes the students’ understanding of limits after teaching and learning using mind map technique.
Students’ Response Sholeha (2015) argued that the effectiveness of instruction can be indicated from students’ interest to learning activities. Students’ interest affect students’ learning achievement. If students are interested to
dictionary defines that response is in the form of reactions, and answers. Reactions and answers occur due to a stimulus.In teaching and learning, students’ response can be different toward the learning activities and lesson contents. Ratumanan (2004) argued that the students’ response can be positive or are not enjoy, feel bored, and think that the lesson contents is useless. The students’ response towards the teaching and learning can be identified by distributing questionnaire to students after teaching and learning
is conducted.
Questionnaire according to oxford dictionary is a set of printed or written questions with a choice of answers, devised for the purposes of a survey or statistical study.
In this study, students’ response is students’ reaction toward teaching and learning limit using mind map technique. The data of students’ response will be obtained by using questionnaire. The students’ response that is considered in this research, namely: students’ pleasure toward the teaching and learning limit using mind map
technique; students’ understanding when using mind map technique; students’ interest toward the teaching and learning limit using mind map technique; and students’ opinion for learning atmosphere when using mind map technique.
Based on foregoing literature review, researcher formulates the following hypothesis to guide this study and it will be tested at .05 level of significance: “Senior high school students’ learning achievement on limits Type of this research is quantitative research. In this research, we need to the hypothesis. The design of this study is quasi-experimental design; specifically, the equivalent pre-test, post-test control group design.
Table 1 Design format of quasi-experimental design
Where:
Yc = Pre-test for both experimental and control classes
Yb = Post-test for both experimental and control classes
X = Treatment was given to the experimental class -X = Minus
treatment
was given to the control class
This research was held in the even semester of school year 2015-2016. Data collection was conducted in SMA Hang Tuah 1 Surabaya. Population of this study is all students of class XI-Science. Sample of this study is class XI-Science 1 as experimental class and class XI-Science 2 as control class. Subjects of this research include mathematics teacher, students of class XI-Science 1 and XI-XI-Science 2.
In this research, research variables are defined by researcher as follows;
1. Independent variables consist: a) Treatment variable: teaching and learning limits using mind map technique was treated in experimental class and teaching and learning limits without using mind map technique was treated in control class, b) Controllable variables: teacher, lesson content, and
time, c)
Uncontrollable variables: students’ health, students’ social economic background, students’ parent education background, and students’ learning style, d) Covariate variable: students’ initial knowledge that
test Condition Research Post-test Experimental Class Yc X Yb
2. Dependent variable is students’ learning achievement after teaching and learning limits using mind map technique shown from the students’ post-test score.
3. Extraneous variables are variable of teaching management, students’ activities during teaching and learning, and students’ response toward teaching and learning.
In this study, data collection methods are: 1. Paper-Based Test
The paper-based test is used to measure students’ cognitive abilities. There were two kind of this test, namely pre-test and post-test. Students were given pre-test before teaching and learning limits. Students were given post-test after teaching and learning limits. The tests problems were same.
2. Observation
Observation is used to obtain data of teaching management and students’ activities during teaching and learning. There were two observers in this research. The two observers conducted observation during teaching and learning in experimental class. The first observer observed teaching management and the second observer observed students’
activities during teaching and learning. 3. Questionnaire
Questionnaire is used to determine how students’ response to teaching and learning using mind map technique. At the end of the lesson, students filled out the questionnaire.
The data collected are analysed using descriptive statistical analysis and inferential statistical analysis techniques. 1. Descriptive Statistical
Analysis
Analysis of teaching management data Data of teaching management were ordinal data, since it used categories of teaching management
adapted from
Masriyah (2006).
Table 2 Categories of teaching management
Measure of central tendency namely mode is used to analyse the teaching management data.
Analysis of students’ activities data
Data of students’ activities during teaching and learning is analysed by using the formula percentage of students’ activities if the sum of average percentage students’ activities is greater than or equals 75%. Conversely, if the sum of average percentage students’ activities is less than 75%, then students are passive in the teaching and learning.
Analysis of students’ achievement data
Individual mastery Students’ achievement is students’ post test score. The result of students’ post-test was analysed by using the scoring guidelines
provided by
researcher. Each student must pass minimum competency criteria, Kriteria Ketuntasan Minimal
(KKM), of
mathematics. The KKM is 75.
Class Mastery
Further students’ individual learning achievement are analysed to describe class mastery. The class mastery percentage (CMP) is counted using following formula:
Class mastery is achieved if the class mastery percentage is at least 75%.
Analysis of students’ response data
A likert scale adapted from Masriyah (2006) is used to analyze of students’ response data.
Table 3 Likert scale for rating students’ questionnaire response
The percentage of students’ response score (SRS) on each statement is counted using following formula.
Category of SRS Percentages adapted from Masriyah (2006) is used to interpret percentage of students’ response score on each statement.
Table 4 Category of SRS Percentages
SRS Percentage Category
Not Bad
Very Good If the number of
statements on good or very good category is greater than or equal to 75%, then students’ response is positive. Conversely, if the number of statements on good or very good category is less than 75%, then students’ response is negative.
Furthermore, teaching and learning limits using mind map technique is effective if category of teaching management is at least good, students are active during teaching Score Category
1 Very Poor
2 Poor
Strongly disagree 0 3
Disagree 1 2
Agree 2 1
and learning, class mastery is achieved and students’ response toward the teaching and learning is positive.
2. Inferential Statistical Analysis
The data collected are analysed using analysis of covariance (ANACOVA). The analysis steps are: a. Construction
regression model Linear
regression function between dependent variable, Y, and independent variable, X is
where and are
estimators for
and in equation
. To
find and ,
researcher uses following
formulas:
(Neter, 2005: 32)
b. Test for
independence
Test for
independence is done on regression
models of
experimental and control classes.
The aim is to know whether there is influence of students’ initial knowledge to students’ learning achievement. The hypotheses are: H0: There is no influence of students’ initial knowledge to students’ learning achievement H1: There is influence of students’ initial knowledge to students’ learning achievement To test the hypotheses, researcher uses variances analysis using F-test with following formula:
(Neter, 2005:92) The criteria: H0 is rejected if
for .
c. Testing linearity Testing
linearity of regression model is done on regression
models of
experimental and control classes. The aim is to know whether students’ initial knowledge and learning achievement are linearly related. The hypotheses are:
H0: The regression model is linear
H1: The regression model is nonlinear To test the hypotheses, researcher uses variances analysis using F-test with following formula:
(Neter, 2005:130) The criteria: H0 is rejected if
for
d. Equality test of two regression models
Equality test of two regression
models of
experimental and control classes is done to know whether regression
model of
experimental class is same with regression model of control class. The hypotheses are:
The two regression models are same
The two regression models are different
To test the hypotheses, researcher uses variances analysis using F- test with following formula:
(Neter, 2005:164) The criteria; H0 is rejected if
for .
If H0 is accepted, then the two regression models are not significantly different. Hence, students’ learning achievement in both control and experimental classes have same linear regression function. Further, since the two regression models are same then we discontinue to homogeneity test of two regression models.
e. Homogeneity test of two regression models
Homogeneity test of two regression models is done to know whether regression model of control class is parallel with regression
model of
experimental class. The hypotheses are:
The two
regre ssion mod els are paral lel The two
To test the hypotheses, researcher uses variances analysis using F- test with following formula:
(Ferguson: 1981) The criteria: H0 is rejected if
for
If H0 is accepted, then regression models of experimental and control classes are parallel. Further we can infer that there is distinction of students’ learning achievement that is taught by using
mind map
technique and without using mind map technique. Then we compare the constants estimator of the regression models of experimental and control classes. If the constant estimator of the regression model of experimental class is greater than the constant estimator of the regression model of control class then we can infer that students’ learning
achievement that is taught by using
mind map
technique is better than that of those without using mind map technique.
If the two necessity it is used another statistical test such as t-test.
RESULTS AND DISCUSSION
1.Descriptive statistical analysis of research results
Data of research results analysed statistically are data of teaching management, data of students’ activities during teaching and learning, data of students’ learning achievement, and data of students’ response toward teaching and learning limits using mind map technique.
Analysis of teaching management data students to recall their previous knowledge which is related with today lesson; explain limits by short answer question and drawing a mind map on whiteboard, supervise students' discussion and help them if they get problem in doing
the students' worksheet; supervise the discussion, make note about the discussion results, and if students' answer is different as the expected answer then teacher clarifies the answer; guide students to make conclusion of today lesson by short answer question and drawing a mind map on whiteboard; explain rules on drawing a mind map; give students opportunity to summarize using mind map technique; check understanding by short answer question; and close lesson by asking students to learn today lesson in home and ask when they get
problem in
understanding it, and to learn next lesson.
The lowest mode category, namely; explain the learning objectives to be achieved; motivate students by presenting the usefulness of limits concept in daily life; manage classroom setting; explain the classroom discussion strategy is Think-Pair-Share (TPS); present initial questions or
discussion's issue that is situation that cannot be understood by students; share students' worksheet to students and ask them to do the students' worksheet with their group; and ask one group to present their work in front of class while other groups give responses to the presenter group.
Furthermore, we can infer that overall teacher’s competences
on teaching
management during the three meetings are in accordance with lesson plan developed by researcher with the general mode is 4. Therefore, category of teaching management done by teacher is excellent. Further, it can be inferred that teaching and learning limits using mind map technique in SMA Hang Tuah 1 Surabaya is effective when the
Analysis of students’ activities data
Result of
observation toward students’ activities during teaching and
learning in
experimental class is
expressed in
learning in experimental class is shown in the following table.
Table 5 Observation data of students’ activities in
experimental class
No Student's Activity Category 1 Pay attention on teacher’s
explanation.
2 Do exploration, try-out, or comparison such can differentiate new concept and their known concepts.
3 Use mathematics skill in solving the students' worksheet
4 Present work of students' worksheet in front of the class 5 Express opinion in classroom
discussion.
6 Draw mind map about limits. 7 Conclude lesson
8 Reflect lesson According Table 5, the average percentage of students pay attention on teacher’s explanation is 17,06%; do exploration, try-out, or comparison such can differentiate new concept and their known concepts is
22,62%; use
mathematics skill in solving the students’ worksheet is 14,29%; present work of students’ worksheet in front of the class is 2,38%; express opinion in classroom discussion is 29,37%; draw mind map is 7,14%; conclude and reflect lesson are
same, namely
3,57%.The highest average percentage of student’s activity category is 29,37%, namely express opinion in classroom discussion. It means that the most dominant
activity of students’ activities during teaching and learning is students express opinion in classroom discussion.
Furthermore, based on the table, sum of average percentages of the 2th until the 6th students’ activity category is 76,67%. This percentage is greater than 75% thus students are active during teaching and learning limits using mind map technique. Therefore, it can be inferred that teaching and learning limits using mind map technique in SMA Hang Tuah 1 Surabaya is effective when the effectiveness of teaching and learning is described using aspect of students’ activities during teaching and learning.
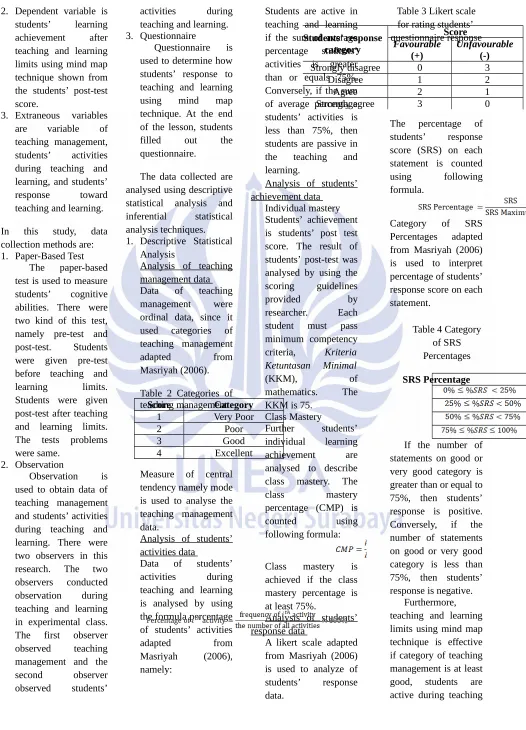
Figure 2 Student’s mind maps about limits topics
Analysis of students’ achievement data
Comparison of students’ learning achievement in experimental and control classes can be seen in following table.
Table 6 Students’ learning achievement
in experimental and control classes Explanation
The number of students The number of students who have passed the KKM
Percentage of class mastery
Class mastery
Based on the table, the number of students who have passed the KKM in experimental class is 32 thus the percentage of class
mastery in
experimental class is 88,89%. The number of students who have passed the KKM in control class is 24 thus the percentage of class mastery in control class is 66,67%. Therefore class mastery is achieved in experimental class and class mastery is not achieved in control class.
Further, it can be inferred that teaching and learning limits
using mind map technique in SMA Hang Tuah 1 Surabaya is effective when the effectiveness of teaching and learning is described using aspect of students’ learning achievement.
Analysis of students’ response data
Students’
questionnaire response was filled by experimental class students after they did post-test. Students’ response data is showed in following table.
Table 7 Data of students’ response toward teaching and learning limits using mind map
technique
No Statement Percentage(%) 1 I am happy during teachingand learning limits. 82
2 I feel easier to understandthe limits concept in this
teaching and learning. 74
3
I think that mathematics lesson is more interesting in
this teaching and learning. 80
4 This teaching and learningmake class be more conducive.
78
5 I am uncomfortable duringthis teaching and learning. 81
6 I feel difficult to understandthe limits concepts in this teaching and learning.
72
7 I do not want next lessonlike this teaching and learning.
80
8 I think that this teaching andlearning is ineffective. 79 According Table 7,
understand the limits teaching and learning. For the other statements on the students’ questionnaire response get very good category. The number of statements getting good or very good categories is 100%. This percentage is greater than or equal to 75%, then students’ response toward teaching and learning limits using mind map technique is positive.
Further, based on the table, it is obtained that the percentages of students’ response for first and fifth statements, second and sixth statements, third and seventh statement seven, fourth and eighth are almost same. It indicates that students’ response on the questionnaire response is consistent. Futhermore, it can be inferred that teaching and learning limits using mind map technique in SMA Hang Tuah 1 Surabaya is effective when the teaching and learning.
2. The effectiveness of teaching and learning
Discussion of descriptive statistical analysis refers that teaching and learning limits using mind map technique in SMA Hang Tuah 1 Surabaya is effective since the categories teaching management is excellent, students are active during teaching and learning limits using mind map technique, class mastery is achieved and students’ response toward teaching and learning is positive. Teaching and learning using mind map technique is more effective than teaching and learning without using mind map technique. Teaching and learning limits without using mind map technique is ineffective since the effectiveness aspect of teaching and learning that is class mastery is not achieved although the other aspects are not measured.
3.Inferential statistical analysis of students’ learning achievement data
Students’ learning achievement is
The regression
model which
describes relation of students’ initial
knowledge and students’ learning achievement taught using mind map technique is
. The regression
model which
describes relation of students’ initial knowledge and students’ learning achievement taught without using mind map technique is
.
b. Test for independence
Results of test for independence on regression
models of
experimental and control classes refer that students’ initial knowledge has significant influence toward students’ learning achievement. It
means that
students’ learning achievement is
depended to
students’ initial knowledge. c. Testing linearity
Results for testing linearity on regression models of experimental and control classes refer that students’ initial knowledge and students’ learning
achievement are linearly related. It means that the
higher students’ initial knowledge, the higher students’ learning
achievement. d. Equality test of
two regression models
Result of
equality test of two regression models reveals that the regression models of experimental and control classes are different. It
means that
students’
achievement in experimental and control classes are different. Then, it is continued to homogeneity test. e. Homogeneity test
of two regression models
Result of
homogeneity test of two regression models reveals that regression models of experimental and control classes are parallel. Therefore, it can be inferred that there is distinction of students’ learning achievement on limits which is taught by using
mind map
technique and without using mind map technique.
estimator of the regression model of control class is
65,09. The
constant estimator of the regression
model of
experimental class is greater than the constant estimator of the regression model of control class. Hence we can infer that students’ learning achievement taught using mind map technique is better than that of those without using mind map technique. Furthermore, population of this study is all students of class XI-Science SMA Hang Tuah 1 Surabaya of the school year 2015-2016 and sample of this study is class XI-Science 1 as experimental class and class XI-Science 2 as control class. This study reveals that students’ learning achievement class XI-Science 1 taught using mind map technique is
better than
students’ learning achievement class XI-Science 2 taught without using mind map technique.
Therefore we can generalize the conclusion that teaching and learning limits
using mind map technique increase senior high school students’ learning achievement done in this research is only
on product,
regardless students’ performance during teaching and learning.
2. The sampling technique of this study is inaccurate to represent the population. Because the choice of the sample is only based on mathematics teacher information that all classes in the
school are
equivalent, not using statistical sampling technique.
CONCLUSSIONS AND SUGGESTIONS
Conclussions
Based on analysis and discussion of research results, it can be inferred that:
1. Teaching and learning using mind map technique is effective to teach limits in class XI-Science 1 SMA Hang Tuah 1 Surabaya, since it has fulfilled all the aspects determined such as; a) Category of teaching management done by teacher is excellent, b) Students are active during teaching and
learning, c) Class mastery is achieved, d) Students’ response to teaching and learning limits using mind map is positive.
2. Teaching and learning limits using mind map technique increase senior high school students’ achievement. Because students’ learning achievement of class XI-Science 1 which is taught using mind map technique is better than students’ learning achievement of class XI-Science 2 which is taught without using mind map technique.
Suggestions
According to results of this research, researcher suggests following suggestions;
1. Mathematics teachers are recommended to teach limits and other mathematics topics using mind map technique to increase students’ mathematics achievement.
2. Researchers who will conduct similar research are suggested to reduce weaknesses York: McGraw Hill. Brinkmann, A. 2003. (eds.), Mathematics Education Review, The Journal of Association of Mathematics
Education Teacher, Number 16, April Knowledge maps– tools for building
structure in
mathematics.
International Journal for Mathematics inkmann.pdf on 19th of November 2015. Cartwright, R., Weiner,
K., & Streamer-Veneruso, S. 2010. Student Learning Outcomes Assessment Handbook. Maryland: Montgomery College. Davies, M. 2010. Concept
mapping, mind
mapping and
pp.279-rences_and_do_they_ matter/links/0deec51d 94fed230c4000000.pd f on 19th of November 2015.
Eggen, P.D. & Kauchack, D.P. 1998. Strategies fo Teacher, Teaching Content and Teaching Skills. Boston: Allyn & Bacon.
Ferguson, G. A. 1981. Statistical analysis in psychology and education. New York: McGraw-Hill Book Company.
Kutner, M.H.,
Nachtsheim, C.J., Neter, J. & Li, W. 2005. Applied Linear Statistical Models (5th ed.). New York: McGraw-Hill Book Company.
Marinković, Z. 2014. Concept maps in math teaching.
Retrievedkfromkhttp:// elib.mi.sanu.ac.rs/files/ journals/vm/57/vmn57 p6-8.pdf on 19th of November 2015. Marrison, G. R., Ross, S.
M., Kalman, H. K. & Kemp, J. E. 2011. Designing effective instruction (6th ed.). Hoboken, NJ: John Wiley & Sons.
Masriyah. 2006. Modul 9 Penyusunan Non Tes. Surabaya: Universitas Terbuka.
Meier, P. 2007. Mind-mapping a tool for eliciting and representing
knowledge held by diverse informants. Social Research UPDATE, 52: 1-4. Retrieved from http://sru.soc.surrey.ac. uk/SRU52.pdf on 19th of November 2015.
Onyishi, E. U. 2009. Effect of Mind Maps on Students’ Interest and Achievement in Measures of Central
Tendency in
Mathematics.
Published M.ED. Thesis, University of Nigeria, Nsukka. Retrieved from http://www.unn.edu.ng /publications/files/ima ges/ONYISHI, %20EUGENIA %20UCHENNA.pdf on 25th of November 2015.
Oxford
Dictionary.www.oxfor ddictionaries.com accessed on 4th January, 2016.
Purwanto. 2009. Evaluasi Hasil Belajar. Yogyakarta: Pustaka Pelajar.
Ratumanan, T. G. 2004.
Belajar dan
Pembelajaran. Edisi kedua. Surabaya: Unesa University Press.
Rohani, A. 2004. Pengelolaan
Pembelajaran. Jakarta: Rineka Cipta.
Sholeha, I. 2015. Keefektifan
Pembelajaran