The journal homepage www.jpacr.ub.ac.id p-ISSN : 2302 – 4690 | e-ISSN : 2541 – 0733
Liquid Chromatography for Analysis of Metformin in
Myrmeleon
sp.
Afidatul Muadifah1,2, Hermin Sulistyarti*2,3, Sasangka Prasetyawan2,3
1
Sekolah Tinggi Ilmu Kesehatan Karya Putra Bangsa, Jl.Raya Tulungagung Blitar Km.4, Tulungagung, Indonesia
2
Chemistry Department, Faculty of Science, Brawijaya University, Jl. Veteran Malang 65145 Indonesia
3
Research Center for Low Cost and Automated Method and Instrumentation Analysis (LCAMIA), Brawijaya University, Malang, Indonesia
*
Corresponding author: Email: [email protected]
Received 12 June 2017; Revised 7 August 2017; Accepted 21 August 2017
ABSTRACT
Myrmeleon sp. is typical of insect larva which has been used in Indonesia for diabetes treatment. However, there is no sufficient scientific report explaining the bioactive compounds in this insect. Based on our preliminary research, this insect contained metformin, i.e. one of bioactive compounds for the treatment of type-2 diabetes. Therefore, this study is focused on the development of separation technique using high-performance liquid chromatography (HPLC) on a reverse phase C-18 column with UV detection to identify and quantify metformin in methanol extract of Myrmeleon sp. Several parameters of HPLC method were optimized in accordance with the high resolution of separation and accurate determination of metformin. Satisfied separation was obtained under gradient elution mode using aqueous methanol/water with gradual increase of methanol from 50-90% and the flow rate of 0.5 mL/min with detection wavelength of 233 nm. The method performed total separation for all compounds in less than 11 min. Spiking technique was chosen for metformin identification and quantitation. Metformin in extract Myrmeleon sp.
was eluted at the retention time (tR) of 4.095 min, similarly with the retention time of
standard metformin of 4.092 min. The quantity of metformin in Myrmeleon sp. can be simply determined by comparing the additional area of standard metformin and area of metformin from extract Myrmeleon sp. The results confirmed that the methanol extract of
Myrmeleon sp. contained the anti-diabetes compound of metformin of 0.58 mg/g
Myrmeleon sp. larvae with acceptable coefficient variation of 5.56 %.
Key word : Metformin, myrmeleon, HPLC, optimization, spiking, diabetes
INTRODUCTION
The clinical studies of UK Prospective Diabetes Study/UKPDS using a multi-center randomized control on some models of different type-2 diabetes therapy reported that intensive glucose controlled by MET may lower the risk of diabetes-related end point and mortality in diabetic patients who have overweight by diminishing hypoglycemia. Additionally, it has been proven by more than 30 clinical trials that MET also showed mortality reduction from cardiovascular [3,4].
The study of anti-diabetic compounds has been reported using LC-UV method on several kinds of samples[5,6,7,8,9,10,11,12,13]. Several anti-diabetic compounds such as pioglitazone (PIO), glibenclamide (GLB), and glimepiride (GLM) using LC-UV were successfully separated using methanol/water 30% solvent on column RP-18 and detected using UV-detector at 235 nm. Under these conditions, the four anti-diabetic compounds were eluted at a retention time of 2 min (MET), 3 min (PIO), 7 min (GLB), and 9 mins (GLM) [14]. Another finding reported that the LC-UV method was also capable of separating pioglitazone hydrochloride and MET hydrochloride in the dosage form (drug) under similar conditions of methanol : water with ratio of 45:55 mobile phase, RP-18 column, and UV-detection at 265 nm. Pioglitazone hydrochloride and MET hydrochloride were sequentially eluted at retention times of 4.68 and 14.22 min [15]. These reports indicated that LC-UV method can be used for the analysis of anti-diabetic compounds.
Myrmeleon sp. is characteristic of insect larva which has been applied in Indonesia for diabetes treatment. In 2006, Kurniasih et al. reported Myrmeleon sp. has anti diabetic activity in mice [16]. However, there is no sufficient scientific report explaining the bioactive compounds in this insect which can lower blood sugar levels. Therefore, the usage of
Myrmeleon sp. for diabetic treatment is still based on empirical experience without knowing the true biological active compounds. Therefore, the research for proving the exact anti diabetic component in Myrmeleon sp. is strongly required to ensure that the Myrmeleon sp. can be used as an alternative treatment for diabetes.
Thus, this research was focused on the development of separation method based on LC-UV for analysing MET in Myrmeleon sp. using mixture of methanol : water mobile phase and a non-polar C18 column stationary phase. The semi polar physicochemical properties of MET is expected to interact with non-polar column and can be eluted by polar solvent at low retention time. Therefore, in order to determine the optimum conditions for MET analysis
The chemicals used involved standard metformin-hydrochloride (Sigma-Aldrich PHR 1084-500 mg, >99.99%) and internal standard glibenclamide (N-p-[2-(5-Chloro-2-methoxybenzamido) ethyl]) benzenesulfonyl-N’-cyclohexylurea) (Sigma-Aldrich G0639-5 g, ≥ 99%), and mobile phase of mixture of water and methanol (Merck HPLC grade, Germany). The chemical structure of those chemicals was showed in Figure 1.
Figure 1. The chemical structures of MET-hydrochloride and GLB [17]
Procedure
Preparation of standard solutions
Standard solution of MET 6 ppm and GLB 3 ppm were prepared by diluting standard stock solution of MET and GLB 1000 ppm. A mixture solution of MET and GLB was prepared by pipetting 5 mL of a standard solution of MET 6 ppm added by 15 µL of a standard solution of GLB 1000 ppm, followed by homogenization by sonication for 300 seconds.
Optimization
The method was optimized under condition of flow rate (0.3; 0.5; and 0.7 mL/min), wavelength UV detector (230-240 nm) and composition of the mobile phase of methanol/water from 30-70%) for isocratic elution system and methanol/water with gradual increase of methanol from 50-90% for gradient elution system.
Sample preparation
The samples of Myrmeleon p. larvae were collected from the Krebet, Srengat, Blitar, East Java, Indonesia. Myrmeleon sp. extract was prepared by grinding a number of larva dissolved in methanol by stirring for 30 mins followed by filtration and 5 mins sonication. Standard metformin and glibenclamide were also prepared in methanol.
Optimization of LC-UV method
Optimization of flow rate and wavelength detection
Optimization of flow rate and wavelength detection was conducted by injecting standard mixture solution of MET 6 ppm and GLB 3 ppm in mobile phase containing a mixture of methanol: water, and then separated on a reverse phase C-18 column. The metformin peak was detected spectrophotometrically by UV detection. The proposed LC-UV method was optimized under the following conditions:
Temperature : Room temperature
Column : C-18 VP-ODS 250L x 4,6 mm
Flow rate : 0.3 mL/min; 0.5 mL/min and 0.7 mL/min Detector : UV 230-240 nm
Mobile phase : Methanol/water 30-70% (isocratic elution) and methanol/water 50-90% (gradient elution system)
The optimum flow rate was determined by the degree of resolution (Rs) and time of
Optimization of mobile phase composition
Optimization of mobile phases composition was conducted under optimum flow rate and wavelength. The composition of the mobile phase was optimized by varying methanol/ water under isocratic elution from 30 to 70%, whilst for gradient elution the composition of methanol/water was varied gradually from 50% to 90% for 15 min. The optimum mobile phase composition was determined by degree of separation and chromatogram performance.
Analysis of Metformin from Myrmeleon sp. Extract
For qualitative and quantitative analysis, the dilute extract Myrmeleon sp. was injected in LC-UV system under optimum flow rate (0.5 mL/min), maximum wavelength (233 nm), and optimum mobile phase of methanol/water 70% (for isocratic) and gradient elution system methanol/water of 50-40% for 2.5 min, followed by methanol/water 70-90% for 2.51 min up to total analysis time of 15 min.
Qualitative analysis were done by comparing the retention time of standard MET with the retention time of peaks form Myrmeleon sp. Chromatogram and by spiking technique, where the metformin can be determined by increasing peak area by standard MET injection. Spiking technique was conducted by injecting 30 µL of MET standard into 5 mL of
Myrmeleon sp. extract followed by homogenization with sonication for 300 seconds, and then filtration through a 0.45 m filter paper before injection into the LC-UV system. The presence of metformin was detected by the peak with higher intensity (area) compared to chromatogram peak from the un-spiked sample. In order to ensure the presence of metformin in Myrmeleon sp., the qualitative analysis was also performed using LC-MS [18], under optimum condition LC-MS with a tube lens for ion of 130.00 m/z.
Quantitative analysis of MET in the methanol extract of Myrmeleon sp. was done using spiking and internal standard method. The concentration of metformin was determined by comparing the peak area of MET before and after spiking with a known concentration of MET standard solution. Whereas using the internal standard method, the concentration of metformin was determined using internal response factor obtained from peak areas of MET 6 ppm and GLB 3 ppm.
RESULT AND DISCUSSION Optimization of LC-UV method
Figure 2. Influence of flow rate on the chromatogram of metformin (MET) and Glibenclamide (GLB) standards. Conditions: flow rate of (a) 0.3 mL/min, (b) 0.5 mL/min, and (c) 0.7 mL/min ; in C-18 250 L x 4.6 mm column ; mobile phase of methanol/water 70% ; 2 µL sample ; 235 nm.
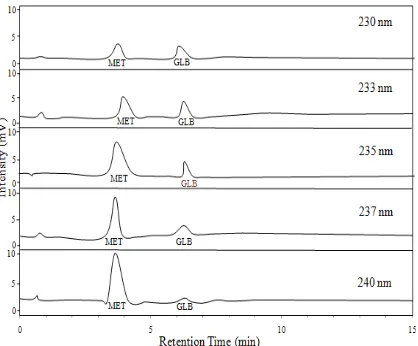
Figure 3. Influence of wavelength on the chromatogram of metformin (MET) and glibenclamide (GLB). Conditions: same as Figure 2, except flow rate at optimum (0.5 mL/min) and wavelength was varied from 230-240 nm.
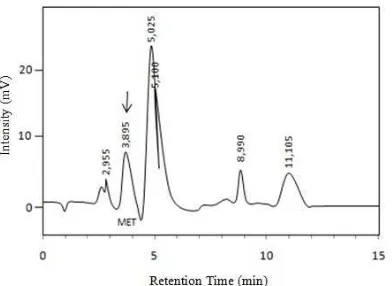
Figure 4. Chromatogram of Myrmeleon sp. extract using isocratic elution Conditions: as in Figure 2 with optimum conditions: 0.5 mL/min, 233 nm, mobile phase composition of methanol/water 70%
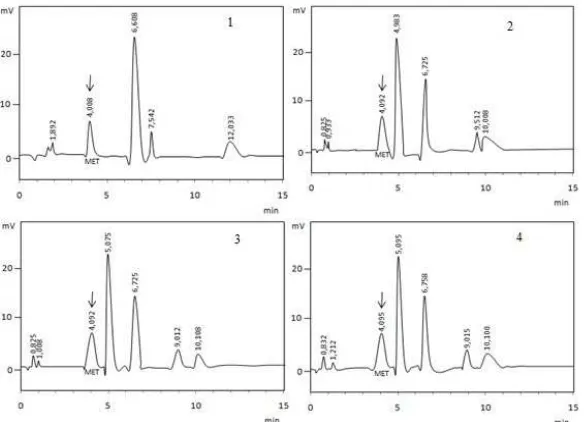
Therefore, in order to improve the separation, the technique of elution was changed to gradient elution system [19]. The first mobile phase composition in gradient elution (GRAD-1) was methanol/water with gradient increase methanol from 40-80% in 7 min to separate peaks 1 and 2 as well as peaks 4 and 5, followed by gradient increase methanol up to 90% from 7.01-15.00 min to speed up the elution process peaks 6 and 7. The chromatogram under this composition was showed in Figure 5 (1) which showed 6 peaks with better separation to almost all peaks; however, the peaks 6 and 7 became overlapped into 1 peak indicated as peak 6. Compounds of peak 1 and 2 were eluted under lower retention time using more polar mobile phase, meaning that both compound were relatively polar compared to other compounds.
The mobile phase composition for the second run (GRAD-2) was started using more polar solvent compared to GRAD-1 using methanol/water 50% and gradient increase methanol up to 90% for 15 min, to obtain better separation than the first composition by separating coincident peaks 1 and 2, accelerating peaks 3, 4, 5 and separating overlapping peaks 6 and 7. The separation of peaks 1 and 2 was slightly improved as expected as can be seen in Figure 5 (2). Starting elution using higher water composition did not only accelerate peaks 3, 4, and 5 but also accelerated peaks 1 and 2. Increasing methanol composition to 90% slightly improved the separation of peaks 6 and 7.
The improvement of separation from using GRAD-2 elution system was done by using a third mobile phase composition (GRAD-3) which was started using the same composition as in GRAD-2 system (methanol/water of 50 %), followed by gradient increase composition of methanol up to 80% from 5.51-9 min and methanol/water 90 % from 9.51-13min. The chromatogram peaks of 1-5 were kept constant under separation conditions as in GRAD-2 system, and the elution using less polar mobile-phase composition of methanol/water 80% for 5.51-9 min resulted faster elution for peak 6 compared to peak 7; thus, peaks 6 and 7 were separated as shown in Figure 5 (3).
relatively non polar compared to peak 1 compound. This gradient elution (GRAD-4) showed excellent separation for all compounds (peaks 1-7) in methanol extract of Myrmelelon sp. on RP C-18 column (Figure 5 (4)); therefore, GRAD-4 was selected as optimum condition for elution and used for further separation and determination of metformin in Myrmeleon sp.
Figure 5. Chromatogram of Myrmeleon sp. Extract under various composition of mobile phase using gradient elution with composition of GRAD-1 to GRAD-4, under constant flow rate of 0.5 mL/min, 233 nm, and C-18 250L x4.6 mm column.
Analysis of Metformin
The qualitative analysis for determining metformin in Myrmeleon sp. extract was done using three methods, i.e. (1) comparison of retention time, tR, of MET standard to the
retention time of peaks in the Myrmeleon sp. extract chromatogram; (2) based on spiking extract Myrmeleon sp. with MET standard, and (3) based on LC-MS spectra. As shown in Figure 6, peak 3 (tR of 4.095 min) from extract Myrmeleon sp. chromatogram has similar
retention time to the retention time of MET standard peak (tR of 4.092 min), it means that
peak 3 of the sample (extract of Myrmeleon sp.) is metformin.
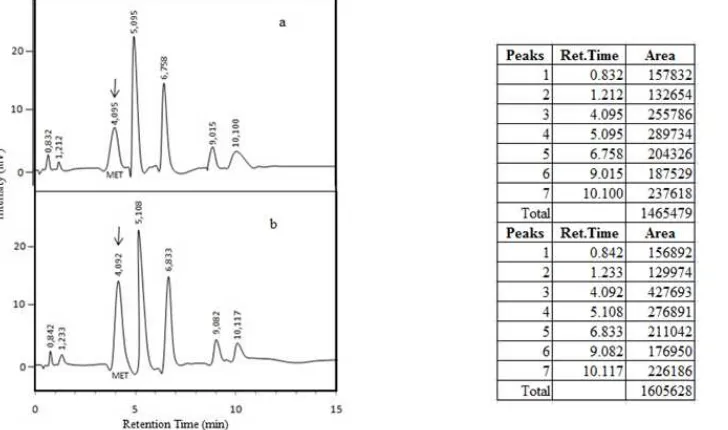
In the second method, spiking standard MET into Myrmeleon sp. extract increased the area of peak 3 chromatograms of Myrmeleon sp. from 255,786 area unit to 427,693 area unit (Figure 7). This also indicates that the peak 3 with tR of 4.095 min in the extract Myrmeleon
sp. chromatogram is metformin.
Figure 7. (a) Chromatogram of Myrmeleon sp. extract
(b) Chromatogram of Myrmeleon sp. extract spiked with MET standard
To prove that the retention time of 4.095 min was metformin, the extract of
Myrmeleon sp. was also analyzed using LC-MS. Ion trap mass spectrometer was used to detect the occurrence of MET which has molecular weight of 130.00 g.mol-1. The fragmentation of MET in Myrmeleon sp.was confirmed by the appearance of molecular ion peaks at m/z 85.2, 71.3 and 60.3 for MET, which represent the molecular weight of the MET fragmentation (Figure 8).The fragments at m/z 85.2, 71.30, and 60.32 for MET in
Myrmeleon sp. were confirmed by the loss of -CNHNH2, -NHCNHNH2, and –CNHN(CH3)2
of metformin.
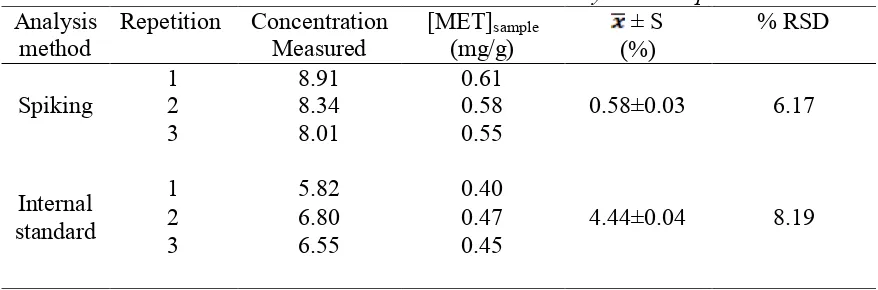
The quantity of metformin in the Myrmeleon sp. was done using spiking technique (as shown in Figure 7) and internal standard. The spiking technique for quantitative analysis of MET was conducted using spiking method with three repetitions as conducted for qualitative analysis; but the standard MET was spiked under a known concentration. The concentration of metformin in the sample (Myrmeleon sp. extract) was determined by the increased of peak 3 area in comparison to the peak area of metformin standard. Under this technique, concentration of metformin in the Myrmeleon sp. extract was found containing 0.58 mg metformin/g Myrmeleon sp.
The second quantitative analysis was using the internal standard method in order to correct for the loss of analyte during sample preparation or sample inlet. Under this technique, the concentration of analytes (metformin) was determined by calculating response factor. The internal standard selected was a stable compound of glibenclamide which has a similar retention time and does not interfere with the sample components. The chromatogram of Myrmeleon sp. extract in the presence of glibenclamide internal standard using LC-UV was depicted in Figure 9. Under this internal standard method, the concentration of MET in
Myrmeleon sp. was found 4.44 mg metformin/g Myrmeleon sp. larvae.
Figure 9. Chromatogram of sample with internal standard by LC-UV optimum
The summary of quantitative analysis using both methods (spiking and internal standard) is depicted in Table 1, showing that the value obtained from internal standard is slightly lower compared to spiking method. This means that glibenclamide as internal standard slightly interfere the respond of metformin in the Myrmeleon sp. Spiking using the analyte standard is preferable as it perform better accuracy.
Table 1. Concentration of metformin in Myrmeleon sp.
The validity of LC-UV method was carried using spiking technique based on the calculation of percent recovery of the standard spiked into the extract Myrmeleon sp. [20]. The concentration MET used as standard solution should be relatively similar to the concentration of MET in sample [21]. This procedure was performed by spiking known concentration of metformin (6 mg/L) into the extract Myrmeleon sp. The results showed that the average of percent recoveries of the spiked standard metformin was 92.29% with acceptable relative standard deviation (RSD) of 5.66 % (Table 2).
Table 2. Results of recovery in the MET compound in undur-undur
Myrmeleon 2.5 min, followed by 70:30 % to 90-10% for 2.51 to 15 min. The LC-UV has proven that the extract Myrmeleon sp. contained metformin, one of compounds for hyperglycemia treatment type 2-diabetes. Under this method the concentration of metformin in Myrmeleon sp.
methanol extract was found 0.58 mg/g Myrmeleon sp. larvae with acceptable accuracy of 92.6% and precision (RSD) of 5.66%.
ACKNOWLEDGEMENT
The authors are grateful to The Central of Low Cost and Automated Method and Instrumentation (LCAMIA) University of Brawijaya Malang Indonesia for financial support.
REFERENCES
[1] Adler, A.I., Shaw, E.J. Stokes, T. and Ruiz, F., BMJ Journal, 2009, 338, b1668. [2] Nathan, D.M., Buse, J.B., Davidson, M.B., Ferrannini, E., Holman, R.R., Sherwin, R.,
and Zinman, B., Diabetes Care, 2009, 32, 193-203.
[7] Lad, N. R., Bhoir, S. I., Bhoir, I. C., and Sundaresan, M., Indian J. Pharm. Sci, 2003, 65, 650-653.
[8] Srinivas, P., Venkataramana, K., Srinivasa Rao, J., and Srinivasa, N., IJPCBS, 2012, 2, 104-109.
[9] Bhanu R., Kulkarni S., and Kadam A., Indian Drugs, 2006, 43 (1), 16-20.
[10] Wahed, M.I.I., Research Journal of Medicine and Medical Sciences, 2007, 2(2), 115-121.
[11] Florentin Tache and Monica Albu, Rev. Roum. Chim., 2007, 52 (6), 603-609.
[12] Lakshmi, M. S., Rajesh, T., and Shrinivas Sharma, Int J Pharm Pharm Sci, 2009, 1(2), 162-166.
[13] Cheng C.L., and Chou C.H., J Chromatogr B Biomed Sci Appl., 2001, 762, 51-57. [14] Sultana, N., Naveed, S. and M. Arayne, S., J Anal Bioanal Tech 5, 2013, 4, 1-8.
[15] Peraman, R., Peruru, K.K., Yiragam, P.R., and Gowra, C.S., MJPS, 2014, 12(1), 33-46. [16] Kurniasih, T., Isma’il, M., Susilowati, F. and Lestari, S.P., PKMP, 2006, 2 (8), 1-7. [17] Siswandono and Soekardjo, B., Kimia Medisinal, 2008, Pusat Penerbitan dan
Percetakan Unair, Surabaya.
[18] Guo-Ping, Z., Bi H.-C., S. Zhou, X. Chen, and M. Huang, J. Mass Spectrom., 2005, 40 (11), 1462-1471.
[19] C. Yardımcı, N. Özaltın, A. Gürlek, Talanta, 2007, 72, 1416-1422.
[20] U.S. Departemen of Health and Human Service, Food and Drug Administration, Guidance for Industry, Bioanalitycal Method Validation, 2001, Center for Drug Evaluation and Research (CDER) and Center for Veterinary Medicine (CVM), USA. [21] Ravichandran, V., Shalini, S., Sundram, K.M., and Rajak, H., Int J Pharm Pharm Sc,
![Figure 1. The chemical structures of MET-hydrochloride and GLB [17]](https://thumb-ap.123doks.com/thumbv2/123dok/3173606.1388213/3.595.88.483.85.183/figure-chemical-structures-met-hydrochloride-glb.webp)