AIDS Treatment
Labor Supply in Western Kenya
Harsha Thirumurthy
Joshua Graff Zivin
Markus Goldstein
a b s t r a c t
Using longitudinal survey data collected in collaboration with a treatment program, this paper estimates the economic impacts of antiretroviral treatment. The responses in two outcomes are studied: (1) labor supply of
Harsha Thirumurthy is an assistant professor in the Department of Health Policy and Administration at the University of North Carolina at Chapel Hill. Joshua Graff Zivin is an associate professor in the Department of Health Policy and Management at Columbia University and a faculty research fellow at NBER. Markus Goldstein is a senior researcher at the World Bank. This project would not have been possible without the support of the Academic Model for Prevention and Treatment of HIV/AIDS (AMPATH) and members of the IU-Kenya partnership. The authors have benefited from discussions with Richard Akresh, Michael Boozer, Joseph Altonji, Janet Currie, Germano Mwabu, Matt Neidell, T. Paul Schultz, Tavneet Suri, Christopher Udry, and participants in seminars at the Center for Global Development, the International Food Policy Research Institute, Michigan State University, RAND, University of Maryland, University of Pittsburgh, Yale University, the Center for Interdisciplinary Research on AIDS at Yale, and the World Bank. They would also like to thank two anonymous referees for invaluable comments. The household survey was implemented under the direction of Mabel Nangami and the authors. Giovanna d’Adda assisted in managing the second round of the survey and the data collection was facilitated by the excellent field supervision of Irene Muhunzu. The authors also acknowledge the tremendous contributions of Andrew Anyembe, Caroline Amuyunzu, Jayne Chaina, Norbert Ketter, James Mungai, June Ochanda, and Jacklyne Tetee for administering questionnaires; and Chelimo Cherono, David Marende, Maurice Mungai, Florence Oduor, and Martha Simiyu for computer entry of questionnaires. The authors thank Kara Wools-Kaloustian and Beverly Musick for guidance in using the AMPATH medical records. Financial support for this project was received from the Economic and Social Research Council (UK), Pfizer, Inc., The World Bank, Yale University’s Center for Interdisciplinary Research on AIDS (CIRA) through a grant from the National Institute of Mental Health to Michael Merson, M.D. (No. P30 MH 62294), the Social Science Research Council, and the Calderone Program at Columbia University. The views expressed here do not necessarily reflect those of the World Bank or its member countries. The household survey data used in this article can be obtained beginning January 2009 through December 2012 from Harsha Thirumurthy, School of Public Health, Box 7411, University of North Carolina at Chapel Hill, Chapel Hill, NC 27599, harsha@unc.edu. The medical data used in this article are the property of AMPATH treatment program and can only be obtained by direct permission from them. Interested researchers should contact William Tierney, Regenstrief Institute, Inc., Health Information and Translational Sciences Bldg. (HITS), 410 West 10th Street, Suite 2000, Indianapolis, IN 46202, wtierney@iupui.edu.
½Submitted March 2007; accepted August 2007
ISSN 022-166X E-ISSN 1548-8004Ó2008 by the Board of Regents of the University of Wisconsin System
treated adult AIDS patients; and (2) labor supply of individuals in patients’ households. Within six months after treatment initiation, there is a 20 percent increase in the likelihood of the patient participating in the labor force and a 35 percent increase in weekly hours worked. Young boys in treated patients’ households work significantly less after treatment initiation, while girls and adult household members do not change their labor supply.
I. Introduction
Sub-Saharan Africa is home to 25 million of the nearly 40 million people living with HIV/AIDS worldwide (UNAIDS 2006). In the next decade, AIDS-related mortality in Africa has the potential to generate growing numbers of orphans (already 12 million), while also shortening life expectancy to below 40 years in a number of countries. Following increases in donor support and substantial reduc-tions in the prices of medicines, antiretroviral (ARV) therapy has recently become an important part of the policy response to combat AIDS.1 As of December 2005, roughly 800,000 HIV-positive individuals were receiving ARV therapy in Sub-Saharan Africa (WHO 2006). Since this represents only 17 percent of the number of people needing treatment, scaling-up of treatment programs poses a major chal-lenge in many countries.2At the same time, however, some have questioned the in-vestment in ARV therapy since most low-income countries have limited resources and many competing needs (Marseille, Hofmann, and Kahn 2002; Kremer 2002; Canning 2006).
Numerous studies have shown that ARV therapy dramatically reduces morbidity and mortality among HIV-infected individuals, in both industrialized countries (Hammer et al. 1997; Hogg et al. 1998; Palella et al. 1998) and developing countries (Laurent et al. 2002; Marins et al. 2003; Koenig, Leandre, and Farmer 2004; Coetzee et al. 2004; Wools-Kaloustian et al. 2006). These health benefits have the potential to significantly improve economic well-being, as suggested by a growing literature that shows linkages between health and income in developing countries.3While this lit-erature examines the economic impacts of several dimensions of health such as nu-tritional status and morbidity, it provides little guidance when it comes to a highly debilitating and chronic disease like HIV/AIDS. One exception is the recent study by Fox et al. (2004), who analyze retrospective data from a Kenyan tea estate and find significant declines in the labor productivity of HIV-positive workers prior to their death or medical retirement. However, the extent to which treatment can reverse such declines in labor productivity remains to be determined. Little is known about the impact of this important intervention on a broad range of other socioeconomic outcomes as well, both at the individual and household level.
In this paper, we use survey data from Kenya to present the first estimates of how quickly and to what degree ARV therapy affects the labor supply of treated patients
1. For example, in 2003 the World Health Organization (WHO) launched the prominent ‘‘3 by 5’’ cam-paign, with the goal of treating three million people by 2005 (WHO 2003).
and their household members. These estimates are a preliminary step in understand-ing the socioeconomic impacts of ARV therapy, which in turn is critical for properly evaluating treatment programs and efficiently allocating resources. For example, if ARV therapy for adult AIDS patients increases the likelihood that their children at-tend school, then such impacts belong in any cost-benefit analysis. Of course, an as-sessment of the impacts of treatment also provides valuable information about the impacts of the disease absent treatment and as such our results could be viewed as a lower bound for the labor supply declines due to HIV/AIDS as well. Estimates of these impacts also can contribute to the growing literature on the long-term micro-and macro-economic consequences of AIDS (for example, Bell, Devarajan, micro-and Gersbach 2003; Young 2005).
Labor is the central productive asset of the poor in most developing countries. In-deed, labor supply and related outcomes like income have been the focus of many studies that examine the impacts of nutrition, morbidity, and AIDS-related mortal-ity.4Because it is an important outcome, changes in the labor supply of adult AIDS patients also can generate intrahousehold spillover effects on time allocation patterns and influence other measures of household welfare.
Our analysis is based on data from a household survey we conducted in collabo-ration with a rural treatment program in western Kenya. Over the course of one year, longitudinal socioeconomic data were collected from AIDS patients who receive free treatment. These data have been linked to longitudinal medical data containing clin-ical and laboratory measures of the patients’ health status. The presence of individ-uals whose HIV status is known, the ARV treatment program, and the linked medical data combine to offer us a unique opportunity to measure the effects of treatment.
To identify the response to treatment, we examine changes over time in the labor supply of treated patients and their household members. Because ARV treatment el-igibility is defined by biological markers that are not easily influenced by the behav-ior of patients with late-stage HIV disease, the provision of treatment at our study clinic and the resulting changes in health are exogenous.5Using data collected
simul-taneously from a large random sample of nonpatient households, we control for time-varying factors (such as seasonality) that could bias the estimates. The analysis is strengthened by variation in the length of time that patients had been exposed to treatmentpriorto the start of our survey. As we show with the linked medical data, health has a nonlinear temporal response to treatment—it improves dramatically in the first months of treatment but more gradually thereafter. We exploit this nonline-arity to test for heterogeneous treatment responses in the labor supply of patients.
We find that the provision of ARV therapy leads to a large and significant increase in the labor supply of AIDS patients. This increase occurs very soon after the initiation of ARV therapy: Within six months, there is a 20 percent increase in the likelihood of participating in the labor force and a 35 percent increase in hours worked—an impres-sive 7.9 hours—during the past week. Since AIDS patients left untreated will
4. Yamano and Jayne (2004) examine the impacts of working-age adult mortality on a range of household outcomes including crop and nonfarm income. Beegle (2005) examines the impacts of adult mortality on the labor supply of household members.
experience continued declines in health and possibly death within six months, our es-timated labor supply responses are therefore underestimates of the impact of treatment on the treated. As such, we also calculate an upper bound of the impact of treatment on the treated by assuming that patients would be too sick to work (or even dead) without treatment. Clinical evidence on the evolution of untreated HIV disease suggests that this is a reasonable assumption, and that the upper bound estimate is close to the ‘‘true’’ impact of treatment on the treated. This upper bound is very large: over a period of six months, labor force participation for those initiating therapy at the beginning of our sur-vey increases by 85 percentage points and hours worked increases by 26 hours per week relative to what would have happened if AIDS had progressed untreated.
Given this effect on patients’ labor supply, treatment also can have spillover ben-efits within the household. However, an analysis of how ARV therapy influences the labor supply of treated patients’ household members is complicated, as the effects are theoretically ambiguous. On the one hand, the increase in a patient’s labor supply has anincome effectthat allows other household members to work less. On the other hand, the improvement in the patient’s health reduces the caretaking and housework burden on family members, thereby having atime endowment effectthat allows for more work and leisure. We find that the labor supply of younger boys in patients’ households’ declines after the initiation of ARV therapy, suggesting that the income effect from the treated patients’ increased labor supply dominates. In multiple-patient households, both younger and older boys, as well as other adults in the house-hold, work less after patients receive treatment. This suggests that intrahousehold decisions about time allocation are influenced by the provision of treatment, and that the welfare of some household members beyond the patient may increase consider-ably as a result. The effects on the labor supply of younger children are particularly important since they suggest, among other things, potential schooling impacts from treatment, and the returns to primary school education are especially large in devel-oping countries.
This paper is organized as follows: In Section II, we provide a brief overview of the key stages of HIV infection and the role of ARV therapy in treating infected indi-viduals. We then discuss our survey data in Section III. Section IV uses medical data from the HIV clinic where this study was conducted to show that measurable dimen-sions of patient health improve after initiation of treatment. We discuss our strategy for estimating the response in treated patients’ labor supply in Section V and present the results in Section VI. In Section VII, we examine the labor supply of children and adults living with ARV recipients. Section VIII concludes and discusses the policy implications of this research.
II. Background on HIV/AIDS and Antiretroviral
Therapy
Sub-Saharan Africa, most HIV transmission among adults occurs through sexual in-tercourse between men and women (UNAIDS 2006). Soon after transmission, infected individuals enter a clinical latent period of many years during which health status declines gradually and few symptoms are experienced. Median time from se-roconversion to AIDS in East Africa is estimated to be 9.4 years (Morgan et al. 2002).6 During this latency period, most HIV-positive individuals are unaware of
their status and physically capable of performing all normal activities.
Over time, almost all HIV-infected individuals will experience a weakening of the immune system and progress to developing AIDS. This later stage is very often as-sociated with substantial weight loss (wasting) and opportunistic infections such as P. carinii pneumonia, Kaposi’s sarcoma, and tuberculosis. In resource-poor settings, ab-sent treatment with ARV therapy, death usually occurs rapidly after progression to AIDS. One study in Uganda reports a median survival time of 9.2 months (Morgan et al. 2002) and another study in Brazil reports a median survival time of 5.1 months (Chequer et al. 1992). These estimates are not very different from those found for untreated populations in industrialized countries, where the estimated survival times following clinical diagnosis of AIDS are about one year (Lemp et al. 1990; Lee et al. 2001).
Highly active antiretroviral therapy7 has been proven to reduce the likelihood of opportunistic infections and prolong the life of HIV-infected individuals. After sev-eral months of treatment, patients are gensev-erally asymptomatic and have improved functional capacity. As we discuss in Section IV, individuals are considered eligible for ARV therapy after they progress to AIDS. Numerous studies in various countries and patient populations have reported positive results.8In Haiti, patients had weight gain and improved functional capacity within one year after the initiation of ARVs (Koenig, Leandre, and Farmer 2004). In Brazil, median survival time after develop-ing AIDS rose to 58 months with ARV therapy (Marins et al. 2003). Section IV documents similar health impacts for patients in our sample.
The price of ARV therapy in developing countries is an important issue in discus-sions about treatment provision. First-line ARV regimens used to cost more than $10,000 per patient per year. However, since 2000 widespread generic production of medicines has reduced these prices significantly, to as low as $140 (negotiated by the Clinton Foundation for treatment in selected countries) in 2004 (Gutierrez et al. 2004; Campaign for Access to Essential Medicines 2005). Further declines may be possible with greater generic competition and bulk purchasing agreements.
6. Conversion to HIV-positive serology normally occurs 4-10 weeks after transmission. The duration of the clinical latent period has been found to vary considerably, depending upon the mode of transmission and age at transmission (Collaborative Group on AIDS Incubation and HIV Survival including the CASCADE EU Concerted Action 2000). In developing countries, limited access to health care and greater burden of other infectious diseases may expedite the progression of HIV.
Expenditures on lab tests and HIV clinic operations also can be sizable, with the sum of these nondrug costs dependent on the treatment setting.
III. Sampling Strategy and Survey Data
The socioeconomic data used in this paper come from a household survey we conducted in Kosirai Division, a rural region near the town of Eldoret, in western Kenya.9 The Division has an area of 76 square miles and a population of 35,383 individuals living in 6,643 households (Central Bureau of Statistics 1999). Households are scattered across more than 100 villages where crop farming and animal husbandry are the primary economic activities and maize is the major crop.
The largest health care provider in the survey area is the Mosoriot Rural Health Training Center, a government health center that offers primary care services. The health center also contains a clinic that provides free medical care (including all rel-evant medical tests and ARV therapy) to HIV-positive patients. This rural HIV clinic (one of the first in Sub-Saharan Africa) was opened in November 2001 by the Aca-demic Model for the Prevention and Treatment of HIV/AIDS (AMPATH).10 Follow-ing increased fundFollow-ing since late 2003, the Mosoriot HIV clinic has experienced rapid growth: the number of patients has risen from about 150 in early 2003 to 2,149 in September 2005 (communication with AMPATH), with many patients coming from outside Kosirai Division. During this period, adequate funding has been available to provide free ARV therapy to all patients sick enough (according to WHO treatment guidelines that are discussed in the next section) to require it.11
We implemented two rounds of a comprehensive socioeconomic survey between March 2004 and February 2005, with an interval of roughly six months between rounds.12The survey sample contains two different groups of households. The first group comprises 503 households chosen randomly from a census of all households in Kosirai Division without an AMPATH patient (random sample households).13The second group comprises 200 households that were chosen at the clinic and contained at least one adult HIV-positive AMPATH patient who began receiving ARV therapy (ARV households) prior to Round 2. The ARV sample is part of a larger sample of
9. Kenya has an estimated 1.3 million HIV-infected individuals and an adult prevalence rate of 6.1 percent (UNAIDS 2006).
10. AMPATH is a collaboration between the Indiana University School of Medicine and the Moi Univer-sity Faculty of Health Sciences (Kenya). Descriptions of AMPATH’s work in western Kenya can be found in Mamlin et al. (2004), Cohen et al. (2004), and Einterz et al. (2007).
11. As of November 2005, ARV therapy was being provided to an estimated 55,000 out of 273,000 Ken-yans needing treatment (WHO 2006). About 17 percent of the KenKen-yans receiving ARV therapy are patients at one of AMPATH’s urban and rural clinics (based on AMPATH and Kenya statistics from June 2005). 12. Round 1 was between March and August 2004. Round 2 was between September 2004 and February 2005. The last month in each round contained the fewest interviews since they were mostly spent interview-ing the respondents who were not found earlier in the round. In the remaininterview-ing months, the number of inter-views was fairly uniform, with June and December somewhat less intensive (the latter due to holidays at the end of the month).
260 households containing at least one HIV-positive AMPATH patient (at various stages of HIV disease), all of whom were recruited at the Mosoriot HIV clinic.14,15 Allnonpregnant AMPATH patients who enrolled in the Mosoriot HIV clinic before April 2004 and resided in Kosirai Division were considered eligible for our survey because it would be possible for survey staff to visit these households at home. To obtain a larger sample size, we also conducted in-clinic interviews with a random sample of nonpregnant AMPATH patients who entered the clinic before April but re-sided outside Kosirai Division and too far away from the clinic to be visited at home. Pregnant women were excluded from the sample because treatment was typically given to these women for the prevention of mother-to-child transmission of HIV, not because the women had become sick enough to require ARV therapy.
Upon completion of the survey, we used the AMPATH Medical Records System (AMRS)—which contains clinical and treatment-related information on all patients— to establish which of the HIV-positive AMPATH patients in our sample were receiv-ing ARV therapy. It was established that out of the 260 households with AMPATH patients, there are 217 HIV-positive adults (from 200 households) who began receiv-ing ARV therapy at the Mosoriot HIV clinic prior to the Round 2 interview (we re-port the distribution of treatment start dates in Section IV).16 Attrition of entire households between rounds due to refusal or relocation is minimal in the random sample (seven out of 503 households), and attrition of individuals due to mortality is also negligible (seven out of 3,009 individuals). We discuss attrition of individuals for reasons such as marriage and employment in the next section. In the ARV sam-ple, a total of 22 patients attrite from the sample between rounds (ten due to mortal-ity, seven due to loss to followup17, and five due to relocation). In the analysis below, we attempt to correct for bias that may be introduced by this attrition. Furthermore, information on the key labor supply measures used as outcome variables is not avail-able for four patients in Round 2 (because they were away from the household for an extended period). This leaves a total sample of 191 adult ARV recipients who appear in both survey rounds.
The survey included questions about demographic characteristics, health, agricul-ture, income and employment. In the household visits, teams of male and female enumerators interviewed the household head and spouse as well as a youth in the household. For in-clinic interviews, all information was obtained from the AMPATH
14. We include in this sample two adults (and their household members) who were originally part of the random sample but enrolled in the AMPATH clinic and began receiving ARV therapy between rounds. As we discuss below, several other patients in the ARV sample also initiated ARV therapy between rounds. 15. The analysis in this paper excludes the 60 households with HIV-positive AMPATH patients who were in the early stages of HIV disease and were not yet sick enough to require ARV therapy (according to WHO treatment guidelines). We exclude this group from our analysis in this paper because these untreated HIV-positive patients would not have experienced significant health changes during the survey period. The small sample size of these HIV households also limits our ability to use them as a control group in the data anal-ysis. All analysis in the paper is thus restricted to the 200 households with ARV recipients and households from the random sample.
16. HIV-positive children of adult patients were not interviewed. Included among the 217 adults are house-hold members who were reported by the respondent to be HIV-positive ARV recipients and for whom an AMPATH identification number was found in the AMRS.
patient. In total, 81 percent of all survey households were visited at home. Height and weight measurements were made for children under the age of five years. Relevant outcomes such as asset sales and purchases, child anthropometrics, school enroll-ment and attendance, income, employenroll-ment, and food consumption were recorded in each round to obtain longitudinal data.
Table 1 provides an overview of the main characteristics of households in the ran-dom sample and ARV sample during Round 1. On average, households in the survey area have 6.04 members. ARV households tend to be significantly smaller, with 5.52 members on average. There are also significant differences in the sex and marital sta-tus of household heads and the orphan stasta-tus of children: ARV households are more likely to be headed by a woman who has lost her husband, whereas random sample households are generally headed by a married man. ARV households also own sig-nificantly less land and livestock, which is one of several indications from the survey that they are worse off than other households in the community.18
IV. ARV Therapy and Patient Health
The AMPATH Medical Record System (AMRS) contains longitudi-nal information on the health status of patients at AMPATH’s eight HIV clinics in western Kenya. Before estimating how labor supply responds to ARV therapy, we discuss evidence from the AMRS on the health response to treatment.
Since HIV enters and destroys T cells with the protein CD4 on their surface, the CD4+ T cell count is an important indicator of disease progression among HIV-infected individuals.19 HIV-infected individuals are considered to have developed AIDS when they have one of several opportunistic infections or a CD4 count below 200/mm3. It is at this stage when functional capacity deteriorates and, according to WHO guidelines (WHO 2002), patients should be initiated on ARV therapy.20
The CD4 count of AMPATH patients is monitored at intervals of roughly six months.21The AMRS also contains more frequent measures of the body mass index (weight/height2, BMI), a well-known indicator of short-term health for patients with AIDS (WHO 1995). Wools-Kaloustian et al. (2006) have recently analyzed longitu-dinal data for all nonpregnant adult patients treated with ARV therapy at AMPATH’s HIV clinics and found significant increases in the CD4 count and weight following the initiation of treatment. Because the exact timing of this health response among patients in our sample will be useful for motivating our strategy for estimating and interpreting the labor supply response to treatment, we focus here on the AMRS data from patients in our sample.
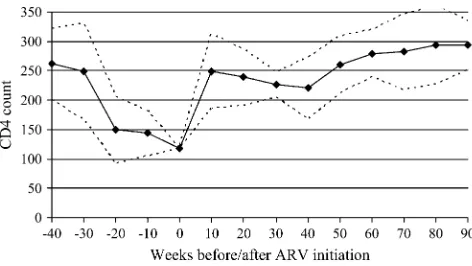
Figure 1, which shows the mean CD4 count in intervals of ten weeks before and after initiation of treatment (baseline), reveals a pronounced temporal pattern in
18. For further details on the household survey and the first round data, see Goldstein et al. (2005). 19. Most uninfected individuals have a CD4+ T cell count of 800-1000 per mm3of blood.
20. The WHO guidelines have been followed by many treatment programs in developing countries, includ-ing AMPATH. See Grubb, Perriens, and Schwartlander (2003) and Mamlin et al. (2004).
Random Sample ARV Sample
Mean Standard Error Mean Standard Error P-Value
Number of households 503 200
Household Structure
Household size 6.04 0.13 5.52 0.13 0.02
Average age of household members
Number of under-18 children 3.12 0.09 2.80 0.12 0.06
Number of under-18 children who are orphans 0.24 0.03 0.89 0.10 0.00
Number of extended family members in household 0.92 0.06 1.29 0.11 0.00
Number of children living outside household 1.92 0.12 1.68 0.17 0.28
Household head characteristics
Male household head 81% 53% 0.00
Single household head 22% 51% 0.00
Age of household head 47.9 0.68 45.4 0.98 0.04
Asset ownership (Round 1)
Quantity of land owned (acres) 6.82 0.47 4.87 0.64 0.02
Percent landless 13.4% 26.7% 0.00
Value of land owned (shillings) 650,237 44,416 572,772 80,052 0.37
Value of livestock owned (shillings) 61,401 4,194 40,041 5,047 0.00
Note:P-value fromt-test for equality of means for Random sample and ARV sample.
Thirumurthy
,
Graf
f
Zi
vin,
and
Goldstein
health status improvements experienced by patients at the Mosoriot HIV clinic.22 The response of CD4 count is highly nonlinear: at 10–20 weeks, the median CD4 count has risen to levels at which patients are generally asymptomatic. Subsequent changes are smaller and less consistent.23A similar nonlinear relationship is found for the BMI (not shown). As will be shown in the next section, this health response pattern has important implications for our identification strategy. The extremely low CD4 counts of patients at the time that treatment is initiated are also noteworthy, as it is suggestive of extremely low life expectancies absent treatment. We discuss the implications of this in subsequent sections.
Because patients do not have a CD4 count in every cell of Figure 1, the cross-sectional relationship shown may differ from the average experience of individual patients. Thus, restricting the analysis to all available post-treatment measures of CD4 count or BMI for the adult ARV recipients in our survey, we estimate the fol-lowing equation using patient fixed effects:
Figure 1
CD4 Count Before and After Initiation of ARV Therapy
Notes: Figure is generated using CD4 count data in the AMPATH Medical Records System forall
patients receiving ARV therapy at the Mosoriot HIV Clinic. The figure shows the average CD4 count (solid line) in ten-week intervals prior to each point in time before or after treatment initiation. The figure also shows the 95 percent confidence intervals (dashed lines) obtained from estimating a linear regression of individuals’ CD4 counts on dummy variables for each interval (with the omitted inter-val being the ten weeks prior to treatment initiation).
22. Due to the low frequency at which CD4 count is measured, we chose a group size that is large enough to produce a relatively smooth curve. When mean CD4 counts are calculated for intervals of less than ten weeks, the figure looks similar. Likewise, a similar pattern is evident when median CD4 counts are calcu-lated in each time interval.
Hit¼ai + b1ARVi;t23 + b2ARVi;t26 + b3ARVi;t29 + b4ARVi;t212
+ b5ARVi;t215 + b6ARVi;t218 + eit:
ð1Þ
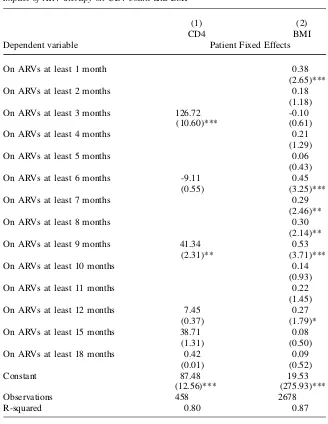
aiis a patient fixed effect,Hitis a measure of patienti’s health status (CD4 count or BMI) during the appointment at timet, andARVi,t-tindicates whether or not patientiwas re-ceiving ARV therapyt months prior to the appointment when health status is mea-sured.24,25 The omitted time period is the span of three months after initiation of treatment. Table 2 reports results from estimating Equation 1 with CD4 and BMI as the dependent variables (Columns 1 and 2, respectively). The increase in CD4 count dur-ing the first three to six months of ARV therapy is substantial (127/mm3) and statistically significant. After six months of treatment, marginal increases are smaller. For BMI, which is measured more frequently, we estimate a more continuous version of Equation 1 with additional time intervals. Here again, the largest increase occurs soon after initi-ation of treatment, but there are also significant increases in subsequent months.
Finally, for the 191 adult ARV recipients in our sample who appear in both survey rounds, Table 3 reports the number of days that they had been receiving ARV therapy relative to the Round 1 interview date. While the average number of days between Round 1 and the treatment initiation date is 172, we find substantial variation here: 19 percent had not yet initiated ARVs at the time of the Round 1 interview, and 26 percent had been on ARVs for fewer than 100 days. Figure 2 shows the density of days on treatment as of the Round 1 interview and further illustrates the variation within the sample of 191 ARV recipients. Table 3 also summarizes the available data on CD4 counts and BMI at time of treatment initiation, the Round 1 interview, and the Round 2 interview. The nonlinear temporal response of health status to ARV ther-apy (Figure 1) and the variation in treatment duration as of Round 1 (Table 2) illus-trates that treated patients in our sample experienced varying amounts of health improvement between the survey rounds. In the next section, we exploit this varia-tion to test for heterogeneous treatment responses in labor supply.
V. Estimation Strategy for Patients’ Labor Supply
Response
We primarily study two outcomes that measure an individual’s labor supply: an indicator of participation in any economic activities during the past week and the total number of hours worked in the past week. For all household members older than eight years, the survey recorded this information in each round for three types of activities: wage and salaried jobs, farming on the household’s owned or
24. Since there are very few patients withmultiplemeasurements of CD4 counts during the pre-treatment period, it is not possible to estimate the trajectory of CD4 count in this period with patient fixed effects. In cross-sectional regressions of CD4 count on weeks before initiation of ARV therapy, however, there is a significant overall negative trend in CD4 count prior to initiation (as shown in Figure 1).
Table 2
Impact of ARV therapy on CD4 count and BMI
(1) (2)
CD4 BMI
Dependent variable Patient Fixed Effects
On ARVs at least 1 month 0.38
(2.65)***
On ARVs at least 2 months 0.18
(1.18)
On ARVs at least 3 months 126.72 -0.10
(10.60)*** (0.61)
On ARVs at least 4 months 0.21
(1.29)
On ARVs at least 5 months 0.06
(0.43)
On ARVs at least 6 months -9.11 0.45
(0.55) (3.25)***
On ARVs at least 7 months 0.29
(2.46)**
On ARVs at least 8 months 0.30
(2.14)**
On ARVs at least 9 months 41.34 0.53
(2.31)** (3.71)***
On ARVs at least 10 months 0.14
(0.93)
On ARVs at least 11 months 0.22
(1.45)
On ARVs at least 12 months 7.45 0.27
(0.37) (1.79)*
On ARVs at least 15 months 38.71 0.08
(1.31) (0.50)
On ARVs at least 18 months 0.42 0.09
(0.01) (0.52)
Constant 87.48 19.53
(12.56)*** (275.93)***
Observations 458 2678
R-squared 0.80 0.87
rented land, and nonfarm self-employed work. Our measure of market labor supply is defined as the total hours devoted to all of these activities. Information on labor sup-ply of household members was typically provided by the household head, except in the case of clinic interviews, during which the patient provided all information about the household.26
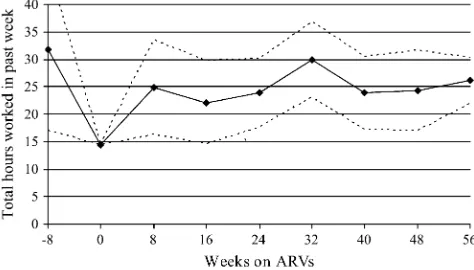
The first indication that ARV therapy influences labor supply is provided by Fig-ures 3 and 4, which combine data from the two survey rounds (for the ARV sample only) and plots the relationship between adult ARV recipients’ labor supply out-comes and time on treatment. The temporal pattern of labor force participation rates (Figure 3) and weekly hours worked (Figure 4) closely resembles the nonlinear re-sponse of medical outcomes. In this section, we discuss the main estimation strate-gies used to test the hypothesis that ARV therapy results in increased labor supply. Results from employing these strategies are presented in the next section.
The motivation for our empirical work comes from the following labor supply function, which is drawn from Strauss and Thomas (1998) and can be used to de-scribe the relationship between health and labor supply:
Table 3
Timing of Treatment Initiation Relative to Round 1 Interview Date
Treatment duration relative to Round 1 Mean Median
Standard deviation
Days on ARVs as of Round 1 interview (N¼191) 171.5 126 207.7 Distribution of days on ARVs as of Round 1 interview
<¼0 days 36 19%
0-100 days 50 26%
>100 days 105 54%
Health status at time of ARV initiation
CD4+ T-cell count (N¼144) 95.1 67 110.7
Health status as of Round 1 and Round 2
Round 1 Round 2
Mean Median
Standard
deviation Mean Median
Standard
deviation P-value
CD4+ T-cell count N¼132 N¼93
174.0 147.5 137.6 244.6 217 148.0 0.0003 Body mass index (BMI) N¼161 N¼161
20.5 20.1 3.4 21.7 21.3 3.4 0.0015
Notes:P-values are fromt-test for equality of means for Round 1 and round 2. The sample used in this table consists of the 191 adult ARV recipients who appear in both survey rounds. Data on CD4 count and BMI at the treatment initiation, Round 1, and Round 2, are not available for all patients in the sample.
L¼LðH;pc;wðH;X;a;ewÞ;X;jÞ:
ð2Þ
Labor supply (L) is affected by health (H) through two distinct channels: first, health can influence an individual’s productivity or real wage (w), and second, independent of its effect on wages, health can influence the marginal rate of substitution between consumption goods and leisure (if we assume that health, consumption, and leisure are all directly valued by the individual). A host of other factors also will influence labor supply, including the price of consumption goods (pc), individual and family characteristics (X) such as education, schooling, family background, and wealth, un-expected events (ew) such as weather shocks that influence labor demand, as well as unobservables such as ability (a) and tastes (j).
Estimating the total effect of health in a reduced form equation for labor supply is difficult for well-known reasons that are discussed in the literature: bias from omitted variables (such as ability) that are correlated with both wages and health, simultane-ity problems that arise from health and income influencing each other contempora-neously, and errors in the common measures of health. Because we are interested in estimating the reduced form effect of ARV treatment on labor supply, we overcome
Figure 2
Density of Days on Treatment as of Round 1 Interview
Figure 3
Labor Force Participation Rates Before and After ARV Therapy
Notes: Figure is generated using authors’ survey data and shows the average labor force participation rate (solid line) in eight week intervals prior to each point in time before or after treatment initiation. The figure also shows the 95 percent confidence intervals (dashed lines) obtained from estimating a linear regression of individuals’ labor force participation on dummy variables for each interval (with the omitted interval being the eight weeks prior to treatment initiation). The sample consists of the 191 ARV recipients who appear in both rounds of the household survey data.
Figure 4
Weekly Hours Worked Before and After ARV Therapy
these problems by taking advantage of the panel structure of our data and the exog-enous health improvement that occurs due to the provision of treatment. We now dis-cuss the identification strategy and the reduced form equations that we use to estimate the labor supply response to ARV treatment.27
We identify the response to ARV therapy by examining changes in the treatment group’s labor supply between rounds. Since labor supply is also influenced by several time-varying factors such as seasonality in agriculture (which influences local prices and labor demand) and aggregate health shocks (a greater malaria burden in specific months, for example), we include data from the random sample of adults to control for secular trends in the survey area. Thus, our key identifying assumption here is that data from the random sample control for the part of the ARV sample’s labor sup-ply trends that are due to factorsother thantreatment, such as seasonality. This strat-egy is similar to a difference-in-difference estimation stratstrat-egy in which the ‘‘comparison group’’ is the sample of adults from the random sample.28However, it should be noted that the labor supply trends in the random sample do not represent the counterfactual scenario of no treatment, and as such the reduced form empirical strat-egy we describe below estimates the treatment effect relative to baseline levels, but does not estimate the average treatment effect on the treated (the latter is discussed in Section VID). More formally, the reduced-form treatment response is identified by estimating individual fixed effects regressions in which a time interaction for ARV recipients measures the change in their labor supply between survey rounds:
Lit¼ai + b1ðARViROUND2tÞ + b2ROUND2t + +
10
t¼1gtMONTHtt + eit:
ð3Þ
Litis the labor supply outcome of interest for individualiin timet(Round 1 or 2),ai is a fixed effect for individual ithat captures the effects of time-invariant variables like demographic characteristics, schooling, family background, as well as unobserv-ables such as ability and tastes,ARViis an indicator variable equal to one if individ-ualiis an ARV recipient, andROUND2tindicates whether the observation is from Round 2.29 The Round 2 indicator and ten month-of-interview indicator variables (with one month from each round omitted to avoid singularity) together control
27. In an earlier version of the paper (Thirumurthy, Graff Zivin, and Goldstein 2005), we also estimated labor supply regressions in which the length of time on ARV therapy was used as an instrument for health status (measured by the CD4 count or body mass index). This instrumental variables (IV) approach, which estimates the relationship between health and labor supply, confirms that the reduced-form results obtained in this paper are largely driven by the health improvements associated with ARV therapy. We pursue the reduced-form estimation strategy here, as it more closely resembles the policy experiment that most people have in mind when debating the merits of providing ARV therapy to people with AIDS in Africa. 28. This also resembles the estimation strategy used by Jacobson, LaLonde, and Sullivan (1993). The authors use a longitudinal data set to estimate the temporal pattern in earnings losses of displaced workers. In their estimation strategy, one reason why nondisplaced workers are used as a comparison group to displaced workers is that it is important to control for macroeconomic factors that can cause changes in workers’ earnings.
29. This equation could also be approximated without individual fixed effects as:
ð3#ÞLit¼a+b1ARVi+b2ðARViROUND2tÞ+b3ROUND2t++
10
t¼1gtMONTH t t+eit;
for monthly fluctuations in labor supply in the entire community.30The coefficient of interest,b1, measures the average change in labor supply between rounds due to the
provision of ARV therapy.
The specification in Equation 3 is designed to capture the average labor supply re-sponse to treatment between survey rounds for all ARV recipients in the sample. How-ever, as noted earlier, patients have been on treatment for varying lengths of time during our Round 1 interviews and the largest health improvement occurs during the first three months of treatment. We would therefore expect the largest labor supply changes be-tween rounds to occur for patients in the early stages of treatment (assuming labor sup-ply responds to health changes with only a short lag). Since the size of our ARV sample does not provide us with enough statistical power to estimate heterogeneous treatment responses using time on treatment in Round 1 as a continuous variable, we employ a more parsimonious specification. We estimate a specification in which ARV recipients who were yet to begin treatment in Round 1 or had been on ARVs for less than 100 days in Round 1 (represented byARV,100
i ) can experience a different change in labor supply between survey rounds than ARV recipients who had been on ARVs for more than 100 days in Round 1 (ARV.100
i ). This distinction divides the ARV sample into two roughly equal samples, and distinguishes between patients experiencing large and small health improvements.31The following modified version of Equation 3 is thus estimated:
Lit¼ai + b1ðARVi,100ROUND2tÞ + b2ðARVi.100ROUND2tÞ
+ b4ROUND2t + +
10
t¼1gtMONTHtt+eit:
ð4Þ
Equation 4 allows us to take advantage of variation in the amount of health im-provement experienced by patients to establish whether there is a temporal pattern in the labor supply response to ARV treatment.32While the primary identification strategy in Equation 4 remains similar to Equation 3 in that we use longitudinal data
30. If the labor market impacts from ARV therapy were large enough to influence market wages (or local agricultural output prices), the random sample will also control for such aggregate effects. On the other hand, to the extent that certain aggregate health shocks disproportionately affect HIV-positive individuals such as the ARV recipients, data from the random sample alone will not adequately control for the labor supply effects of such shocks.
31. The Round 1 labor supply for patients in theARV<100group can be thought of as approximating their baseline (time of treatment initiation) labor supply. Some individuals in this group began treatment before the Round 1 interview and may have experienced some improvements in health and labor supply before our initial interview, Others will be about to begin treatment and would have health status and labor supply that is higher than on the day of treatment initiation. For such individuals, the approach in Equation 4 will likely underestimate the impact of treatment. For patients in theARV>100group, the Round 1 information
repre-sents their labor supply at a point in time that is well removed from the baseline date.
32. Since 19 percent of the ARV recipients in our sample began treatmentbetweenRounds 1 and 2 (with nearly all of them beginning treatment within two months after Round 1), it is possible to estimate treat-ment effects by exploiting within-person variation in treattreat-ment status during Rounds 1 and 2 (that is, by including a stand-alone dummy variableARVitin Equation 3). Given the concentration of health benefits
within the first six months of treatment, we estimate heterogeneous treatment effects in Equation 4 without including the dummy variable and instead treat individuals who are ‘‘close’’ to the start of treatment in Round 1 as one group. As we note in Section VI, the results are robust to the inclusion ofARVitin Equations
for the two treatment groups and correct for secular patterns in labor supply with data from the random sample, the interpretation ofb1andb2as indicating the temporal
pattern in the treatment effect relies on the assumption that the only important dif-ference between these two groups is the time they have been ‘‘exposed’’ to ARV treatment. Of particular concern is the scenario under which those patients who be-gan treatment long before Round 1 are better informed or better connected than those who began treatment shortly before Round 1. This does not appear to be the case, as the AMPATH medical records reveal no significant differences in the health status of patients in the two groups (as revealed by the CD4 count) at the time of treatment initiation. We also find no significant differences in other important characteristics of patients in the two groups. Both are indistinguishable with respect to education, household size and demographic characteristics, distance to clinic, and wealth meas-ures such as land and livestock holdings.33
While the division of ARV recipients into two samples will indicate whether there are heterogeneous responses during the post-treatment period, the use of 100 days as a cutoff for determining long and short duration of ARV therapy can be seen as arbitrary.34To trace the response of labor supply more carefully, we construct indi-cators of whether or not the patient has been receiving ARVs for incremental dura-tions of three months. The random sample is again used as a ‘‘comparison’’ group in this analysis to control for seasonality. Specifically, the following equation is estimated:
Lit¼ai+b1ARVi;t+ 3+b2ARVi;t23+b3ARVi;t26+b4ARVi;t29
+b5ARVi;t212+b6ARVi;t215+b6ROUND2t++ 10
t¼1gtMONTHtt+eit:
ð5Þ
ARVi,t-tindicates whether or not individualiwas receiving ARVstmonths prior to
the interview at timet(Round 1 or Round 2). In this specification, the outcomes of patients are compared at different times in the post-treatment period, with the period of three months before and after treatment initiation serving as the omitted time pe-riod.35Due to the relatively small number of patients in our sample who have been on treatment for more than 18 months, we do not add an additional term to capture the marginal effect of treatment during the post-18-month period, but instead allow it to be captured by the coefficient for theARVi;t215term. Data from adults in the
ran-dom sample again control for secular trends in the labor market.
The individual fixed effects in all of the equations estimated will allow for ARV recipients to have different levels of labor supply than other adults in the sample. While time varying factors such as seasonality are dealt with using the time
33. For each of these observed characteristics, we conductedt-tests and were unable to reject the hypoth-esis that the means for the two groups of ARV recipients are equal.
indicators, the key assumption in identifying the treatment response is that the ARV recipients in the sample do not have characteristics that influence thechangein labor supply between rounds. The only form of heterogeneity in the treatment response allowed by the equations above is in the temporal pattern of the response. In the anal-ysis below, however, we also test for heterogeneity in the treatment response accord-ing to the gender of the ARV recipient.
VI. Results for Adult Patients’ Labor Supply Response
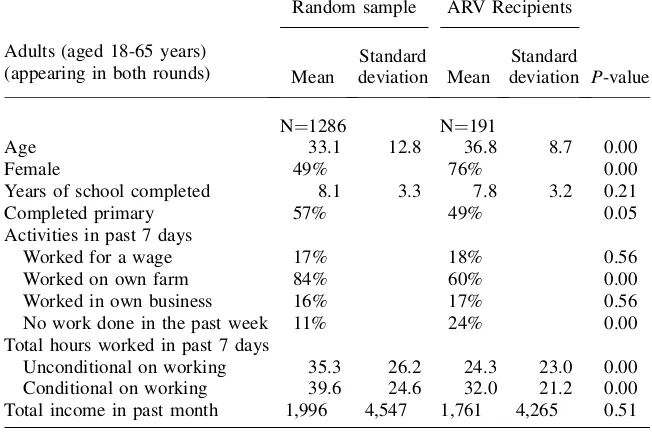
We restrict the analysis of labor supply to individuals between the ages of 18 and 65 who appear in both rounds.36Table 4 presents summary statistics from the first round for 191 adult ARV recipients and 1,286 adults in the random sample.37Crop farming is the primary economic activity of households in the survey area, as 84 percent of the random sample adults and 60 percent of adult ARV recip-ients reported having worked on their farm in the past seven days. A nontrivial frac-tion of adults also report working off-farm for a wage (17-18 percent) or in a household enterprise (16-17 percent).
Table 4 shows that in the first round, ARV recipients are significantly more likely tonothave done any work in the past week (24 percent of ARV recipients compared to 11 percent of adults in the random sample). ARV recipients also work significantly fewer hours than other adults, unconditional on participating in the labor force (24 hours compared to 35 hours) and conditional on participating (32 hours compared to 40 hours). Table 5 summarizes the respondents’ reported reasons for not having worked in the past week. Only 8 percent of unemployed adults in the random sample report being sick as the reason for not having worked. In contrast, being sick is the reported reason for 85 percent of unemployed adult ARV recipients. It also is inter-esting to note that the percentage of all random sample individuals not working for reasons other than illness is more than twice the figure for all ARV patients.
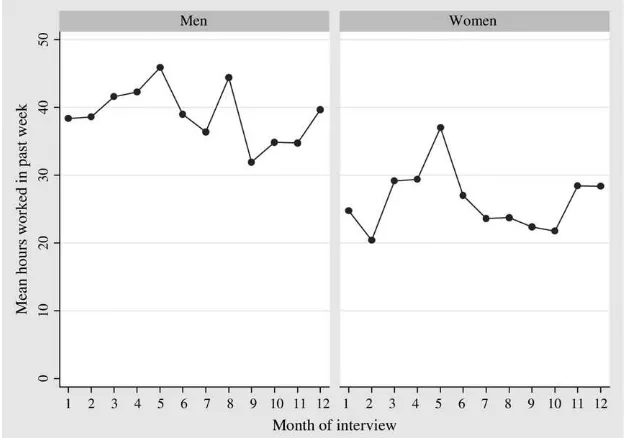
The data also show the importance of controlling for seasonal variations in labor supply. Figure 5 plots the average weekly hours worked in each month of the survey. There is a peak during the maize planting and harvesting seasons—the months of April and May (in Round 1) and November through January (in Round 2), respec-tively.38Because of the seasonality in agriculture and the reliance of most people
36. Adults who move into the household between rounds are thus excluded. Also, we exclude 115 adults who migrate out of the household permanently before Round 2 or who live in households that were not found in Round 2 (this includes the ARV recipients who were lost-to-followup by AMPATH). Finally, 43 adults are excluded because the respondent for the labor supply questionnaire did not know, in at least one round, how many hours the adult worked in the past week (possibly because the person migrated tem-porarily). Rates of absence from Round 2 due to reasons other than mortality do not differ significantly for ARV recipients and adults in the random sample. Even when we control for age, sex, and education, ARV recipients are not significantly more likely to be absent during the second round. The role of attrition due to mortality is discussed in Section VIC.
37. Household members of the ARV recipients are not included in any of this analysis. To the extent that labor supply of these adult household members is affected by the changing health status of the ARV recip-ient, pooling them with adults in the random sample may produce biased results.
on self-employed farming, for the most part we do not focus on outcomes such as income or wages.39Instead, most of our analysis below examines individuals’ labor force participation and hours worked.
A. Individual Fixed Effects Results
To identify the impacts of ARV treatment between the two survey rounds, we esti-mate labor supply regressions with individual fixed effects, as discussed in Section V. Table 6 reports results from estimating Equations 3 and 4. We find that ARV ther-apy leads to a large and statistically significant increase in labor supply. Adults
Table 4
Summary Statistics for Adult Labor Supply in Round 1
Adults (aged 18-65 years) (appearing in both rounds)
Random sample ARV Recipients
Mean
Standard deviation Mean
Standard
deviation P-value
N¼1286 N¼191
Age 33.1 12.8 36.8 8.7 0.00
Female 49% 76% 0.00
Years of school completed 8.1 3.3 7.8 3.2 0.21
Completed primary 57% 49% 0.05
Activities in past 7 days
Worked for a wage 17% 18% 0.56
Worked on own farm 84% 60% 0.00
Worked in own business 16% 17% 0.56
No work done in the past week 11% 24% 0.00
Total hours worked in past 7 days
Unconditional on working 35.3 26.2 24.3 23.0 0.00
Conditional on working 39.6 24.6 32.0 21.2 0.00
Total income in past month 1,996 4,547 1,761 4,265 0.51
Note:P-value fromt-test for equality of means for random sample and ARV recipients.
receiving treatment are 8.5 percentage points more likely to participate in the labor force in Round 2 than in Round 1 (Column 1), controlling for time-varying factors that are evident in both the ARV sample and the random sample. Hours worked in the past week also increases significantly between survey rounds, by 4.6 hours
Table 5
Reported Reasons for Not Working in the Past Week (Round 1 only)
Random sample ARV patients
Sample size (adults aged 18-65 years) 1286 191
Did no work in past week 10.8% 24.1%
Reported reason for not working in past week (N¼138) (N¼46)
Sick 8% 85%
Student 54% 0%
Housework 12% 0%
No work available 7% 7%
Other 18% 9%
Figure 5
Weekly Hours Worked by Month of Interview (Men and Women in Random Sample)
Table 6
Impact of ARV Therapy on Labor Supply, with Individual Fixed Effects
Dependent Variable:
(1) (2) (3) (4) (5)a
LFP Hours LFP Hours Hours
Individual fixed effects
Round 2 * Patient on ARVs 0.085 4.575
(2.42)** (1.88)*
Round 2 * Patient on ARVs < 100 days in Round 1
0.170 7.860 4.153
(3.07)*** (2.44)** (1.03)
Round 2 * Patient on ARVs > 100 days in Round 1
0.015 1.920 0.916
(0.38) (0.69) (0.31)
Constant 0.879 35.976 0.879 35.979 42.110
(38.68)*** (38.68)*** (39.28)*** (16.98)*** (17.53)***
Observations 2954 2954 2954 2954 2576
Number of adults 0.69 0.75 0.69 0.75 0.73
Notes: Errors clustered at the household level for each round and robustt-statistics in parentheses (* significant at 10 percent; ** significant at 5 percent; *** significant at 1 percent). Dependent variable LFP indicates whether the individual was engaged in any labor market activity in the past week and Hours is total number of hours devoted to labor market activities in the past week. Regressions include individual fixed effects, Round 2 indicator variable, and month-of-interview indicator variables. a. Column 5 excludes individuals who were not participating in the labor force in the first round of the survey.
The
Journal
of
Human
(Column 2). Relative to the levels in Round 1, this implies a large increase in labor supply for the entire sample of ARV patients: labor force participation rates rise by almost 11 percent, and weekly hours worked rise by 19 percent.
Columns 3 and 4 of Table 6 show a stronger and even more striking result. The individuals with by far the largest increase in labor supply between the two rounds are patients who began receiving ARVs less than 100 days prior to the Round 1 in-terview (a group that includes some individuals who began receiving ARV therapy shortly afterRound 1). The magnitude of these increases is substantial: Over the course of six months, patients who have just initiated ARV therapy show a 17 per-centage point increase in labor force participation rates and a 7.9 hour increase in hours worked.40Given Round 1 labor supply levels of 65.1 percent and 20.3 hours for this group, the estimates imply a 26 percent increase in participation rates and a 39 percent increase in hours worked. In contrast, the other ARV recipients in our sample show no statistically significant change in outcomes between rounds.41This temporal pattern in the labor supply response among treated patients very closely resembles the health responses (in BMI and CD4 count) reported in Section IV.
Since the regressions of hours worked includes individuals not participating in the labor force during Round 1, the results do not clearly establish whether the labor sup-ply response is also applicable to patients already working in Round 1. In Column 5 of Table 6, we present results for a restricted sample that includes only those adults who were participating in the labor force during Round 1. Since we do not find a sta-tistically significant effect on hours worked, the results suggest that the main treat-ment response occurs on the extensive margin of labor supply–allowing patients who were previously too sick and incapable of working to enter the labor force.
The results for ARV patients who have just initiated treatment are noteworthy since these patients are particularly sick before starting treatment and at the time of the Round 1 interview. As discussed earlier, in the absence of treatment these patients have a small probability of living for another six months, until the Round 2 interview date. In this sense, the estimated labor supply responses are likely to
beunderestimatesof the impact of treatment on the treated.42
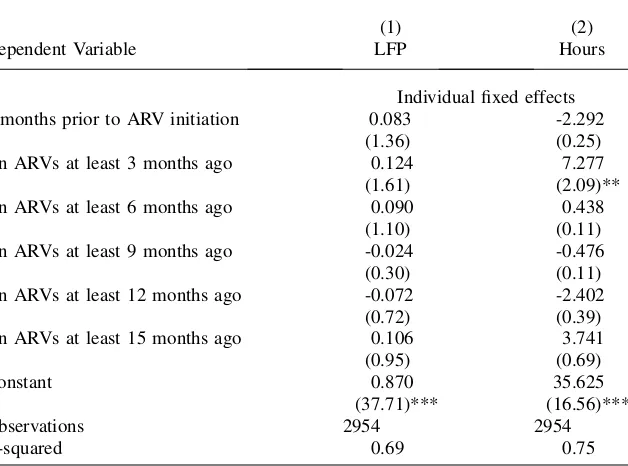
Table 7 reports the results from estimating Equation 5, with a more complete set of indicators to identify the temporal response to treatment. As Columns 1 and 2 show, the increase in labor supply is largest during the first three to six months of ARV therapy, with subsequent increases being smaller and statistically insignificant. The point estimates show that after three to six months on treatment, there is a 12.4
40. When we allow patients on treatment for 0-100 days in Round 1 to have a separate change in labor supply than patients who begin treatment between Rounds 1 and 2 (the treatment effect for the latter group being estimated by adding atARVitterm to Equation 4), we find that both groups have identical and
sig-nificant changes in labor force participation rates and that patients who begin treatment after Round 1 have a slightly larger increase in hours worked.
41. Comparisons of socioeconomic characteristics of the two groups of ARV recipients show that there are no statistically significant differences in the gender, education, and household characteristics such as house-hold size and ownership of land and livestock (results not reported). This implies that such characteristics cannot explain the large difference in the labor supply changes of the two groups.
percentage point increase in labor force participation rates (but not statistically sig-nificant at the 10 percent level) and a statistically sigsig-nificant increase of 7.3 hours in weekly hours worked. Compared to levels of labor supply for patients who are within three months before or after initiation of ARV therapy (the omitted group), this implies a 20 percent increase in the labor force participation rate and a 37 percent increase in hours worked.43
B. Decomposition of the Impact of ARV Therapy
The composition of adults’ economic activities exhibits considerable variation according to gender and seasons of the year. Moreover, households with ARV patients are less likely to be engaged in farming for reasons that may have to do with
Table 7
Estimating the Timepath of Labor Supply after Initiation of ARVs
Dependent Variable
(1) (2)
LFP Hours
Individual fixed effects
3 months prior to ARV initiation 0.083 -2.292
(1.36) (0.25)
On ARVs at least 3 months ago 0.124 7.277
(1.61) (2.09)**
On ARVs at least 6 months ago 0.090 0.438
(1.10) (0.11)
On ARVs at least 9 months ago -0.024 -0.476
(0.30) (0.11)
On ARVs at least 12 months ago -0.072 -2.402
(0.72) (0.39)
On ARVs at least 15 months ago 0.106 3.741
(0.95) (0.69)
Constant 0.870 35.625
(37.71)*** (16.56)***
Observations 2954 2954
R-squared 0.69 0.75
Notes: Errors clustered at the household level for each round and robustt-statistics in parentheses (* sig-nificant at 10 percent; ** sigsig-nificant at 5 percent; *** sigsig-nificant at 1 percent). Dependent variable LFP indicates whether the individual was engaged in any labor market activity in the past week and Hours is total number of hours devoted to labor market activities in the past week. Regressions include individual fixed effects, Round 2 indicator variable, and month-of-interview indicator variables.
their past health history and lower landholdings. In light of such differences, this sec-tion examines changes in labor supply more carefully, focusing on the composisec-tion of economic activities and differences between men and women.
1. Composition of Activities
Instead of using an aggregate measure of labor supply, we estimate Equation 4 sep-arately for each of the three different types of labor supply that were recorded in the survey: wage labor, farm labor, nonfarm business labor. Data from adults in the ran-dom sample are used to control for seasonal patterns in each of the labor activities. The results in Columns 1-3 of Table 8 indicate that much of the increase in labor supply occurs in nonfarm business work. Patients are more likely to begin doing wage labor and farm labor as well, but these increases are not statistically significant. All of these increases appear to occur among patients who are in the early stages of treatment in Round 1. The absence of a significant increase in farm work (which ar-guably requires the most physical labor) is noteworthy and seems to suggest that ARV therapy does not restore the ability of patients to do physical labor. However, when we limit our analysis to households that own three or more acres of land, ARV recipients are found to experience a significant increase in the likelihood of having done own-farm work and in hours worked on the farm. Thus, the lack of an aggregate treatment effect on farm work appears to be driven by the presence of ARV house-holds with small landholdings.
The results for monthly income from each of the three labor activities (Columns 4-6 in Table 8) underscore the significance of seasonality in interpreting income pat-terns. While farm income is known to be highly seasonal, nonfarm business income is less variable during the year. As a result, business income should be more respon-sive to short-term changes in health status. Indeed, we find there is a statistically sig-nificant increase in nonfarm business income for ARV recipients in the early stages of treatment (Column 6 in Table 8).
2. Labor Supply Impacts by Gender
The survey data from each round show that men are more likely to be engaged in labor market activities in the past week than women. In results not reported, we also find gender differences for some components of labor supply: women are much less likely to work for a wage, but equally likely to work in a nonfarm business. Thus it is possible that the impacts of ARV therapy on labor supply will differ according to the gender of the patient and the comparison group used. To test for such differences, we estimate Equation 4 separately for men and women.
Table 8
Impact of ARV Therapy on Components of Labor Supply
(1) (2) (3) (4) (5) (6)
Labor force participation (past week) Income earned (past month)
Dependent variable: Wage Farm Business Wage Farm Business
Individual fixed effects
Round 2 * Patient on ARVs < 100 days in Round 1
0.048 0.075 0.192 -140.112 -1,261.168 628.171
(1.10) (1.21) (3.05)*** (0.53) (2.13)** (1.70)*
Round 2 * Patient on ARVs > 100 days in Round 1
0.003 0.005 0.008 -142.712 121.958 147.198
(0.06) (0.09) (0.19) (0.57) (0.18) (0.57)
Constant 0.159 0.829 0.184 915.661 -1,079.609 610.083
(7.51)*** (27.02)*** (6.69)*** (5.86)*** (0.67) (2.97)***
Observations 2848 2848 2848 2848 2848 2848
R-squared 0.82 0.70 0.74 0.83 0.52 0.79
Notes: Errors clustered at the household level for each round and robustt-statistics in parentheses (* significant at 10 percent; ** significant at 5 percent; *** significant at 1 percent). Dependent variable Labor force participation indicates whether the individual was engaged in specific labor market activity (wage, farm, or business) in the past week and Income earned is total income earned from specific income labor market activity (wage, farm, or business) in the past month. Regressions include individual fixed effects, Round 2 indicator variable, and month-of-interview indicator variables. The sample sizes in each regression are smaller than 2,954 because information on income earned in each of three activities (wage labor, farm labor, and business labor) is not available for all adults in the random sample and ARV sample.
The
Journal
of
Human
in the labor force participation rate between rounds (a 35 percent increase relative to their average participation rate in Round 1), but no significant increase in weekly hours worked. Combining these results with Round 1 observations provides an intu-itive explanation for this pattern. Since men have high levels of participation to begin with, most of their response to improved health takes the form of additional hours worked. For women, initial participation is low, so labor supply is the natural margin for change.
C. Controlling for Attrition in the ARV Sample
Since our analysis so far has excluded ARV recipients who do not appear in our sam-ple for both rounds, the estimated labor supply responses apply only to those ARV patients who survived and continued to come to the clinic until Round 2. The average response to ARV therapy for all treated patients is therefore likely to be smaller.
In the ARV sample, mortality of patients and loss to followup are the main reasons for attrition of individuals (and households) between the two rounds of the survey. For patients who were interviewed at the HIV clinic in Round 1 but subsequently died or were lost to followup, we were unable to obtain any household information in Round 2. Patients who are lost to followup can be assumed to have either stopped seeking HIV care altogether, transferred to another clinic, or died (these patients
Table 9
Impact of ARV Therapy for Men and Women
(1) (2) (3) (4)
LFP Hours LFP Hours
Dependent variable: Men Women
Individual fixed effects
Round 2 * Patient on ARVs < 100 days in Round 1
0.048 12.734 0.218 5.263
(0.51) (1.69)* (2.87)*** (1.54)
Round 2 * Patient on ARVs > 100 days in Round 1
0.028 4.564 0.018 -0.368
(0.32) (0.69) (0.36) (0.12)
Constant 0.896 44.164 0.852 29.476
(28.95)*** (14.47)*** (25.83)*** (12.15)***
Observations 1408 1408 1546 1546
R-squared 0.69 0.75 0.69 0.70
have an average CD4 count of 79 at the time of the Round 1 interview). Of the 217 adult ARV recipients in our sample from Round 1, ten patients are known to have died before Round 2, and another seven patients were not found in Round 2 (due to loss to followup).
A conservative approach to estimating the average labor supply response to ARV therapy is to analyze the panel data while treating these attrited patients as individ-uals withzerolabor supply in Round 2. Since it is unlikely that all patients lost-to-followup are dead or not working in the labor market, this strategy provides us with a lower bound on the labor supply response.44As Table 10 shows, we find that even
with the inclusion of zero labor supply for patients who are deceased or lost to fol-lowup (Columns 3 and 4), there is a large and statistically significant increase in la-bor supply. All patients who had been on ARVs for fewer than 100 days in Round 1 experienced an 11.1 percentage point increase in labor force participation rates and a 6.7 hour increase in weekly hours worked (compared to 17.0 percentage points and 7.9 hours in Table 6, for the analysis without attrited patients). In regressions not reported here, we also use our rich data set of observable characteristics to model
Table 10
Impact of ARV Therapy with Attritors in the ARV Sample
(1) (2) (3) (4)
Dependent variable LFP Hours LFP Hours
Individual fixed effects
Sample includes Deceased Deceased and lost to FUP
Round 2 * Patient on ARVs < 100 days in Round 1
0.143 7.348 0.111 6.713
(2.57)** (2.34)** (1.99)** (2.23)**
Round 2 * Patient on ARVs > 100 days in Round 1
-0.011 1.530 -0.012 1.542
(0.26) (0.56) (0.28) (0.57)
Constant 0.876 35.825 0.874 35.700
(38.83)*** (16.79)*** (38.36)*** (16.67)***
Observations 2,974 2,974 2,988 2,988
R-squared 0.69 0.75 0.70 0.75
Notes: Errors clustered at the household level for each round and robustt-statistics in parentheses (* sig-nificant at 10 percent; ** sigsig-nificant at 5 percent; *** sigsig-nificant at 1 percent). Dependent variable LFP indicates whether the individual was engaged in any labor market activity in the past week and Hours is total number of hours devoted to labor market activities in the past week. Regressions include individual fixed effects, Round 2 indicator variable, and month-of-interview indicator variables.