Catalina Amuedo- Dorantes is professor of economics at San Diego State University. Almudena Sevilla is reader in economics at Queen Mary University of London. The authors would like to express their thanks for the fi nancial support provided by the Economic and Social Research Council (Grant Number ES/ K003127/1) and the Spanish Ministry of Education and Science (Project ECO 2012- 34828), and for com-ments from participants at the Hispanic Economic Issues Conference organized by The Americas Center at the Federal Reserve Bank of Atlanta in November 2010, at the 2010 Southern Economic Association meeting, and at the 2011 European Society of Population Economics meeting. The data are available from January 2015 through December 2017 from the authors.
[Submitted May 2012; accepted July 2013]
ISSN 0022- 166X E- ISSN 1548- 8004 © 2014 by the Board of Regents of the University of Wisconsin System
T H E J O U R N A L O F H U M A N R E S O U R C E S • 49 • 3
Parenting Investments of College-
Educated Mothers in the United States
Evidence from Time- Use Data
Catalina Amuedo- Dorantes
Almudena Sevilla
Amuedo-Dorantes and SevillaA B S T R A C T
This paper uses several decades of U.S. time- diary surveys to assess the impact of low- skilled immigration, through lower prices for commercial childcare, on parental time investments. Using an instrumental variables approach that accounts for the endogenous location of immigrants, we fi nd that low- skilled immigration to the United States has contributed to substantial reductions in the time allocated to basic childcare by college- educated mothers of nonschool- aged children. However, these mothers have not reduced the time allocated to more stimulating educational and recreational activities with their children. Understanding the factors driving parental- time investments on children is crucial from a child- development perspective.
I. Introduction
This paper examines how low- skilled immigration, via its effect on the cost of household services, may have impacted the allocation of time to child-care of mothers in the United States. Childchild-care is an important component of parental time. Unlike other types of home production, such as cleaning the house windows or maintaining a tidy home, childcare, and some types of childcare in particular (such as educational and recreational childcare), can prove particularly important for a child’s posterior intellectual and social development (for example, Hill and Stafford 1974; Leibowitz 1974; Del Boca, Flinn, and Wiswall 2010). Given the importance of in-tergenerational transmission of human capital in explaining children’s life outcomes, understanding the factors driving parental time investments on children and how their impact varies according to the educational attainment of mothers is crucial from a child development perspective and for policy- making aimed at reducing inequality.
A few papers show how large increases in low- skilled immigration over the past de-cades (in excess of 40 percent for the 1970–2000 time period) allowed for a substantial reduction in the price of locally traded goods and services that are immigrant- intensive in the United States. For instance, Cortés (2008) shows that the low- skilled immigration wave of the 1980–2000 resulted in an important reduction in the price of an agglomer-ate of nontraded goods and services by a city average of 9–11 percent. Immigrants are overrepresented in the childcare sector and immigrants employed in childcare are exces-sively low- skilled, as noted by Blau (2003) and Helburn and Howes (1996).1 Furtado and Hock (2009) fi nd that the low- skilled immigration wave of the 1980–2000 in the United States contributed to lower cost and increased availability of childcare services. In particular, it led to a 13.5 percent reduction in the median wage of workers employed in those services—the wage bill accounting for 60 to 80 percent of the operating ex-penses at formal and home- based childcare centers (Helburn and Howes 1996; Blau and Mocan 2002) and possibly more in informal childcare providers. More importantly, the increase in low- skilled immigration between 1980 and 2000 also reduced the wages of childcare workers at the 75th percentile by 9 percent. As such, the impact of low- skilled immigration was not only felt among childcare workers employed in what we might think of as low- quality childcare centers less likely to be servicing highly skilled moth-ers, but also among childcare workers in the higher income spectrum potentially servic-ing highly educated parents.2 This is expected if, as noted by Blau and Currie (2004), the alternative to high- quality childcare is not homecare but, rather, lower- quality childcare. In that case, lower- quality childcare ends up serving as a substitute to higher- quality childcare and reductions in the price of low- quality childcare will impact the demand for high- quality childcare and, ultimately, its price.
1. Blau (2003) further notes that childcare is one of the easiest occupations to enter. Regulations concerning the qualifi cations of childcare workers are inexistent at the federal level. At the state level, the regulations are often minimal and, in those states where they are tougher, the vast majority of childcare is unlicensed. Furtado and Hock (2009) report that in the year 2000, low- skilled immigrants with no postsecondary educa-tion represented 9.3 percent of childcare workers versus 6.2 percent of the workforce in the nonhousehold services occupations.
Using a time use model in the tradition of Becker (1965) and Gronau (1977), we show that lower prices for domestic services brought about by an increase in low- skilled immigration may have induced some mothers able to afford commercial child-care services to reduce the time allocated to providing childchild-care with a close market substitute, as is often the case with basic childcare consisting of bathing, feeding, or changing diapers. Owing to their ability to fi nance market- provided childcare services and the higher opportunity cost of their time, the aforementioned effect is more likely to take place among high- skilled or college- educated mothers.
We test these hypotheses using historical time use data from the American Heritage Time Use Surveys (AHTUS), which expand from the 1970s to the fi rst decade of the 21st century. The main instrument of all the surveys is an activity diary in which respon-dents record what they do for a consecutive period of 24 hours, which provides a quality measure of time dedicated to childcare activities. To identify a casual effect of low- skilled immigration on maternal time investments in children, we instrument for low- skilled immigrant concentration using information on the historical distribution of immigrants of a particular country as a predictor of current immigrant location choices (Card 2001).
We fi nd that increases in low- skilled immigration to the United States lowered the time allocated to basic childcare activities (as well as to home production) by native mothers with more than a high school degree by approximately half an hour per week. These fi ndings suggest that childcare services provided by low- skilled immigrants may serve as a good substitute for basic maternal childcare and routine housework activities but not for other types of childcare activities involving English profi ciency or a certain level of human capital, such as reading. We further show that these effects are unique to college- educated mothers with nonschool- aged children.
This paper adds in important ways to three different strands of literature. First, it contributes to the literature on the impact of low- skilled immigration. Most of the earlier literature examined the potential negative impact of low- skilled immigration on the employment and wages of natives (Card 2001; Borjas 2003). More recently, the in-terest has shifted to the positive potential effects of immigration on the cost of house-hold services (Cortés 2008; Furtado and Hock 2009) and on labor supply and fertil-ity (Cortés and Tessada 2010; Furtado and Hock 2010; Farré, Gonzalez, and Ortega 2011). In this paper, we examine for the fi rst time its impact on parenting investments. Our fi ndings complement those from Cortés and Tessada (2010), who using a different data source fi nd that low- skilled immigration to the United States increased the hours worked and reduced the time dedicated to housework of women with a professional degree or Ph.D. Likewise, we provide empirical evidence of one of the channels by which low- skilled immigration has reduced the work- fertility tradeoff facing educated women in the United States as argued by Furtado and Hock (2010)—namely through the reduction of some types of childcare and the time dedicated to home production.
fi ll this gap in the literature by providing direct evidence of the kind of tradeoffs that college- educated mothers face in terms of their use of time. Particularly, we fi nd that following a reduction in the price of market childcare services triggered by an increase in low- skilled immigration, these mothers reduce the time invested in basic childcare activities, but not the time allocated to more stimulating educational and recreational activities with their children. Nevertheless, their overall childcare time decreases.
Lastly, our fi ndings inform about the mediating role that low- skilled immigration may have had on the trends in the educational gradient in parental time. A series of papers have recently documented that more educated women devote more time to childcare activities than low- educated women (Sayer, Gauthier, and Furstenberg 2004; Guryan, Hurst, and Kearney 2008) and that this differential has increased over time in the United States (Ramey and Ramey 2009). The mechanisms behind these secular patterns are, however, still not well- understood. We fi nd that low- skilled immigration infl ows may have helped counteract the diverging patterns in basic childcare time among native mothers with different skills.
The paper is organized as follows. Section II describes the theoretical framework from which we derive some testable hypotheses regarding the impact of low- skilled immigration on the childcare patterns of mothers in the United States. Section III and Section IV describe the data and inform on some trends in time use, respectively. Sec-tion V discusses the methodology and SecSec-tion VI presents the fi ndings. Finally, Section VII summarizes our results and concludes the paper.
II. Theoretical Framework
We rely on a simple time- use model in the tradition of Becker (1965) and Gronau (1977), according to which a mother allocates her time to three compet-ing time uses: market work, leisure, and childcare. The main purpose of the model is to explain the differential impact that low- skilled immigration may have on mothers’ childcare provision depending on their educational attainment and the type of child-care at hand. We assume that mothers derive utility from well- child-cared- for children (c) and leisure (l):3
(1) U = U (c) + V (l)
where U and V are concave and increasing utility functions in c and l respectively. Well- cared- for children contribute to maternal utility in various ways. For example, children may increase the enjoyment that mothers derive from spending time with their children. Alternatively, well- cared- for children may increase maternal utility through other venues noted in the literature. For instance, mothers may altruistically care about their children and consider time with their children as an investment in their chil-dren’s human capital. Parents may also care selfi shly about their children’s future earn-ings potential; perhaps hoping that they may be able to help them out at an older age (Guryan, Hurst, and Kearney 2008). More important to us is the fact that well- cared- for children require parental time and/or the use of market- provided childcare services.
We can formalize this idea using a production function for well- cared- for children that calls for the use of market- provided childcare services (x) and parental time (h): (2) c= c(x,h)
where c takes the usual form of an increasing and concave function of x and h. Mothers maximize the utility function in Equation 1 subject to the production func-tion in Equafunc-tion 2, as well as time and budget constraints. Specifi cally, they have a total time endowment of 1 that they can use in the labor market (L), taking care of children (h), and/or leisure (l). They also face the following budget constraint:
px = w(1−h−l), where w is the market wage and p is the cost of market- provided
Equation 3 states that the marginal rate of substitution between parental childcare time (h) and commercial childcare (x) must equal their relative prices. 4
The fi rst prediction of the model is that the degree to which the demand for market- provided childcare rises with low- skilled immigration depends on the degree to which maternal and commercial childcare are substitutable. In terms of Equation 3, this prediction implies that, for the same reduction of maternal childcare time, mothers will need to be compensated with a bigger decrease in the price of those market child-care services (p) with few substitutes in the market. The degree to which maternal and commercial childcare can be considered substitutes depends on the kind of childcare in question. Low- skilled immigrant childcare workers may be in a better position to provide basic childcare consisting of changing diapers, bathing, dressing up, and feeding children rather than to provide educational or recreational childcare involv-ing readinvolv-ing in English or takinvolv-ing the child to activities with other English- speakinvolv-ing children and parents. Therefore, an increase in low- skilled immigration is expected to alter the maternal provision of basic childcare to a greater extent than the provision of other forms of childcare. Under certain conditions (for example, if maternal basic and educational childcare are substitutes), maternal educational and recreational childcare may increase as mothers free up their time from basic childcare activities.
The second prediction from this simple model is that a decline in the price of child-care services (p) brought about by an increase in low- skilled immigration raises the demand of commercial childcare services (x) and reduces maternal time (h) among college- educated mothers as long as h and x are substitutes in the production of
dren. This prediction follows from the fact that, as noted by Cortés and Tessada (2010) for household production services, commercial childcare services (x) are only used by women with a wage ( w≥w) that is high enough relative to the cost of market- provided
childcare services (p).5 These women are more likely high- skilled or college- educated mothers; therefore, Equation 3 only applies to them. A lower p is also expected to make market- provided childcare services affordable to some mothers who previously were unable to pay for it. However, once again, college- educated mothers with lower wages (perhaps they were starting their careers) that are, nevertheless, closer to the required threshold w to purchase commercial childcare services are more likely to fall
within that group. Overall then, via the aforementioned channels, an increase in low- skilled immigration is expected to reduce the time allocated to basic childcare by college- educated mothers.6
From a theoretical point of view, the predicted impact of low- skilled immigration on the time allocated to childcare by college- educated fathers should be identical to the impact experienced by mothers. As the market price of childcare drops, both moth-ers and fathmoth-ers should reduce the time they spend in basic childcare activities easily performed by low- skilled immigrant workers employed as nannies. Thus, we also run the analysis for fathers married to college- educated native mothers as a sensitivity analysis. However, we follow the literature on time uses in home production (for ex-ample, Cortes and Tessada 2010 for housework time) and focus our main analysis on the childcare provision of mothers for two reasons. First, mothers dedicate four times as much time to childcare than fathers. In fact, only one- fourth of fathers report ever doing any childcare during a regular diary day. Second, it is not clear that fathers’ educational attainment is the one that matters the most in the provision of childcare (for example, Breierova and Dufl o 2004; Schultz 2002).
III. Data
We use the American Heritage Time Use Study (AHTUS), a harmo-nized data set that covers fi ve decades and over fi ve time use surveys running from 1965 to 2003. The main instrument of all the surveys is an activity diary in which re-spondents record what they do for a consecutive 24- hour period. Each day of the week is equally represented in the survey. The methodological literature (for example, Rob-inson and Juster 1985; Juster 1985) shows that diary estimates of time spent on dif-ferent domestic activities provided by time surveys are more accurate than responses to questionnaire items.7 Similarly to retrospective questions on expenditure, time use information gathered this way runs into recall problems, which are accentuated due to the limited arithmetic facility and the diffi culty of individuals to assess the appropriate reference period limits. Thus, the same way money expenditure diaries have become
5. See Case number 2 in Appendix A to see the relative magnitude of the relative wage threshold w. 6. As in Cortes and Tessada (2010), within the group of mothers who are already purchasing commercial childcare services, those with lower salaries will reduce their own childcare provision by more than those with higher salaries when the cost of market- provided childcare services (p) falls.
the gold standard in the consumption literature, so have time- use diaries become the preferred method to gather information on time spent on market work, nonmarket work, and leisure. Most studies documenting long- term trends in how individuals use their time are now based on these data sets, including recent studies for the analysis of trends in time use and in childcare (for example, Guryan, Hurst, and Kearney 2008; Aguiar and Hurst 2007; Bianchi, Robinson, and Milkie 2006, Robinson and Godbey 1999).
Our primary sample of analysis includes observations from the AHTUS survey years 1975–76, 1992–94, and 2003. We do not include respondents from the 1965–66 AHTUS since it is too close to the year our instrument refers to (that is, 1960). Ad-ditionally, we are unable to use the 1985–86 AHTUS because it does not contain any information on the state of residence of the respondent, which is crucial for our iden-tifi cation strategy.8 Overall, our sample consists of 3,740 women. Because the 2003 data are from the fi rst year of the American Time Use Survey, it represents 75 percent of the overall sample (2,822 women). Sample sizes for earlier surveys are smaller (482 women in the 1970 AHTUS data and 436 women in the 1990 AHTUS data). Follow-ing the literature, we use the AHTUS weights to provide a representative picture of the population at hand (Aguiar and Hurst 2007).
Mothers between 21 and 55 years of age who have completed a 24- hour time diary are our group of interest. Following previous work by Furtado and Hock (2010), we focus our attention on non- Hispanic mothers. As noted by these authors, the restric-tion addresses important differences in social norms and peer effects when it comes to childrearing. More importantly for us is the fact that it allows us to obtain a closer es-timate of what the impact of low- skilled immigration might have been on the childcare practices of nonimmigrant mothers given that the AHTUS lacks information on the individual’s immigrant status and the bulk of low- skilled immigrants came from Latin America. Additionally, since the channel by which low- skilled immigration may be impacting the provision of childcare by mothers is through the reduction in the cost of commercial childcare services, we pay special attention to mothers of nonschool- aged children. After all, enrollment in public school, which starts at six years of age, may be thought of as inexpensive child supervision (Gelbach 2002). We also perform various robustness checks, including high- skilled mothers of older children and high- skilled fathers. Our main conclusions close the paper.
Our variable of interest is the time mothers report spending on childcare. Many of the tasks constituting childcare can be purchased in the market, and so economists often include childcare as another form of housework (for example, Burda, Hamer-mesh, and Weil 2008). Parents, however, report that spending time with their children is among their more enjoyable activities together with leisure activities, especially when compared with other standard home production activities (for example, Juster 1985; Robinson and Godbey 1999; Guryan, Hurst, and Kearney 2008; Krueger et al. 2009). As a result, in sharp contrast with the negative education and income gradient researchers have observed for the amount of time allocated to home production and leisure (for example, Robinson and Godbey 1999; Aguiar and Hurst 2007), childcare appears to rise with education and income (for example, Hill and Stafford 1974; Sayer, Gauthier, and Furstenberg 2004; Kimmel and Connelly 2007; Guryan, Hurst, and
Kearney 2008). In sum, parents view time caring for children as fundamentally differ-ent from either home production or leisure and more like an investmdiffer-ent.
We follow the usual practice in the time use literature and conceptualize time invest-ment in children as the total time during which any form of childcare is reported by the respondent as the primary activity during the designated day. Primary childcare activi-ties, however, cannot be equalized with time that parents spend with children. Indeed, there is some evidence that childcare reported as the primary activity signifi cantly under-reports total childcare time (for example, Budig and Folbre 2004; Folbre and Bittman 2004; Bianchi, Robinson, and Milkie 2006). As pointed out in Folbre and Yoon (2007), humans are multitasking beings whose activities often elude clear categorization. Two other ways to measure childcare in time diary surveys is to look at the so- called second-ary activity and at the information on who else is present when the activity takes place. In particular, for each primary activity, the respondent is asked a question about “what else” he or she is doing. This so- called secondary activity often includes childcare. Re-spondents are also asked who the activity is done with. Multiple individuals could be listed, including a child. Unfortunately, information on secondary activities or comple-mentary information on who else is present while the activity is taking place is not per-fectly comparable across the AHTUS surveys and is entirely missing for the 1990s, with no secondary information for the 2000s survey. Nevertheless, because primary childcare time requires direct interaction with the child, it is important in itself as it is considered to be the most stimulating for children. (See Guryan, Hurst, and Kearney 2008.)9
Inspired by the classifi cation used in Aguiar and Hurst (2007), we distinguish two broad types of childcare within primary childcare: basic childcare and educational/ recreational childcare. The former includes the physical care of children (bathing, dressing, feeding, changing diapers), organizing and planning for children and, over-all, looking after children. The latter includes activities such as reading to children, teaching children, attending meetings at a child’s school, playing games with children, playing outdoors with children, attending a child’s sporting event or dance recital, going to the zoo with children, and taking walks with children.10
Aguiar and Hurst (2007) note that there is some ambiguity about whether childcare is treated consistently across all surveys. Robinson and Godbey (1999) raise several con-cerns about the comparability of 1993 childcare measures to the measures of childcare in the other surveys. Egerton et al. (2006) also caution against making comparisons be-tween the 1993 and 2003 time- use surveys. To allow for more meaningful comparisons, we focus on two broad classifi cation of childcare activities, that is, basic and educational/ recreational childcare. Doing so allows us to avoid biases from changes in the classifi
ca-9. In contrast to time spent with children reported as primary activity in the diary, Guryan, Hurst, and Ke-arney (2008) use the most recent American Time Use Survey (ATUS) and fi nd that total time spent in the company of a child is the same for low and highly educated mothers. This fi nding is interpreted by the authors as suggestive that highly educated parents view childcare as an investment in which it is important to devote their active attention.
tion of time- use activities over time (with some activities disappearing and new activities emerging- just as in the case of expenditure diary categories in expenditure surveys). Yet, as Aguiar and Hurst (2007) point out, to the extent that low- and highly educated individuals are affected by data collection methods in the same way, the differential im-pact that low- skilled immigration might have on childcare according to maternal educa-tional attainment in any given year should remain unaffected. We further include survey fi xed- effects in the regression analysis to address any changes in survey methodologies.
IV. Some Descriptive Statistics on Childcare Trends
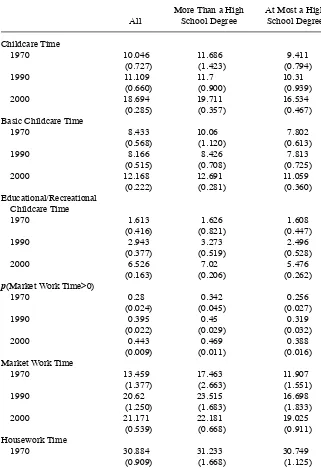
Table 1 displays the trends in childcare practices of mothers with chil-dren under the age of 6 during the past three decades by mother’s educational attain-ment. We separate basic from educational and recreational childcare and distinguish by mothers’ educational attainment. In addition, to provide us with a full picture of these women’s time uses, Table 1 displays the time dedicated by our sample of mothers to market work, housework, and any other activities. Henceforth: residual time.11 And, as it is commonly done in the literature, we compare mothers with more than a high school degree—to whom we refer to as “college- educated mothers” as they have, at the minimum, some college education—to mothers with, at most, a high school degree.
A few fi ndings are worth discussing. First of all, college- educated mothers spent more time than their less- educated counterparts in both basic and educational or rec-reational childcare throughout the time period under examination. Secondly, while all mothers increased the time allocated to both types of childcare, the increase in educa-tional and recreaeduca-tional childcare was especially large among college- educated moth-ers. Among them, educational and recreational childcare rose by 338 percent—from 1.6 hours/week to 7 hours/week, as opposed to the 241 percent increase experienced by their less- educated counterparts. In contrast, less- educated mothers increased the time dedicated to basic childcare by 42 percent, whereas their college- educated coun-terparts raised it by approximately 26 percent.
In addition to the increase in childcare time, the fi gures in Table 1 reveal the well- known increase in time devoted to market work and the reductions in time allocated to home production. While both college- educated mothers and their counterparts with at most a high school education cut down the time invested in home production by similar amounts, less- educated mothers experienced much larger increases in the time allocated to market work (which increased by 58 percent as opposed to 29 percent for more educated mothers). Still, less- educated mothers continued to work, on average, less time than their more educated counterparts.
In sum, the time allocated to both types of childcare signifi cantly rose over the time period under analysis for all mothers. Nevertheless, the increase in educational/recre-ational childcare was particularly noticeable—even more so among college- educated mothers. In what follows, we explore the role that immigration, through its effect on lowering the price of domestic services, may have had in shaping the time allocated to different types of childcare according to mothers’ educational attainment.
Table 1
Time Use Trends of Mothers with Children Ages 0–5 by Educational Attainment
All
More Than a High School Degree
At Most a High School Degree
Childcare Time
1970 10.046 11.686 9.411
(0.727) (1.423) (0.794)
1990 11.109 11.7 10.31
(0.660) (0.900) (0.939)
2000 18.694 19.711 16.534
(0.285) (0.357) (0.467)
Basic Childcare Time
1970 8.433 10.06 7.802
(0.568) (1.120) (0.613)
1990 8.166 8.426 7.813
(0.515) (0.708) (0.725)
2000 12.168 12.691 11.059
(0.222) (0.281) (0.360)
Educational/Recreational Childcare Time
1970 1.613 1.626 1.608
(0.416) (0.821) (0.447)
1990 2.943 3.273 2.496
(0.377) (0.519) (0.528)
2000 6.526 7.02 5.476
(0.163) (0.206) (0.262)
p(Market Work Time>0)
1970 0.28 0.342 0.256
(0.024) (0.045) (0.027)
1990 0.395 0.45 0.319
(0.022) (0.029) (0.032)
2000 0.443 0.469 0.388
(0.009) (0.011) (0.016)
Market Work Time
1970 13.459 17.463 11.907
(1.377) (2.663) (1.551)
1990 20.62 23.515 16.698
(1.250) (1.683) (1.833)
2000 21.171 22.181 19.025
(0.539) (0.668) (0.911)
Housework Time
1970 30.884 31.233 30.749
(0.909) (1.668) (1.125)
V. Methodology
A. Model Specifi cation and Testable Hypotheses
We are interested in examining the impact that low- skilled immigration, through its reduction of the price of household services, has had on the childcare time allocation of mothers of nonschool- aged children in the United States. Because we lack detailed information on the price of household services for the time period under analysis at a disaggregate level, we follow the literature and estimate a reduced- form equation where the main explanatory variable is the share of low- skilled immigrants at the region- decade level. As mentioned in the Introduction, the justifi cation for this anal-ysis stems from the already existing evidence on how low- skilled immigration reduced the price of nontraded goods and, in particular, domestic and childcare services in the United States (for example, Cortés 2008; Furtado and Hock 2009). These authors show that a higher share of low- skilled workers and, in particular, immigrant workers lowered the price of domestic services, including childcare, and increased its avail-ability.12 Lower prices and higher availability of market- provided childcare services
12. Although our unit of analysis differs from that of Furtado and Hock (2009), who focus on large metro areas as opposed to states, we fi rst confi rm the negative impact of an increase in low- skilled immigration on the wages of childcare workers over the time period under consideration. We do so by regressing the log median hourly wages of childcare workers in state s and year t on the share of low- skilled immigrant workers in the labor force in state s and time t. Results are shown in Table B2 in the appendix. Given the semi- log specifi cation of the wage regression, the estimated coeffi cient represents the percentage change in the wages of childcare workers caused by a one percentage point increase in the share of low- skilled immigrants. Dur-ing the period under examination, the low- skilled immigrant share rose from 4.2 percent in 1970 to about 6.1 in 2000. We estimate the model via ordinary least squares (OLS) as well as using instrumental variable (IV) methods to account for the endogeneity of the share of low- skilled immigrants. Based on the IV estimates,
All
More Than a High School Degree
At Most a High School Degree
1990 25.896 25.282 26.728
(0.825) (1.054) (1.330)
2000 24.367 24.422 24.25
(0.356) (0.418) (0.661)
Residual Time
1970 113.611 107.618 115.934
(1.210) (2.210) (1.479)
1990 110.375 107.504 114.264
(1.098) (1.397) (1.748)
2000 103.564 101.476 107.996
(0.474) (0.554) (0.869)
Observations 3740 2362 1378
should, in turn, induce mothers to purchase those services and reduce their childcare time, other things equal. We thus look at how low- skilled immigration may be im-pacting the time allocated to different types of childcare by mothers’ education in the United States via its demonstrated impact on the price of domestic services. We model the impact of low- skilled immigration on the time dedicated by college- educated mothers of nonschool- aged children to childcare by:
(1) CCist=␣ist+*Sharest+Xist' +s+t +ist
where i stands for the individual woman, s indicates the state of residence, and t the time (in our case decade) to which the observation refers to. CCist stands for the type of childcare time at hand. The vector Xist contains individual level information, such as age, a dummy variable for whether the respondent is white, the number of adults living in the household, the number of children under the age of 6, the age of the youngest child, and dummy variables indicative of whether the time use referred to a week day and whether the diary was collected during the summer months.13 The vec-tors s and t refer to the state and time (or survey) fi xed- effects, respectively. We allow the disturbance term to be correlated across individuals (and over time) in the same state.
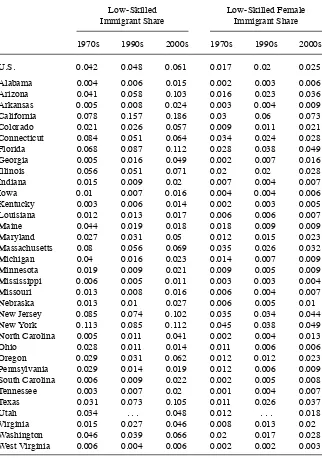
Our key regressor is the variable Sharest, which stands for the share of low- skilled (that is, noncollege- educated with at most a high school diploma) immigrant workers in the labor force in state s and time t. As such, the estimated coeffi cient β informs about the impact that an increase in the share of low- skilled immigrant workers has on the childcare patterns of college- educated women. As shown in the fi rst row of Table 2, this share, which we construct using Census data to minimize any attenuation biases,14 increased from an average of 4.2 percent in 1970 to almost 6.1 percent by the year 2000. The fi rst three columns of Table 2 also reveal the state- level variability in the share of low- skilled immigration over the time period under consideration. For instance, while California displays the largest share of low- skilled immigrants by the year 2000 (followed by New York and Florida), it is not among the three states expe-riencing the major growth spurs in low- skilled immigration between the 1970s and the 2000s. Rather, states like Georgia, North Carolina, and Texas witnessed increases in low- skilled immigration of over 200 percent (in Georgia and North Carolina these increases were above 700 percent), whereas some large immigrant states, like New York, did not experience a signifi cant change in their low- skilled immigrant shares. Finally, some states, like Maine, Massachusetts, Michigan, Ohio, or Pennsylvania, saw their share of low- skilled immigrants fall.
The last three columns of Table 2 also display like fi gures for the share of low- skilled female immigrants—an alternative share used in the main analysis as a robust-ness check on the basis that the vast majority of low- skilled immigrants employed in childcare are likely to be female. Percentage- wise, the average increase in this share over the time period under consideration is rather similar to the one displayed by the
for which we use the same instrument we employ in estimating Equation 1 above, this increase lowered the median wage of childcare workers by approximately 7 percent.
13. Table B3 in Appendix B contains the means and standard deviation for these regressors.
Table 2
Trend in the Share of Low- Skilled Immigrants
Low- Skilled Immigrant Share
Low- Skilled Female Immigrant Share
1970s 1990s 2000s 1970s 1990s 2000s
U.S. 0.042 0.048 0.061 0.017 0.02 0.025
Alabama 0.004 0.006 0.015 0.002 0.003 0.006
Arizona 0.041 0.058 0.103 0.016 0.023 0.036
Arkansas 0.005 0.008 0.024 0.003 0.004 0.009
California 0.078 0.157 0.186 0.03 0.06 0.073
Colorado 0.021 0.026 0.057 0.009 0.011 0.021
Connecticut 0.084 0.051 0.064 0.034 0.024 0.028
Florida 0.068 0.087 0.112 0.028 0.038 0.049
Georgia 0.005 0.016 0.049 0.002 0.007 0.016
Illinois 0.056 0.051 0.071 0.02 0.02 0.028
Indiana 0.015 0.009 0.02 0.007 0.004 0.007
Iowa 0.01 0.007 0.016 0.004 0.004 0.006
Kentucky 0.003 0.006 0.014 0.002 0.003 0.005
Louisiana 0.012 0.013 0.017 0.006 0.006 0.007
Maine 0.044 0.019 0.018 0.018 0.009 0.009
Maryland 0.027 0.031 0.05 0.012 0.015 0.023
Massachusetts 0.08 0.056 0.069 0.035 0.026 0.032
Michigan 0.04 0.016 0.023 0.014 0.007 0.009
Minnesota 0.019 0.009 0.021 0.009 0.005 0.009
Mississippi 0.006 0.005 0.011 0.003 0.003 0.004
Missouri 0.013 0.008 0.016 0.006 0.004 0.007
Nebraska 0.013 0.01 0.027 0.006 0.005 0.01
New Jersey 0.085 0.074 0.102 0.035 0.034 0.044
New York 0.113 0.085 0.112 0.045 0.038 0.049
North Carolina 0.005 0.011 0.041 0.002 0.004 0.013
Ohio 0.028 0.011 0.014 0.011 0.006 0.006
Oregon 0.029 0.031 0.062 0.012 0.012 0.023
Pennsylvania 0.029 0.014 0.019 0.012 0.006 0.009
South Carolina 0.006 0.009 0.022 0.002 0.005 0.008
Tennessee 0.003 0.007 0.02 0.001 0.004 0.007
Texas 0.031 0.073 0.105 0.011 0.026 0.037
Utah 0.034 . . . 0.048 0.012 . . . 0.018
Virginia 0.015 0.027 0.046 0.008 0.013 0.02
Washington 0.046 0.039 0.066 0.02 0.017 0.028
West Virginia 0.006 0.004 0.006 0.002 0.002 0.003
share of low- skilled immigrants (that is, in the order of 45 percent). Likewise, Geor-gia, North Carolina, and Texas are the three states experiencing the largest increase in that share between the 1970s and the 2000s.
As noted earlier in the discussion of our model, not all childcare services are good substitutes for parental childcare. Time spent reading a book might not be easily sub-stitutable, even more so if low- skilled immigrant nannies are not profi cient in English. As such, some college- educated mothers might take advantage of cheaper childcare services and reduce the time they spend on basic childcare, but not the time spent on educational and recreational activities. Thus, we estimate Equation 1 separately for each type of childcare.
Likewise, we estimate Equation 1 separately for mothers with up to a high school degree and college- educated mothers with more than a high school degree. As previ-ously discussed, the impact of a low- skilled immigrant shock is likely to vary with mothers’ educational attainment. A higher share of low- skilled immigrant workers may actually reduce the employment opportunities available to less- educated mothers and, consequently, the opportunity cost of taking care of their own children. Hence, the coeffi cient β may be either positive or nonstatistically different zero for that group of mothers. In contrast, a higher share of low- skilled immigrant workers (more likely to be complementary to high- skilled labor) may actually increase the employment op-portunities available to college- educated mothers and, in turn, the opportunity cost of staying home taking care of nonschool- aged children. Furthermore, these mothers are more likely to be able to afford market- provided childcare services. Therefore, we would expect β < 0 for college- educated mothers when basic childcare is the dependent variable.
B. Econometric Challenges
The estimation of Equation 1 poses a major challenge. Because immigrants are not randomly distributed across the United States but, rather, choose to locate in thriving states where mothers (and, even more so, college- educated mothers) are more likely to be at work and request childcare services, low- skilled immigration is likely to be endogenous to the time spent on childcare. Ordinary least squares (OLS) estimates are thus likely to suffer of a downward bias, particularly among college- educated women for whom the opportunity cost of their time rises during an economic boom. To deal with this problem, we instrument for the location of immigrants using information on the historical distribution of immigrants of a given country. Specifi cally, following Furtado and Hock (2010) and inspired in other studies in the literature that rely on the propensity of new immigrants to locate in areas where they have country networks as a justifi cation for their choice of instruments (for example, Bartel 1989; Massey et al. 1993; Munshi 2003; Card 2001; Cortés 2008; Cortés and Tessada 2010, among many others), we construct the following instrument:
(2)
c
∑
immigrantscs1960immigrantsc1960 *⌬Lowskill immigrantsct
repre-sents the net change in the number of low- skilled immigrants in the labor force from country c between 1960 and time t, where t refers to 1970, 1990, and 2000, and low- skilled immigrants are those with at most a high school education. Both terms are constructed using Census data.15 The instrument is then merged to the ATHUS data by state and decade. In particular, the instrument constructed using information from the 1970 Census is merged to the 1975–76 AHTUS time use data (“1970”), the IV con-structed using information from the 1990 Census is merged to the 1992–94 AHTUS (“1990”), and the IV constructed using information from the 2000 Census is merged to the 2003 AHTUS (“2000”).16
For the above to be a valid instrument, it needs to be related to mothers’ childcare patterns only through the allocation of low- skilled immigrants across states. Note that the empirical analysis already includes state and time dummies. Therefore, we already control for state specifi c characteristics and for overall economy- wide trends over the time period under consideration. Yet, as noted by Cortés (2008) and Furtado and Hock (2010), it still has to be the case that: (a) the initial distribution of immigrants is uncorrelated with differential changes in relative economic conditions affecting the demand for childcare services states 10 to 40 years later, and (b) differential economic changes among states should not affect the overall infl ow of low- skilled immigrants to the United States. To increase the likelihood that these conditions are met, we include some additional controls.
First, we address the possibility that regions where immigrants migrated to in 1960 were economically booming regions that would have experienced an increased in the demand for market childcare services by college- educated mothers (perhaps as they become more likely to join the labor market ranks) regardless of immigrant concen-tration. To alleviate this concern, in an alternative specifi cation (what we will refer to as Specifi cation 2 in what follows), we also include information on two variables intended to refl ect an economically booming region: (a) the share of working- age women with a college degree in each state in 1960, and (b) the share of working- age women with at least a college degree who participate in the labor force in each state in 1960.17 Both controls are also interacted with time dummies to account for differences in initial conditions at the state- level potentially correlated over time.
Additionally, we foresee the possibility that our instrument could be capturing labor demand shocks to industries that have been persistently important in those states at-tracting most immigrants in our sample. It is worth noting, however, that much of the increase in the share of low- skilled immigrants in the 1960s resulted from the imple-mentation of guest worker programs, such as the Bracero program spanning from 1942 to 1964, which recruited only male workers less likely to be employed in childcare services (Gonzalez 2006; Gonzalez and Fernandez 2003). Nevertheless, in the alterna-tive specifi cation, we also include information on the following three variables,
con-15. We obtain similar results when we use the stock of low- skilled immigrants, as opposed to the fl ow of low- skilled immigrants, in the construction of the instrument (results available upon request).
16. While there is an inevitable lag between the Censuses and the AHTUS surveys, it should not signifi cantly impact our estimates given the small changes in the share of low- skilled immigrants at the state level within a 2–6 year period.
structed for each state using 1960 data and intended to capture labor demand shocks to industries in the states where immigrants reside: (a) the share of the labor force employed in the high- skilled service sector, (b) the share of the labor force employed in the low- skilled service sector, and (c) average hourly wages for people with at least a college degree.18 All three regressors are also interacted with the time dummies to, again, capture state- level differences in initial conditions that are correlated over time. Lastly, previous research has indicated that early access to the pill drove trends in fertility and female supply. We thus create a dummy variable indicative of whether the state had legalized the pill by 1960. According to Bailey (2006), only two states had done so: Alaska and Arkansas. We interact that dummy with the time dummies as well. A fi nal concern worth discussing is whether natives are responding to the location choices made by immigrants and migrating internally to regions where they do not compete with immigrants. Note, however, that even if that is the case, they are most likely less- educated natives fearing labor market competition, not the college- educated mothers we are primarily focusing on. Furthermore, if labor mobility dissipates the effects of immigration fl ows, our estimates should work as lower- bound estimates of the total impact of low- skilled immigration on the time dedicated by college- educated mothers to various types of childcare.
VI. Findings
Table 3 shows the OLS and IV results from estimating Equation 1 for our main sample of college- educated non- Hispanic mothers of nonschool- aged chil-dren using the share of low- skilled immigrants as our key regressor. We present two different OLS specifi cations. The fi rst specifi cation in Column 1 coincides with Equa-tion 1, whereas the second specifi cation in Column 2 adds the state- time controls dis-cussed in the previous section. These include: the share of working- age women with college in each state in 1960, the share of working- age women with at least a college degree who participate in the labor force in each state in 1960, the share of the labor force employed in the high- skilled service sector, the share of the labor force em-ployed in the low- skilled service sector and average hourly wages for people with at least a college degree. All these regressors are also interacted with survey fi xed- effects for the 1970s, 1990s, and 2000s decades.
Differences in the coeffi cients between the fi rst and second OLS specifi cations are minimal. The same is true for the IV specifi cations with and without aggregate con-trols. Therefore, Column 3 displays the results of estimating Specifi cation 2 using IV methods. The bottom rows in Table 3 display the fi rst- stage results. The coeffi cient on the IV is positive and highly signifi cant at the 1 percent level. In particular, it indicates that an additional 10,000 low- skilled immigrants in the labor force from country c
in state s between 1960 and time t, increases the share of low- skilled immigrants in state s at time t by about 7 percent.19 The second to last row in Table 3 shows that the
18. Controlling for the share of the labor force employed in the service sector also helps address the fact that differences in that sector are important drivers of regional differences in the demand for female labor (Olivetti and Petrongolo 2008).
Table 3
Time Use of Mothers with More than a High School Degree and the Share of Low- Skilled Immigrants (Mothers with Children 0–5)
OLS IV
1 2 3
Independent Variable Total Childcare Time
Low- skilled immigrant share –15.707*** –15.706*** –17.795***
(5.852) (5.898) (5.831)
Independent Variable Basic Childcare Time
Low- skilled immigrant share –25.679*** –25.679*** –30.510***
(3.579) (3.603) (3.780)
Independent Variable Educational/Recreational Childcare Time Low- skilled immigrant share 9.972** 9.972** 12.715*
(4.082) (4.110) (6.593)
Independent Variable p(Market Work Time)>0
Low- skilled immigrant share 0.179 0.179 0.339
(0.150) (0.151) (0.228)
Independent Variable Market Work Time
Low- skilled immigrant share 6.937 6.936 7.06
(6.422) (6.472) (6.817)
Independent Variable Housework Time
Low- skilled immigrant share –9.701*** –9.701*** –6.645
(3.333) (3.360) (6.037)
Independent Variable Residual Time
Low- skilled immigrant share 20.098*** 20.098*** 18.760*
(7.550) (7.610) (10.547)
First-stage results:
IV 4.02e–07***
(8.68e–08)
F- statistic 21.411
R- squared 0.963
N 2362 2362 2362
instrument is a very good predictor of the share of low- skilled immigrants. The as-sociated F- statistic is 21.41, which allows us to reject the null of a weak instrument. (See Stock and Yogo 2005.)
The estimates in Table 3 show that low- skilled immigration appears to have a dif-ferential impact on the childcare provision of college- educated mothers of nonschool- aged children depending on the type of childcare at hand. In particular, in line with the predictions of the model, the two percentage point increase in the share of low- skilled immigrants taking place between the 1970s and 2000 lowered the time allocated by college- educated mothers to basic childcare by a little bit more than half an hour per week. In contrast, the same increase in the share of low- skilled immigrants raised the time allocated to educational and recreational childcare by college- educated mothers by a quarter of an hour—although this effect is only marginally statistically signifi cant at the 10 percent level. IV estimates are larger than OLS estimates in all specifi cations, suggesting that OLS estimates may be biased downward as a result of immigrants tending to locate in regions experiencing a higher growth rate, and college- educated mothers in those regions reducing the time allocated to childcare. The decrease in basic childcare and the increase in educational and recreational childcare that followed the rise in low- skilled immigration had a net effect of reducing childcare time by about 21 minutes per week. 20
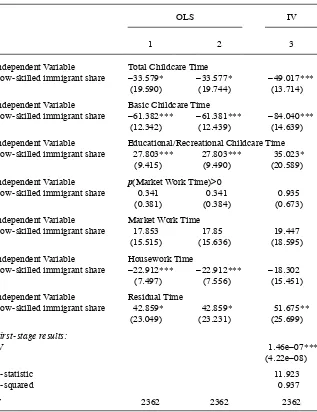
Similar results are obtained using the share of low- skilled female immigrants as our key regressor. As displayed in Table 4, the 0.8 percentage point increase in the share of low- skilled female immigrants taking place between the 1970s and the 2000s lowered the time allocated to basic childcare by college- educated mothers of nonschool- aged children by 0.68 hours/week (about 40 minutes/week), while it increased their time spent on educational and recreational childcare activities by 0.3 hours/week (or 17 minutes/week). However, once more, this effect is only marginally statistically sig-nifi cant at the 10 percent level, as in Table 3. The last rows in Table 4 show that the instrument is a very good predictor of the share of low- skilled female immigrants as well. The associated coeffi cient is, again, positive and statistically signifi cant and the
F- statistic is 11.92. Given the similarity of the results, we will follow previous U.S. studies in this literature (such as Cortés and Tessada 2010 or Furtado and Hock 2010), and use the share of low- skilled immigrants for the remainder of the analysis.
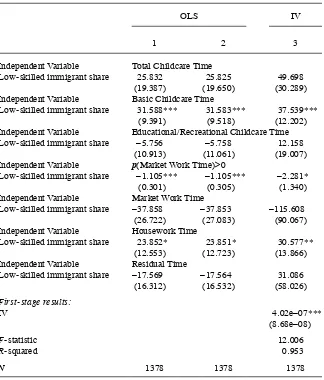
A second prediction from the model is that low- skilled immigration had a differen-tial impact on the childcare provision of mothers of nonschool- aged children depend-ing on their educational attainment. Table 5 shows the OLS and IV results from esti-mating Equation 1 for our main sample of noncollege- educated non- Hispanic mothers of nonschool- aged children. The model specifi cations are the same ones from Table 3. The 1970–2000 increase in the share of low- skilled immigrants raised the time devoted to basic childcare activities by 0.75 hours/week (or 45 minutes/week). Ad-ditionally, it had no statistically signifi cant impact on the educational or recreational childcare. Note, however, that due to the marginally signifi cant impact of low- skilled immigration on the time dedicated by more educated mothers to educational and
Table 4
Time Use of Mothers with More Than a High School Degree and the Share of Low- Skilled Female Immigrants (Mothers with Children 0–5)
OLS IV
1 2 3
Independent Variable Total Childcare Time
Low- skilled immigrant share –33.579* –33.577* –49.017***
(19.590) (19.744) (13.714)
Independent Variable Basic Childcare Time
Low- skilled immigrant share –61.382*** –61.381*** –84.040***
(12.342) (12.439) (14.639)
Independent Variable Educational/Recreational Childcare Time Low- skilled immigrant share 27.803*** 27.803*** 35.023*
(9.415) (9.490) (20.589)
Independent Variable p(Market Work Time)>0
Low- skilled immigrant share 0.341 0.341 0.935
(0.381) (0.384) (0.673)
Independent Variable Market Work Time
Low- skilled immigrant share 17.853 17.85 19.447
(15.515) (15.636) (18.595)
Independent Variable Housework Time
Low- skilled immigrant share –22.912*** –22.912*** –18.302
(7.497) (7.556) (15.451)
Independent Variable Residual Time
Low- skilled immigrant share 42.859* 42.859* 51.675**
(23.049) (23.231) (25.699)
First-stage results:
IV 1.46e–07***
(4.22e–08)
F- statistic 11.923
R- squared 0.937
N 2362 2362 2362
Table 5
Time Use of Mothers with at Most a High School Degree and the Share of Low- Skilled Immigrants (Mothers with Children 0–5)
OLS IV
1 2 3
Independent Variable Total Childcare Time
Low- skilled immigrant share 25.832 25.825 49.698
(19.387) (19.650) (30.289)
Independent Variable Basic Childcare Time
Low- skilled immigrant share 31.588*** 31.583*** 37.539***
(9.391) (9.518) (12.202)
Independent Variable Educational/Recreational Childcare Time Low- skilled immigrant share –5.756 –5.758 12.158
(10.913) (11.061) (19.007)
Independent Variable p(Market Work Time)>0
Low- skilled immigrant share –1.105*** –1.105*** –2.281*
(0.301) (0.305) (1.340)
Independent Variable Market Work Time
Low- skilled immigrant share –37.858 –37.853 –115.608
(26.722) (27.083) (90.067)
Independent Variable Housework Time
Low- skilled immigrant share 23.852* 23.851* 30.577**
(12.553) (12.723) (13.866)
Independent Variable Residual Time
Low- skilled immigrant share –17.569 –17.564 31.086
(16.312) (16.532) (58.026)
First-stage results:
IV 4.02e–07***
(8.68e–08)
F- statistic 12.006
R- squared 0.953
N 1378 1378 1378
recreational childcare, low- skilled immigration did not have a statistically different impact on the time dedicated by more educated as opposed to less educated mothers to that category of childcare.
Although we do not model labor market displacement effects in our simple time use model, this fi nding suggests that immigration may have exerted a downward pressure on the employment of less- educated mothers through greater competition in the labor market. This hypothesis is, in fact, confi rmed by Cortés and Tessada (2010), who fi nd that low- skilled immigration during 1980–2000 lowered the labor force participation of women with a high school education or less in the United States.21 Under such circumstances, less- educated mothers may have chosen to stay at home and take care of their own children. The fi gures in the bottom rows of Tables 3 through 5 examine that possibility. While the estimated coeffi cients on the labor market participation and hours worked by mothers with at least some college education are positive, we do not fi nd a statistical signifi cant impact of low- skilled immigration on the time dedicated to market work by that group of mothers. Unlike Cortés and Tessada (2010), we do not restrict our sample to women with advanced degrees, such as Masters and Ph.D.s. Rather, it includes women with more than a high school education, for whom low- skilled immigration may not have had equally strong complementary impacts. Inter-estingly, however, low- skilled immigration appears to have marginally reduced the employment likelihood of less- educated native mothers of nonschool- aged children. Specifi cally, the 2 percent increase in the share of low- skilled immigrants taking place between the 1970s and the year 2000 resulted in a 4.6 percentage- point lower likeli-hood of engaging in market work. Additionally, the 1970–2000 increase in the share of low- skilled immigrants also raised the time allocated by these less- educated mothers to home production considerably by 37 minutes minutes/week.
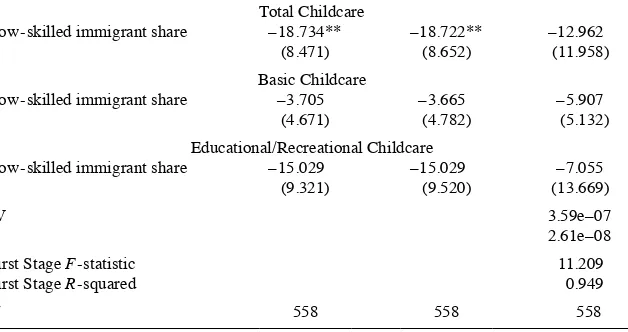
We also perform a number of robustness checks to assess if these results are unique to college- educated mothers of young children. We report on two of them here.22 First, we look at college- educated mothers of older children. Column 3 of Table 6 shows that the two percentage point increase in the share of low- skilled immigrants of the period 1970–2000 had no statistically signifi cant impact on the overall time allocated to childcare by this group of mothers. When distinguishing by the type of childcare provided, we fi nd that, unlike mothers of nonschool- aged children, college- educated mothers of school- aged children did not signifi cantly change their provision of basic childcare following the increase in low- skilled immigration. This fi nding is not sur-prising since mothers of older children dedicate signifi cantly less time to basic child-care than their counterparts with nonschool- aged children. It is, however, interesting to fi nd that low- skilled immigration allowed college- educated mothers of school- aged children to slightly reduce, albeit by only fi ve minutes/week, the time invested in recreational/educational childcare. In 2000, approximately 60 percent of the time in-vested by mothers of these school- age children in recreational/educational childcare went to supervising the children while they played or worked on homework. Hence,
Table 6
Childcare Time and the Share of Low- Skilled Immigrants (Alternative Samples)
OLS IV
Independent Variable: 1 2 3
Panel A: Mothers with More Than a High School Degree with Older Children (6–18)
Total Childcare
Low- skilled immigrant share 1.172 1.172 8.386
(2.935) (2.954) (8.039)
Basic Childcare
Low- skilled immigrant share 4.956 4.956 13.418
(3.915) (3.940) (8.280)
Educational/Recreational Childcare
Low- skilled immigrant share –3.784** –3.784** –5.032***
(1.851) (1.863) (0.737)
IV 3.86e–07***
(9.45e–08)
First Stage F- statistic 16.574
First Stage R- squared 0.957
N 2871 2871 2871
Panel B: Fathers Married to Mothers with More than a High School Degree with Children 0–5
Total Childcare
Low- skilled immigrant share –18.734** –18.722** –12.962
(8.471) (8.652) (11.958)
Basic Childcare
Low- skilled immigrant share –3.705 –3.665 –5.907
(4.671) (4.782) (5.132)
Educational/Recreational Childcare
Low- skilled immigrant share –15.029 –15.029 –7.055
(9.321) (9.520) (13.669)
IV 3.59e–07
2.61e–08
First Stage F- statistic 11.209
First Stage R- squared 0.949
N 558 558 558
low- skilled immigration may have allowed for a small reduction in the provision of more age- appropriate childcare, as is the case with child supervision after they arrive from school.
Second, we reestimate our models using an analogous sample of fathers. Because there are many more college- educated fathers married to less- educated mothers (es-pecially in the earlier years) than college- educated mothers married to less- educated fathers, we divide the father sample by the educational attainment of the wife. This reduces the number of years available for our analysis, as information on the spouse’s educational attainment is only available in the 1975–76 and the 2003 surveys.23 Table 6 displays the results. As predicted by the theory, the estimated coeffi cients bear a neg-ative sign; however, they are not statistically different from zero. Hence, the increases in low- skilled immigration appear to have led to reductions in the provision of basic and total childcare time that are specifi c to high- skilled mothers of nonschool- aged children.
VII. Summary and Conclusions
Previous work has shown that low- skilled immigration to the United States allowed for a substantial reduction in the price of locally traded goods and ser-vices in the United States (Cortés 2008) and, more specifi cally, on the cost of provided childcare, food, and housekeeping services in large metropolitan areas (Furtado and Hock 2009). Based on those fi ndings, Cortés and Tessada (2010) show that low- skilled immigration to the United States led to increases in hours worked conditional on being employed among native college- educated women in the United States. In turn, Furtado and Hock (2010) show how low- skilled immigration reduced the work- fertility tradeoff faced by educated urban American women.
We go one step further and examine how low- skilled immigration, via its impact on the cost of household services, may have impacted the allocation of time to child-care of college- educated mothers in the United States. Using historical time use data and an instrumental variables approach that accounts for the endogenous location of low- skilled immigration, we fi nd that low- skilled immigration to the United States had a differential impact on the childcare provision of mothers depending on their educational attainment and the type of childcare. In particular, low- skilled immigra-tion to the United States has contributed to substantial reducimmigra-tions in the time allocated to basic childcare by college- educated mothers of nonschool- aged children. However, these mothers have not reduced the time allocated to more stimulating educational and recreational activities with their children. These fi ndings underscore the opportunity costs faced by high- skilled mothers of young children.
In addition to informing about low- skilled immigration impacts beyond employ-ment, wages and fertility, learning about the impact that increases in low- skilled immi-gration might have had on the time allocated by parents to various types of childcare is important since some types of childcare can prove particularly important for the child’s posterior intellectual and social development. This is a crucial policy
tion with important consequences for the intergenerational transmission of economic status, and may help to better understand the parent- child correlations extensively documented in the literature (see Black and Devereux 2011 for a literature review on Intergenerational Mobility). Our work highlights the need for further research on the determinants of the time mothers spend on childcare activities and how the latter impacts children outcomes depending on mothers’ educational attainment.
Appendix A
A Model of Childcare Provision
A mother’s maximization problem is given by:
(A.1) max x,l,h
U(c)+V(l)
st:
c=c(x,h)
:px=w(1−h−l)
1=L+l+h
x,h,l,L≥0
Case 1: Mother purchases childcare services ( x*>0): Substituting the fi rst constraint into the utility function yields the fi rst order conditions:
(A.2)
(A.3)
h:Uc'ch' −w=0
x:Uc'cx' −p=0
l:Vl'−w=0 (A.4)
It is easy to see that dividing (A.2) by (A.3), we get Expression 3. Likewise, divid-ing (A.4) by (A.3) we get Expression 4, just as and dividdivid-ing (A.4) by (A.2) we get Expression 5:
(4) Vl'
Uc'cx' =
w p
(5) Vl'
Uc'ch' =1
for children c) from additional units of either commercial childcare (x) or maternal childcare (h) that is needed to compensate for a one- unit marginal reduction in the consumption of leisure (l), should be equal to the marginal rate of exchange between leisure and commercial childcare on the one hand, and leisure and maternal childcare on the other hand.
Case 2: Mother does not purchase childcare services ( x*=0): If this is the case, then Equation A.3 does not hold with equality, but as follows:
(A.3)' x:Uc'cx' −p<0
Dividing (A.3)' by (A.2) yields inequality (3)':
(3)' ch'
cx' >
w p
T
he
J
ourna
l of H
um
an Re
sourc
es
Appendix B
Table B1
AHTUS Description
Study Aims, Target Populations, and Sample Restrictions
Survey Years Organizing Aims and Considerations Target Population Sampling Restrictions
1975–76 Measure national accounts and changes in time use over the year
The national adult population People aged 18 or older and one person plus spouse if present per household
1992–94 The study measured time use and exposure
The national population living in private residences
1 person of any age living in sampled private households with phones (Alaska and Hawaii excluded)
2003 The study follows a sub- sample of the CPS for a 9th wave to facilitate
the study of national accounts
The national population not living in military bases or institutions
1 person aged 15 or older in the household
Relevant Points in Time From the Sample Designs
Survey Years Fieldwork Period Sampling of Days of the Week When Activities Were Recorded
1975–76 Wave 1: 9 October 1975 – 22 November 1975; Wave 2: 6 February 1976 - 28 March 1976; Wave 3:
The study aimed to collect one diary on a Sunday, one on a Saturday, and two on different weekdays from each sample member.
A
m
ue
do-D
ora
nt
es
a
nd S
evi
lla
535
1976
1992–94 September 1992 – October 1994 Phone calls were attempted on all days of the week
Diaries covered the previous 24- hour day
2003 Whole year of 2003 Half of diaries were collected on weekday, half on weekend days
Diaries covered the previous 24- hour day
Sample Designs and Response Rates
Survey Years Sample Frame How Sample Drawn Response Rate
1975–76 Private households Stratifi ed, clustered and probability selection within strata. One individual was sampled per household. Data was also collected from spouses where present.
72 % in the fi rst wave; 44.9 % responded to all four waves
1992–94 Potential phone numbers within lists of area codes
Random- digit dialing, only private residences pursued for interview. The person who would next have a birthday completed the diary.
63 %
2003 The CPS sample A random subsample of the CPS, with the
oversampling of small states dropped but families with children oversampled. Half of the diaries are collected on weekdays, the other half on weekend days
57.8 %
Table B2
Log Median Wage in Childcare and the Share of Low- Skilled Immigrants
Independent Variable OLS IV
Low- skilled immigrant share –1.633 –3.668***
(1.171) (1.312)
R- squared 0.885
First-stage regression results 21.773
IV 2.15e–07***
(4.67e–08)
First Stage F- statistic 21.773
First Stage R- squared 0.9827
N 137 137
Notes: All regressions include state and Census region- year fi xed effects. Low- skilled immigrants are those with at most a high school degree. Additionally, we control for the logarithm of mean total income of college- educated men of working age to account for the selective migration among immigrants based on changing local conditions within the state over time. Robust standard errors are clustered at the state level and shown in parentheses. * denotes signifi cance at the 10 percent level, ** at the 5 percent level, and ***at the 1 percent level.
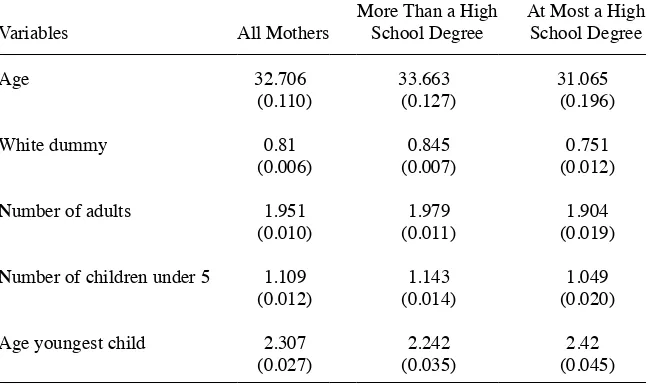
Table B3
Means and Standard Deviations of Other Variables Included in the Analysis
Variables All Mothers
More Than a High School Degree
At Most a High School Degree
Age 32.706 33.663 31.065
(0.110) (0.127) (0.196)
White dummy 0.81 0.845 0.751
(0.006) (0.007) (0.012)
Number of adults 1.951 1.979 1.904
(0.010) (0.011) (0.019)
Number of children under 5 1.109 1.143 1.049
(0.012) (0.014) (0.020)
Age youngest child 2.307 2.242 2.42
(0.027) (0.035) (0.045)