ORTHOIMAGES OF THE OUTER WALLS AND TOWERS OF THE CHÂTEAU DE
CHAMBORD
A. Pintea, R. Hénoa, M. Pierrot-Deseillignya, X. Brunetaudb, S. Janvier-Badosa b, R. Janvierb
a
École Nationale des Sciences Géographiques, 6-8 avenue Blaise Pascal – Cité Descartes, Champs-sur-Marne 77455 Marne-la-Vallée cedex 2 , France, (antoine.pinte, raphaele.heno, marc.pierrot-deseilligny)@ensg.eu
bUniversité d’Orléans, INSA
-CVL, PRISME - UPRES EA 4229, 8 rue Léonard de Vinci, F-45072, Orléans, France (xavier.brunetaud, sarah.janvier, romain.janvier)@univ-orleans.fr
KEY WORDS: Close range photogrammetry, Monument monitoring, Orthoimage, Unwrapped image, MicMac
ABSTRACT:
The château de Chambord is one of the most famous castles in the world as it is an emblem of French Renaissance architecture. It was built at the beginning of the 16th century and has been part of the UNESCO World Heritage list since 1981. The monitoring of such a monument involves the organization and visualization of data sets such as archive documents, survey data, scientific documentation, restoration reports, meteorological data, etc. This process requires the realization of a support for documentation which may be an orthoimage. A photogrammetric survey was recently performed, in the framework of the traditional fieldwork of the students in the PPMD master's degree (Specialized Master’s in Positionning, Photogrammetry and Deformation Measurement) at the French National School of Geographic Sciences (ENSG). High resolution images were taken from the ground level, using two off-the-shelf reflex cameras, equipped with a 35 mm, a 100 mm and a 200 mm focal length lens according to the needs. The MicMac software was used for the bundle adjustment, the georeferencing and the dense correlation procedures, including orthoimage calculation. Added to plane-based orthoimages, cylinder-based orthoimages were generated for the 2D representation of the outer walls of the château de Chambord including façades and towers. Fitting the 2D projection to the mean characteristics of the geometry has a promising documentation potential for GIS applications in heritage studies.
1. INTRODUCTION
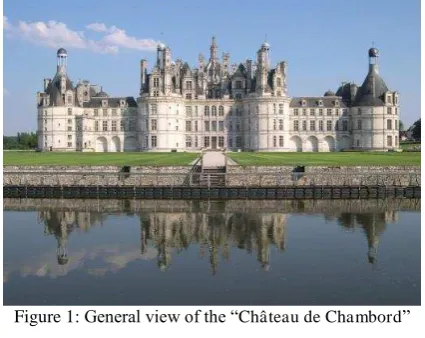
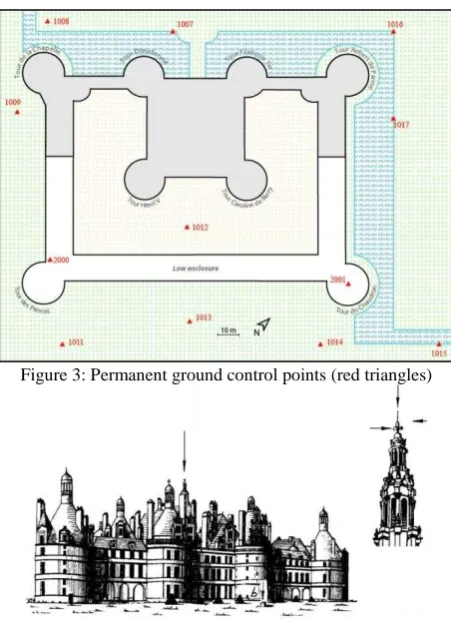
The château de Chambord is one of the most famous castles in the world, as it is an emblem of French Renaissance architecture (see Figure 1). It was built at the beginning of the 16th century and has been part of the UNESCO World Heritage list since 1981. It is made up of a simple donjon made of four round 20 m diameter towers surrounded by enclosure walls of rectangular dimensions (135 x 85 m) with four more round towers at its corners (see Figure 2).
The monitoring of an historic monument involves the organization and visualization of data sets such as archive documents, survey data, scientific documentation, restoration reports, meteorological data, etc. Intuitively, a 3D model of the building would be the perfect support to map and represent all metadata [Brunetaud et al., 2012] [Stefani et al., 2014]. But even if 3D acquisition is becoming common in the field of cultural heritage, annotation of 3D representation is still a very challenging topic and is presently an active research field [Manuel et al., 2014]. Because 3D mapping technology is not available for heritage documentation yet, this paper is focused on the production of 2D digital assets for 2D mapping. For example, in some specific cases (surveying of small archaeological features), visual quality of the texture of the stone is more important than a fully detailed geometric model. So, for many annotation typologies, a 2D annotation system can be directly built on top of GIS software, only requiring 2D and metric digital assets like orthoimages. Fortunately, the façades of the château de Chambord can be simplified to a set of primitives (planes and cylinders) and this paper intends to expose the methodology of production of orthoimages of these façades into high quality orthoimages. It refers to a recent photogrammetric survey, recently carried out within the framework of the traditional fieldwork of the students in the PPMD master's degree (Specialized Master’s in Positionning,
Photogrammetry and Deformation Measurement) at the French National School of Geographic Sciences (ENSG).
Figure 1: General view of the “Château de Chambord”
1.1 Context of the survey some individual exceptions, they are neither expert in heritage, nor in architecture or history of art. But they must learn how to properly respond to specific orders, like, in this case:
Producing reference graphic documentation, showing the current aspect of the castle (3D dimensions, shapes, colors) ; Producing extendable and sustainable documentation, that is to say explicit documentation that can be continued by other surveyors.
Furthermore, they have to show the chief architect and the curator how objective and reliable the photogrammetric products can be, in comparison to older documents, whose value is, of course, not questioned, but which may contain errors mainly due to lack of observations leading to extrapolations.
1.2 Content of the survey
The list of tasks to carry out was collegially defined by a team made up of professors from the ENSG, researchers from the PRISME research laboratory and Luc Forlivesi, curator of the château de Chambord, taking several aspects into account: pedagogical concerns, already existing plans and 3D data, security and overall movement possibilities inside and around the castle. Since the complete 3D survey of the castle was not conceivable in two weeks with non-professional operators, it was decided to ask the fourteen PPMD students and their professors to:
1. set up a documented network of permanent ground control points (GCPs) expressed in the French legal reference coordinate system (RGF93 in a CC48 projection),
2. register laser data, previously acquired and consolidated by the PRISME research laboratory, in the reference coordinate system,
3. acquire aerial images of the roofs from a drone and process them,
4. acquire and process laser data inside the Robert de Parme tower (the one containing the lodgings of François Ier), 5. acquire and process images to reconstruct the famous
2. THE GROUND CONTROL POINT NETWORK
A network of permanent ground control points was first set up around the castle. It was meant to support the georeferencing of all the workshops of the current PPMD’s fieldwork, but also to be used by any surveyor or architect who may have to work later in any part of the castle. Therefore, it must be well documented through identification sheets and properly advertised. Permanent points have been placed all around the castle, at the ground level and on the low enclosure (see Figure 3).
Figure 3: Permanent ground control points (red triangles)
Figure 4: Relay point to consolidate the network
Highly redundant topometric observations were made between the various stations, using the base of the lightning rod of the Tour de la Lanterne as a relay point (see Figure 4), to enhance the rigidity of the figure. GNSS measurements were performed on six well distributed points of the network, so that the link to the official French reference coordinate system, RGF93 (in a CC48 projection) can be made. In order to get the best possible precision from GNSS differential measurements, a permanent GNSS station had been previously installed on top of the so-called Tour du Chaudron (see TE in Figure 5). Besides, two several hour long measurement sessions were made on each of these points, not only to reach the best possible absolute positionning, but also to be sure about it. Other points meant to be used as ground control points (GCP) for image and laser georeferencing were also set up, measured and computed in a global compensation computation. The final absolute accuracy on the base network is 2 cm in X, Y and Z, whereas the relative accuracy, that is to say the global consistency of the network, is around 3 mm.
3. PHOTOGRAMMETRY
3.1 Specifications
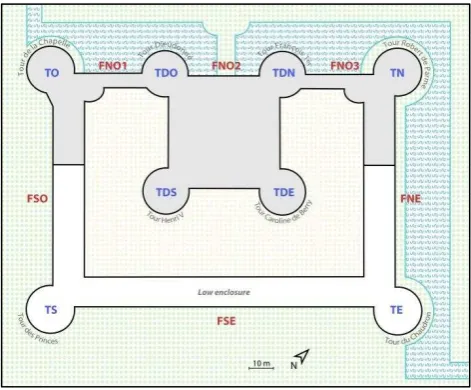
For practical reasons, temporary names were given to each entity to be surveyed (see Figure 5).
Figure 5: Working document with short names for each entity to be surveyed
The outer surrounding wall of the castle is about 600 m long: 8.5 m high for the lower part (see the white areas in Figure 5) and about 20 m high to the roof base for the upper part (see the grey areas in Figure 5). The objective of the image acquisition is to be able to produce orthoimages of the six façades (FSO, FNO1, FNO2, FNO3, FNE & FSE) and unwrapped images of the six towers (TDS and TDE were not surveyed).
The reconstruction of the wall’s relief, necessary to produce the orthoimages, is directly determined with the images acquired for the generation of orthoimages; thus, the image acquisition public’s presence, especially in front of the walls facing the path to the visitor’s entrance (Southwest and Southeast part of the castle: TO, FSO, TS & FSE in Figure 5). Access constraints to traditionally closed areas also demanded special organizational efforts, since no passkey was provided to the team. Access to wall, facilitating image acquisition, especially with long focal length lenses. However, acquisition was complicated by the vegetation in the south and the moat along the castle throughout the Northwest and Northeast part (FNO & FNE), which includes the majority of the towers (all except TS).
Stereoscopic image survey with high overlap (80%) was performed, in order to accurately reconstruct the relief by image matching methods. In order to limit the deformations on the upper parts, images must be taken as perpendicular as possible to the wall. The use of poles to take the images from a higher
point of view was first considered. But this solution imposes very short exposure time, since the pole is difficult to stabilize, and thus complicates the acquisition protocol, increasing the acquisition time. It was therefore preferred to take pictures from the ground level, but to move away from the façades to improve the incidence angle of the images. So, to ensure a reasonable ensure a good result, the image survey was doubled by a second image acquisition of all the outer walls with a short focal length of 24 or 35 mm.
The acquisition was made independently for each façade with all photographic axes parallel to each other and for each tower with convergent photo axes. Each image survey was designed to ensure an overlap with neighboring façades or towers, in order to be able to produce a rigid orientation of all the images of the outer walls. Because of a really dense planning, compromises had to be made regarding the GCPs. Fewer GCPs than what are usually required were defined: one GCP at every corner of the block for each entity plus some intermediate ones. As far as possible, artificial targets were glued onto the walls, to ensure quality measurements and to reduce the risk of error. This relatively light equipment is compensated by the possibility of identifying more GCPs in the georeferenced laser data.
For some configurations, images with a 200 mm focal length lens were taken. This is the case for the North and West towers (see TN & TO in Figure 5), both bordered by the moat, which prevents the photographer from standing perfectly perpendicular to the wall. To compensate this disadvantage, it was decided, as an experiment, to move further away and to increase the focal length of the camera lens. An acquisition with a 200 mm focal length lens was also performed to cover the central part of the North West façade (FNO2). The orientation of these images, acquired by a 200 mm focal length lens, was meant to be based on the orientation of the 100 mm focal length images (itself based on the 24 or 35 mm focal length images).
3.4 Achievement
During this first fieldwork session, almost all of the outer walls were acquired. Among all the images, 1595 images were selected: 508 short focal length images, 975 100 mm images and 112 200 mm images. This acquisition, although carried out with care, is not optimal for several reasons. Firstly, the educational context of the project made it obligatory to involve all the students in all the workshops, making it impossible to capitalize expertise throughout the project. On the other hand, the weather, unfavorable at this season for this type of work, but imposed by the schedule of the specialized Master’s, was not optimal for such acquisitions.
4. IMAGE PROCESSING
MicMac, a set of free open source photogrammetric software to build 3D models from images, was chosen to process the images [Pierrot-Deseilligny et al., 2006].
4.1 Image orientation
coordinate system, as well as the camera geometry itself (principal points, principal distance and distortion law).
At first, tie points between all images were extracted within the MicMac software, in a specific module based on the SIFT algorithm [Lowe, 2004], followed by a multiple matching phase. To accelerate the computation, this phase was made in two steps: first, tie points between all the short focal length lens images were computed; then, for each façade or tower, tie points between the long and the short focal length images were added. More than 10 million tie points were extracted from the short focal length images, and more than 35 million in total.
Then, a bundle adjustment of all 35 mm focal length images was calculated, leading to an average image residual of 0.4 pixels. This computation optionally includes an autocalibration of the camera. The principle is to start the first iterations of the bundle adjustment with an approximate camera, derived from the Exif data and a given camera model. After some iterations, the camera parameters are added to the system of equations and adjusted in a way that the average image residual is minimized. Since the focusing parameters change the geometry of the camera, the autocalibration procedure should determine different cameras when they change. It is unfortunately not done automatically, since they are not part of the Exif data. Hence, a specific recording was made in the field: as far as possible, whole sets of images were taken with the same parameters (same aperture and fixed manual focus), and anytime the focusing distance had to be modified, an image of the sky was made, so that the images could be properly sorted taking the different cameras into account. It is then possible within the MicMac software to ask for a separate camera for a specific pattern of images. At the end, 15 different cameras were calibrated for the short focal length lens images.
Two types of ground control points were then measured on the 35 mm focal length images: reliable and accurate GCPs specifically designed for these images, and other GCPs designed to georeference already existing laser data (only natural points could be used for the laser georeferencing). Both types of points were weighted differently in the final bundle adjustment. At the end, 59 well-spread GCPs were measured on 341 images. The final global compensation in the MicMac software led to rather good results (average image residual around 0.4 pixels on the tie points, 0.8 pixels on the GCPs, average ground control point residual around 1 cm in X,Y,Z).
Figure 6: View of the tie points and the position of the 35 mm cameras
Finally, for each entity, the 100 mm and the 200 mm focal length lens images were oriented in the reference coordinate system using only the tie points with the already oriented 35 mm focal length images, using an option that “freezes” the
35 mm image poses. It must be noted that the orientation of the 100 mm and the 200 mm focal length lens images had to be done separately for each entity for computational reasons (35 million tie points to load for the overall computation!).
4.2 3D reconstruction and orthoimage production
4.2.1 Image matching from the “image” space or from the “object” space
MicMac software can be used to calculate the depth map in several geometries: “image” geometry, specified by a master image, with a dynamic in 1/Z, or “cartographic” geometry, well adapted to classical aerial surveys (see Figure 7).
Image matching from the image space using epipolar geometry
“Cartographic” 3D reconstruction geometry Image matching from the object space
Figure 7: Two 3D reconstruction geometries [Héno et al., 2014]
The second approach (cartographic geometry) requires the projection plane to be defined by drawing polygons considered to belong to the main façade plane on the input images. The area. Then, any X,Y pixel of the output orthoimage is given the best radiometry among all points where this X,Y,Z is photogrammetrically projected, taking into account possible occlusions, radiometric continuousness and incidence angles. A default radiometric equalization is applied to all individual orthoimages before merging.
4.2.2 Case of high walls: orthocylindric geometry
However, since ground resolution within the images of the façade may vary considerably, especially for high walls viewed without perspective, it is not recommended to compute a depth map at a constant spatial resolution as is done when using cartographic reconstruction geometry. MicMac software also
makes it possible to compute a depth map at a constant angular resolution, through a mere temporary change of coordinates to avoid computing Z as a function of (X,Y). New coordinates, U,V,L may indeed be defined, so that U=D.atan(X/Z) ; V=Y ; L=Z (see Figure 8). The problem is thus turned into computing L=f(U,V).
Image survey of a façade Profile view
Figure 8: “OrthoCylindric” geometry: optimization of the “cartographic” 3D reconstruction geometry (camera positions
are shown as small red circles)
4.2.3 Case of cylindrical towers
“Cartographic” geometry is also adapted for non-flat areas. The depth map to be computed by image matching needs to be a cylinder rather than a plane for the towers (TS, TO, TN, TE, TDO and TDN). The definition of the average cylinder requires a few 3D reconstructions around the tower. The cylindrical depth map can be transformed into an unwrapped orthoimage or into a 3D point cloud (see Figure 10 and Figure 11).
4.2.4 Fully automated computation mode
A new computation mode has been recently proposed in the MicMac software. This method, based on image geometry reconstruction (see 4.2.1), is designed for non-expert users, since it does not demand any parametric setting; in fact, only a few user interactions are needed. One is required to define the working area by drawing a box in the 3D tie point cloud, computed right after the image orientation (see example of such a point cloud in Figure 6). Then, a depth map is computed in “image” geometry for some images, which view the working area. The master images are automatically defined by the software, and, for each of them, the best set of secondary images is defined using different criteria: efficiency in terms of occlusion management, number of images to be used, incidence angles and space coverage. All the depth maps are then converted into 3D point clouds, and may be merged. To compute the orthoimage, a projection plane needs to be defined, in the same way as for cartographic geometry (see 4.2.1).
4.2.5 Approved overall methodology
Many tests were made, on the one hand for façade orthoimages and on the other hand for tower unwrapped images. Two methods were particularly used and tested: the orthocylindric cartographic geometry computational method and the new fully automated computation mode.
The fully automated computation mode still being under development, the Chambord project was the opportunity to test and improve it. This method, based on image geometry, reconstructs better the discontinuities than the method based on cartographic geometry, with standard parameters [Penard, 2006] (see Figure 9).
Figure 9: 3D reconstruction differences between standard cartographic method and fully automated geometry image
method (shaded relief images on TS)
This is why this solution was privileged to unwrap the towers. In Figure 10 to Figure 12, reconstruction products for towers, with the new fully automated computation mode, are shown: shaded relief image, unwrapped orthoimages and 3D point cloud.
Figure 10: Shaded relief image and unwrapped orthoimage of Tour du Donjon (TO)
Figure 11: 3D point cloud of Tour du Donjon (TO)
Figure 12: Unwrapped orthoimage of Tour des Princes (TS) Y axis
Z axis
X
a
x
Nevertheless, since this solution was still under development during production, it was difficult to use for the entire castle. Moreover, the different parts of the castle happen to respond differently from each other to image matching. Although the overall aspect of the castle looks very homogeneous at first sight, the color, shape and texture of individual stones may indeed vary a lot due to different exposures to the sun or potential restorations. Since these differences lead to varying qualities of 3D reconstruction results, manual parametric settings are still required in some cases. That is why the new fully automatic mode is not suitable in all cases.
The cartographic reconstruction geometry was thus privileged for plane façades, and specifically, the orthocylindric cartographic method, which gives better results than the classic method on the upper parts. For instance, Figure 13 shows that for shaded relief images computed with the same parameters, more reconstruction problems appear in the upper part of the façade with the standard cartographic 3D reconstruction geometry than with the orthocylindric geometry. The Figure 15 shows results of the orthocylindric cartographic method (shaded relief images and orthoimage).
Standard 3D reconstruction geometry
OrthoCylindric 3D reconstruction geometry Figure 13: 3D reconstruction differences between standard cartographic and orthocylindric geometry (Shaded relief images)
Figure 14: 3D reconstruction with 100 mm only and with 100 mm and 200 mm focal length images, on FNO2 upper part.
For the middle part of the North-West façade (FNO2), some 200 mm focal length images were taken for the upper part in order to test the contribution of long focal length lenses for quality reconstruction.
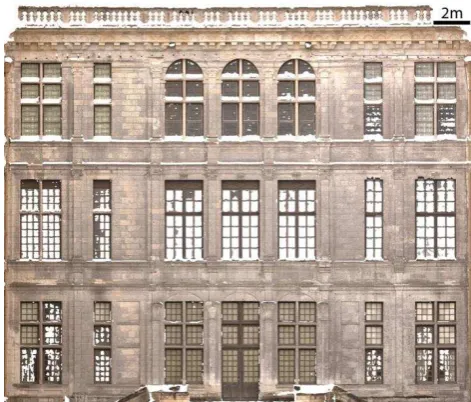
Figure 15: Façade FSO: shaded relief image in orthocylindric geometry, shaded relief image transformed in euclidian geometry and orthoimage.
The Figure 14 shows better reconstruction when the 200 mm images are used in addition to the 100 mm images, particularly on the railing (the extreme upper part) and on the window bars.
A small decrease in hidden parts must be noted as well. The orthoimage computed with the 100 mm and 200 mm images, is shown on Figure 16.
4.3 Assessment
4.3.1 From the producers’ point of view
Quality assessment involves many aspects: quality of the output products, as far as colors, textures, shapes, dimensions, and correct absolute positionning are concerned, but also efficiency of the tools.
4.3.1.1 Colors
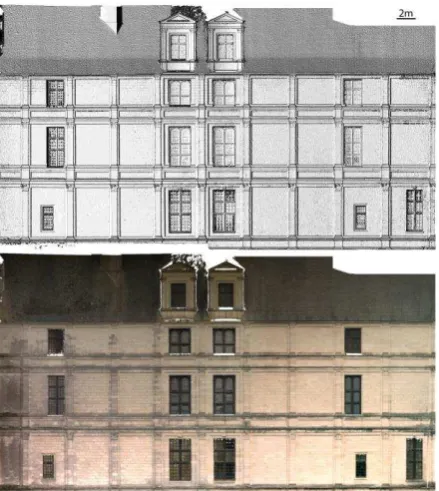
Photogrammetric survey methods are good at rendering realistic and rich colors, due to the capabilities of today’s digital cameras. Beautiful colors in the final products depend on the quality of the image fieldwork survey, and of the radiometric equalization method which may have been used. Quality assessment of the colors is a rather delicate and subjective task. In the Chambord project, successive image processing tools have not damaged the input radiometric dynamic. However, side effects of the automatic radiometric equalization can be observed on some façade orthoimages (see Figure 10), which need to be manually corrected. Besides, differences remain between the various entities, mainly because the image acquisition was carried out entity by entity, at different hours and even on different dates.
4.3.1.2 Textures
Shaded relief images (see Figure 14) are known to emphasize potential artifacts in 3D reconstruction [Héno et al., 2012]. Such images were used to assess the overall 3D reconstruction of the walls, but also, at a larger scale, to look at the stone texture. These images showed that the tuffeau stone (which is the main material used in this castle’s construction) is apparently not properly rendered on all the outer walls. A first hypothesis indicates that the stones exposed on the north side of the castle are not well reconstructed, probably because of the biological colonization. Relatively new stones from modern restoration campaigns also do not respond properly to image matching methods. This does not harm the overall orthorectification process, because the phenomenon is quite small in amplitude, and also because 3D reconstruction usually works well on joints around stones. In most cases, when the shaded relief image shows a poor reconstruction at the stone scale, just increasing the regularization factor improves the 3D reconstruction to be used for orthorectification [Pierrot-Deseilligny et al., 2006]. Further studies should be made to find out whether specific attributes could be used to automate the correlation parameter choice.
4.3.1.3 Shapes, dimensions and absolute positionning The comparison of the photogrammetric 3D point clouds with the laser data previously acquired by the PRISME laboratory makes it possible to check for any deformation, which may happen in case of inadequate determination of the camera or an insufficient number of ground control points. The CloudCompare tool [CloudCompare, 2015] was used to compare laser and photogrammetric data. The comparison was first made on FSE (see Figure 5) which is the longest wall, thus the most likely to be distorted by photogrammetric processes. The difference between the two datasets is around 1 cm. No systematic error was observed, except for some strong discontinuities like the windows, which are not well reconstructed on the photogrammetric dataset, probably because of the image survey geometry (camera axes roughly perpendicular to the walls) and the cartographic 3D reconstruction geometry.
4.3.1.4 Efficiency of the tools
Image acquisition in the field is relatively fast and efficient; however, some rules need to be strictly respected: keep a fixed focus for a whole set of images, document any change in focus, and take both short and long focal length images. MicMac software is highly promising because on the one hand, it makes it possible to check intermediate results at any stage of the process and, on the other hand, it deals with a great number of cases (flat walls, high walls, cylindrical towers, image acquisition with almost any kind of camera). More tests remain to be made to improve the choice criteria of one or the other computation mode. However, the way MicMac was used for the Chambord project needs to be improved, mainly insofar as computational time is concerned, whatever stage of the process (tie point computation, bundle adjustment, dense image matching). Distributed computation must be considered.
The produced orthoimages provide a metric support with sharp details of stone features and a relevant radiometric quality. These criteria are currently nearly impossible to meet with any other acquisition method. On the one hand, with 3D scanners (used by PRISME laboratory for other applications), geometric correctness could be better than MicMac processing, but color information would need additional photographic processing. Other photogrammetric software solutions favor ease of use over parametric settings at the expense of metric and radiometric quality. Moreover, as far as we know, none of these can handle cylindric geometry or orthocylindric geometry, which is critical in our case.
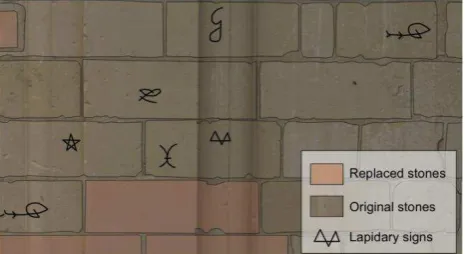
A current project on lapidary signs already takes advantage of this documentation. The aim of this archaeological study is to cross-reference various data collected during in situ surveys (architectural elements, dating, nature and origin of stones) [Janvier-Badosa et al., 2012] with anthropic marks engraved by stonecutters. These archaeological and historical studies were, until now, mainly carried out without computer tools. Our approach on a free software stack based on GIS plugged into a spatial database, makes it possible to run spatial queries added to systematic and automatic spatial distribution calculations of these lapidary signs (see Figure 17). Finally, this will help provide new information about the chronology of the building process of the château de Chambord in the 16th century.
5. PERSPECTIVES
This work, whose data was produced with a MicMac pipeline, is totally based on open format that will ensure the completion of this work by further studies. Moreover, the digital assets provided by MicMac are totally transposable into the future 2D/3D hybrid annotation framework developed in the MONUMENTUM ANR project [Manuel et al., 2014].
As it was already written, several reconstruction methods were used to reconstruct the outer walls of the castle in 3D (fully automated way using the image reconstruction geometry for the cylindrical towers, and cartographic orthocylindric geometry for all the other walls). Since the software was being developed and improved during the production, it was hard to run all the necessary experiments to properly assign one type of computation to one type of architectural structure. Final conclusions about the production methodology should be drawn soon, making easier the continuation of the survey.
REFERENCES
BRUNETAUD X.,STEFANI C.,JANVIER-BADOSA S.,BECK K.,AL -MUKHTAR M., 2012. Comparison between photomodeling and laser scanning to create a 3D model for a digital health record, European Journal of Environmental and Civil Engineering, 16 (sup1) p. 48-63.
CLOUDCOMPARE (Version 2.6.1) [GPL software], EDF R&D, Telecom ParisTech, 2015. Retrieved from http://www.cloudcompare.org/.
HÉNO R., CHANDELIER L., CLAUZEL L., HANON R., 2011. Complementarity of terrestrial laser scanning and DSM from aerial photography: the example of the cathedral of Amiens, Proceedings of the 23rd CIPA Symposium, Prague, Czech Republic.
HÉNO R., CHANDELIER L.,SCHELSTRAETE D., 2012. Costless platform for high resolution stereoscopic images of a high gothic façade, Proceedings of the ISPRS symposium, Melbourne, Australie.
HÉNO R., CHANDELIER L., 2014. 3D Modeling of buildings: Outstanding sites. Wiley editions ; ISBN: 978-1-84821-536-8, 224 p.
JANVIER-BADOSA S., BECK K., BRUNETAUD X.,AL-MUKHTAR M., 2012. Historical study of Chambord castle: a basis for establishing the health record of the monument, International Journal of Architectural Heritage, 7(3), p. 247-260.
LOWE D.G., 2004. Distinctive Image Features from Scale-Invariant Keypoints. International journal of computer vision, 60, 2, p. 91-110.
MANUEL A.,DE LUCA L.,VÉRON P., 2014. A Hybrid Approach for the Semantic Annotation of Spatially Oriented Images. International Journal of Heritage in the Digital Era, III-2, p. 305-320.
PÉNARD L.,PAPARODITIS N., PIERROT-DESEILLIGNY M.. 2006. Reconstruction 3D automatique de façades de bâtiments en multi-vues. RFIA (Reconnaissance des Formes et Intelligence Artificielle), Tours, France.
PIERROT-DESEILLIGNY M., PAPARODITIS N., 2006. A multiresolution and optimization-based image matching approach: An application to surface reconstruction from SPOT5-HRS stereoimagery, ISPRS Workshop on Topographic Mapping from Space (With Special Emphasis on Small Satellites), Ankara, Turkey, February.
PIERROT-DESEILLIGNY M., CLÉRY I., 2012. Some possible protocols of acquisition for optimal use of the “APERO” open source software in automatic orientation and calibration, Tutorial for EuroCow, Castelldefels, Spain, 8-10 February.
![Figure 7: Two 3D reconstruction geometries [Héno et al., 2014]](https://thumb-ap.123doks.com/thumbv2/123dok/3213638.1394333/4.595.329.503.352.507/figure-d-reconstruction-geometries-heno-et-al.webp)