RPC STEREO PROCESSOR (RSP) – A SOFTWARE PACKAGE FOR
DIGITAL SURFACE MODEL AND ORTHOPHOTO GENERATION FROM
SATELLITE STEREO IMAGERY
R.Qina,b a
Dept. of Civil, Environmental and Geodetic Engineering , the Ohio State University (OSU), 2070 Neil Ave., Columbus, OH, USA b Dept. of Electrical Computer Engineering, OSU, 2015 Neil Ave., Columbus, OH, USA
Commission I, WG I/4
KEY WORDS: Rational Polynomial Coefficients, Space borne stereo images, Semi-global Matching, Point clouds, Digital Surface Models, Orthophoto
ABSTRACT:
Large-scale Digital Surface Models (DSM) are very useful for many geoscience and urban applications. Recently developed dense image matching methods have popularized the use of image-based very high resolution DSM. Many commercial/public tools that implement matching methods are available for perspective images, but there are rare handy tools for satellite stereo images. In this paper, a software package, RPC (rational polynomial coefficient) stereo processor (RSP), is introduced for this purpose. RSP implements a full pipeline of DSM and orthophoto generation based on RPC modelled satellite imagery (level 1+), including level 2 rectification, geo-referencing, point cloud generation, pan-sharpen, DSM resampling and ortho-rectification. A modified hierarchical semi-global matching method is used as the current matching strategy. Due to its high memory efficiency and optimized implementation, RSP can be used in normal PC to produce large format DSM and orthophotos. This tool was developed for internal use, and may be acquired by researchers for academic and non-commercial purpose to promote the 3D remote sensing applications.
1. INTRODUCTION
1.1 Background
Digital surface model (DSM) is one of the most useful products in mapping and remote sensing. The recent development of dense image matching techniques in the computer vision and photogrammetry community has largely popularized the use of image-derived DSM, due to its low cost and pixel-wise coupling with photo-realistic textures as compared to traditionally used LiDAR (light detection and ranging). Commercial/public software packages and open-source solutions are popping up, with great efforts on automating the process for DSM and orthophoto generation, such as Photoscan, Pix4d (https://pix4d.com/), Apero/Micmac (Deseilligny and Clery, 2011), Acute3D (http://www.acute3d.com/), SURE (Wenzel et al., 2013), just to name a few. However, most of these solutions usually target at frame cameras (perspective images), with much less support in the geometric processing of satellite images.
The spaceborne sensors nowadays are very good sources even to locate sub-meter individual objects. The resolution of the commercially available spaceborne data is up to 30 cm pixel footprint, giving great potential on acquiring very high resolution (VHR) DSM and multispectral orthophotos. DSMs overlaying with per-pixel spectral information are extremely useful in promoting scene understanding in remote sensing. Since for a long time, remote sensing scientists working on image analysis mainly focus on 2D data, while knowing the geometric features of ground objects could greatly enhance the interpretability. A few studies have shown already that interpreting remote sensing multispectral images coupling with geometric information could improve tasks such as building
detection, image classification to a notable level (Huang et al., 2011; Zhang et al., 2015).
The geometry of most spaceborne imaging sensors are modelled with the well-known rational polynomial functions (RPF), which build the object-to-image space mapping through 78 parameters, called RPC (rational polynomial coefficients):
(1)
where are the normalized pixel coordinates on the images, and are 3rd order polynomial functions, with each numerator modelled by 20 parameters and denominator by 19 parameters (Fraser and Hanley, 2003). This can regularize the redistribution of geometric parameters for different image providers, at the same time ease the complicated modelling of linear-array cameras used by most of the satellite platform. Due to the high order non-linear representation, simple manipulations in geometric processing such as forward projection and spatial resection require iterative process. The implementation details for such functions seem to be too high a burden for most of the researchers to adopt the geometric aspects of the RPC modelled images (called RPC images thereafter). Moreover, the spaceborne data can easily reach several billions of pixels, posting even more challenges in processing time reduction and memory optimization.
1.2 State of the art
The commercial/public/open-source solutions for perspective images nowadays are becoming mature thanks to the wide contribution of the computer vision and photogrammetry community. However the development of light-weight software for RPC stereo images is much less because of the high implementation burden and smaller size of interested community. There are only a few tools available for DSM
generation from RPC images. Most of such either reside in complete commercial software packages or internal institutional developments. Commercial software packages are often well-developed and provide users with easy-to-use interfaces, while reserve less flexibility. For software stability and compatibility reasons, the commercial software packages may not include the latest developments. Some institutions have their internally developed system, which have led to impressive results. One of the examples is the CATENA system developed by (DLR) (Krauß et al., 2013). It implements the classical semi-global matching (SGM) (Hirschmüller, 2008), with complicated consideration in optimization in a distributed system. It is capable of generating country-wide high resolution DSM fully automatically. SETSM (Noh and Howat, 2015) developed by the BPCRC (Byrd polar and climate research centre) in the Ohio State University adopts a TIN-based method for surface extraction, running on a high performance computer, which has a particular good performance on the glacier area.
Micmac developed by IGN (Deseilligny and Clery, 2011) is an open-source software package for perspective images. According to its manual, it has a small module to generate DSM from RPC images. However, it cannot perform the orientation refinement of the RPC images and has rarely been reported about its processing capability in RPC-based images.
1.3 The RPC Stereo Processor
The institutional developments are either for internal use or dependent on hardware architecture. To a large extend we can say there is no good distributable and light-weight software available yet for handling the complete pipeline of the RPC stereo images processing. Remote sensing scientists can only rely on the commercial software or test computations from the capable institutions, which are inconvenient and restricted. On the other hand, open solutions to perspective images, such as PMVS (Furukawa and Ponce, 2010), SURE (Wenzel et al., 2013), Apero/Micmac (Deseilligny and Clery, 2011) have popularized many applications related to image-based 3D surface models, allowing users to easily produce 3D modelled spaceborne images, and produces mapping products including DSM and orthophoto. RSP is designed to be easy-to-use, while being flexible enough to handle different kind of dataset. The memory management and implementation have been carefully considered and designed, allowing computing RPC images with very large dimension in a normal PC. Each steps of the process is modularized to keep the maximal flexibility to various cases. This paper will introduce the basic algorithmic considerations and different modules of this software.
2. GENERAL ARCHITECTURE AND ALGORITHMIC CONSIDERATIONS
2.1 Overall processing chain
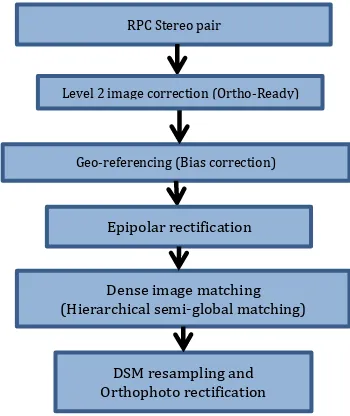
Figure 1 shows the general processing chain of the RSP software. The overall process follows a very classical roadmap, which is very similar to perspective stereo images. The
difference lies mainly in the sensory geometric processing, which exists around most parts of the procedure. The processing chain will first apply a level-2 image correction to make a uniform resampling in the flying direction, and then the bias correction is applied directly on the level-2 images (also called ortho-ready image). The processes of epipolar rectification, forward projection and point triangulation are different from those applied to perspective images, and the latter two require iterative approaches as there are no close-form solutions. Due to the large image format of the spaceborne data, the memory and matching method is reconfigured for processing.
Figure 1. A processing chain used for RSP
2.2 Bias Correction
The initial RPC parameters derived from the satellite navigation system usually contain bias, which should be corrected for carried out independently. If the GCPs are not available, relative orientation can be performed using tie points. In such a case, either the left or right image can act as the base image. Artificial GCPs can be computed by projecting the tie point in the base image to the mean height plane, and the bias correction can be carried out on the other images.
2.3 Epipolar Rectification
For push-broom images there are no strict epipolar lines available. However, since the orbits of spaceborne platform are very stable, for relatively small scenes, it is feasible to approximate the epipolar direction as a straight line (Morgan et al., 2004). Thus the stereo images can be digitally rectified in a way that the corresponding points are located on the same row of the rectified image grid. Different from the perspective images, in which the epipolar lines converge to the epipole, those of the push-broom images are parallel to each other. Therefore, a two-step approach as explained in (Kuschk et al., 2014) is applied to the epipolar rectification:
Geo-referencing (Bias correction) ISPRS Annals of the Photogrammetry, Remote Sensing and Spatial Information Sciences, Volume III-1, 2016
1) First compute a few corresponding lines starting with different part of the left image.
2) Perform a rigid 2D transformation to align these lines to the same row in the rectified image grid.
The rectification process is essentially a rigid 2D transformation for each of the stereo images to the epipolar images. The process is quite efficient, and the accuracy of the epipolar rectification relies on the tie/GCP measurement.
2.4 Hierarchical Semi-global Matching
The well-known semi-global matching (SGM) (Hirschmüller, 2008) is implemented as the current matching strategy for RSP. It applies a multi-path dynamic programming to optimize the following cost function:
∑ ( ) ∑ [ ] ∑ [ ] (3) The first term denotes the sum of matching cost for disparity . The second and the third term control the smoothness of the disparity map. is a logic function that evaluates the statements within it, and it returns 1 if true and 0 otherwise. is the neighboring pixel set of . is the penalty value for small disparity jump of 1 pixels , and applies penalties to disparity jump of more than 1 pixel, which often occurs at the surface discontinuities. Census cost (Zabih and Woodfill, 1994) is used in this implementation due to its robust performance against luminance variation.
The classic SGM creates for each disparity value, a raster to store the aggregated cost, thus requires a large volume of memory for computation. Hence a hierarchical solution is applied to run the classic SGM algorithm through a pyramid of the image. The algorithm has been described in (Rothermel et al., 2012). However, a major problem for the hierarchical strategy on the spaceborne image is that the coarsest layer may neglect important objects, so that they may not be recovered in the final layer. To retain high resolution in the coarsest layer of the pyramids, RSP restrains the disparity search within a given range (e.g. [-1000, 1000]) in the original resolution, at the same time it computes fewer pyramid layers according to the available memory. RSP also implements a tiled scheme to allow efficient memory management. According to the specifications of the machine, the tile size can be adjusted by the user.
3. SOFTWARE MODULES AND OPERATIONS
3.1 Software Architecture
To allow the maximal flexibility, the software provides four modules for data processing, as shown in Figure 2 denoted within rectangular brackets. The first three modules are used mainly for pre-processing, and the fourth module produces the final products. For different input of the data (panchromatic/multispectral, level 1/level 2), the processing chain can be adjusted by skipping/reordering some of them.
As shown in Figure 2, taking two stereo images and their associated RPC parameters as the input, RSP generates pixel-wise color/grey point clouds, triangular meshes, DSM raster and true orthophotos, where the DSM is pixel-wise overlaid with orthophoto. Either tie points or GCP (ground control points) can be used for geo-referencing the stereo images. Moreover, it accepts pre-calculated bias-correction parameters for
geo-referencing. The process contains four separate steps that can be adjusted and ordered to deal with different dataset.
Figure 2. Input-output functioning diagram of RSP
3.2 XML Control File
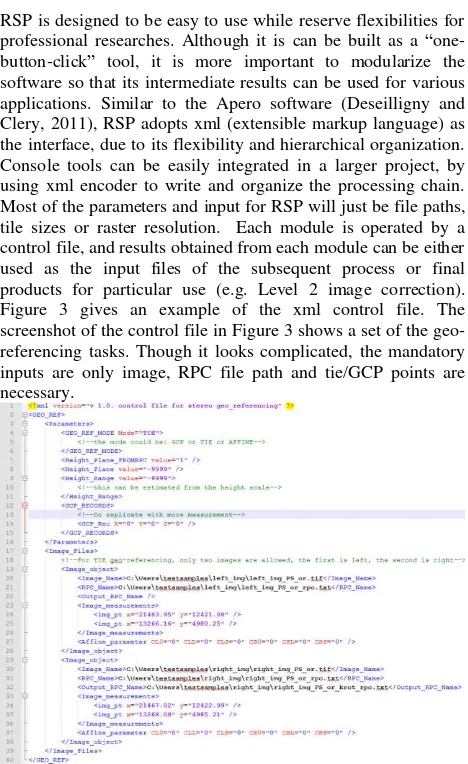
RSP is designed to be easy to use while reserve flexibilities for professional researches. Although it is can be built as a “ one-button-click” tool, it is more important to modularize the software so that its intermediate results can be used for various applications. Similar to the Apero software (Deseilligny and Clery, 2011), RSP adopts xml (extensible markup language) as the interface, due to its flexibility and hierarchical organization. Console tools can be easily integrated in a larger project, by using xml encoder to write and organize the processing chain. Most of the parameters and input for RSP will just be file paths, tile sizes or raster resolution. Each module is operated by a control file, and results obtained from each module can be either used as the input files of the subsequent process or final products for particular use (e.g. Level 2 image correction). Figure 3 gives an example of the xml control file. The screenshot of the control file in Figure 3 shows a set of the geo-referencing tasks. Though it looks complicated, the mandatory inputs are only image, RPC file path and tie/GCP points are necessary.
Figure 3. An example of a control file for geo-referencing.
Each module in the RSP software has a corresponding key word as part of the command, used as an identifier of the module, and the command for the console is “RSP KEYWORD
xml-file-path”.
3.3 Software Modules
As mentioned before, there are in total four modules for the current implementation, being: ortho-ready generation, Pan-sharpening, geo-referencing and DSM, orthophoto generation.
The following subsections will briefly introduce the functions of each module.
3.3.1 Ortho Ready Generation
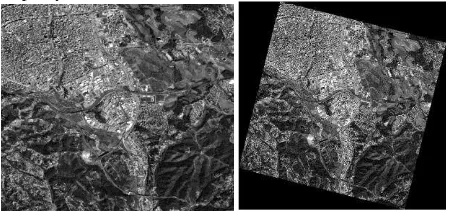
Ortho-ready images, also known as level-2 images, sometimes can be provided directly by the image provider. It projects the original level 1 image (flight direction + sampling direction) image to the mean plane of the terrain (northing and easting direction). The height for projection can be given as a parameter of the input, or can be extracted from the RPC files. The ortho-ready image is another representation of the original image as a map grid, and they are essentially the input for the subsequent modules, such as pan-sharpen and geo-referencing. This module can process a list of images for ortho-ready image generation and crop the common part of them, to facilitate the subsequent disparity estimation.
Figure 4. An example of level 1 image (left) and ortho ready image (level 2) (right).
3.3.2 Pan-sharpen
Pan-sharpen is an essential step for high resolution orthophoto generation. Though many commercial remote sensing software packages provide this function, it may potentially involve format conversion. Therefore, this module helps to bridge the processing pipeline into a complete solution in RSP. A subtractive resolution merging (SRM) method as explained in (Ashraf et al., 2013) is implemented as the core algorithm. This process accepts ortho-ready multispectral (MS) and panchromatic (Pan) images as an input, without any parameters needed for the SRM. A shift parameter can be optionally applied if there are any misalignments between the MS and Pan images.
3.3.3 Geo-referencing
The geo-referencing process is based on the ortho-ready images. A first order bias-correction is applied if there are more than three GCPs or tie point, otherwise a zero order bias-correction will be used. The geo-referencing module can also accept pre-computed bias parameters from other software. After the bias-correction, the RPC will be re-optimized.
3.3.4 DSM and Orthophoto Generation
This module generates the final products of the RSP software. It takes the geo-referenced ortho-ready images and their associated RPC parameters as the inputs. The major parts of the processing chain (Figure 1) are performed in this stage. It generates epipolar images, disparity maps, point clouds, DSM and orthophoto, fully automatically. Although the process could be set as parameter-less, RSP does provide a couple of tuneable parameters:
1) Disparity search range.
2) RGB (red, green, blue) band combination from the multispectral images for point clouds colorization 3) Tile size for the output point clouds
4) Whether or not to perform triangle-based hole filling
The three processes including point clouds generation, DSM, and orthophoto generation, can be performed independently. It can serve as a pure DSM sampler and interpolator by importing existing point clouds. Similarly, it can also take external DSM for true orthophoto generation, with visibility considered for VHR data.
4. EXAMPLES AND RESULTS EVALUATION
The RSP software has been used to compute DSMs and orthophotos from a wide range the current VHR satellite stereo images. The tested datasets include IKONOS, Worldview 1/2/3, Cartosat 1, ZiYuan-3 (ZY-3), Geoeye-1 and pleiades, with scene content varying from urban, suburban to natural landscapes. These results are used then for remote sensing analysis, change detection and 3D modelling.
4.1 Some Example Datasets
A few sample results are shown here. These contents include: 1) Worldview-2 data (DSM)
2) ZY-3 data (shaded DSM)
3) IKONOS dataset (color point clouds), grey-level version
Figure 5. DSM of a worldview-2 dataset generated by RSP
Figure 6. DSM and point clouds from IKONOS dataset generated by RSP. Top: grey-level coded DSM. Bottom, colorized point clouds.
Figure 7. Pixel-wise DSM and orthophoto, point clouds from ZY-3 data generated using RSP. Top: a shaded DSM. Bottom: colorized point clouds: left: false color; right: height-coded color point clouds.
4.2 Results Evaluation
The Terrassa dataset (Worldview-1) from the ISPRS benchmark ( http://www2.isprs.org/commissions/comm1/wg4/benchmark-test.html) is used for the accuracy analysis. In this area the ground reference data is available from LiDAR point clouds. Figure 8 shows a comparison between the reference LiDAR point clouds and the point clouds computed from RSP. The RSP gives per-pixel-per-point results, which looks even denser than the LiDAR point clouds.
(a)
(b)
Figure 8. Point clouds and DSM from LiDAR and stereo images of the Terrassa dataset. (a). Point clouds comparison. (b) DSM comparison: left column, DSM computed by RSP; right column, DSM from LiDAR data.
Since there may exist systematic errors between two data sources, a least squares surface matching is performed for accurate co-registration (Gruen and Akca, 2005). The standard deviation for the co-registration indicates the surface match of two datasets without blunders (using a 5- rule for blunder elimination). RMSE (root mean squared error) is the Euclidean distance between two surfaces (including blunders), for more detailed explanation please refer to (Akca et al., 2010; Gruen and Akca, 2005; Qin et al., 2014). The resulting statistics of the DSM accuracy from RSP against the reference LiDAR data are shown in Table 1.
Matching Percentage
(%) (m)
RMSE (m)
STD (m)
MEAN (m)
98.4 0.62 0.85 0.85 -0.05
Table 1. Accuracy statistics of RSP on the Terrassa dataset
It can be seen that between two surfaces is slightly larger than 1 pixel (0.5 m), and the RMSE is within two pixels, which demonstrates that the computed DSM from RSP highly aligns with the reference LiDAR data, and 98.4% of the pixels have found their correspondences. Figure 9 shows the error distribution of the RSP results. Large blunders mainly occur at bright and complex roofs, as well as thin roads. In overall the error distribution is quite consistent across the whole scene.
Figure 9. Error distribution of the computed DSM.
4.3 Running time
RSP is a pure CPU-based implementation, while all the operations are highly optimized. A few tests have been performed to illustrate of the processing efficiency of RSP. A
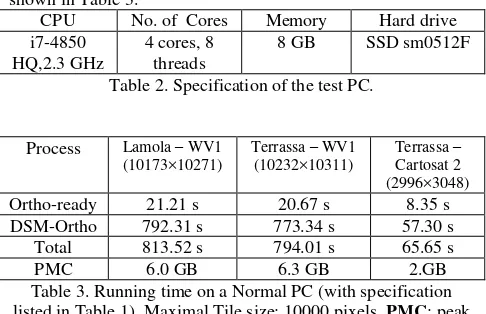
normal PC is used for this performance test, and its basic specification is listed in Table 2. Since the running time is highly related to the image dimension, different datasets with different dimension are computed, with their running time shown in Table 3.
Table 2. Specification of the test PC.
Process Lamola – WV1
Table 3. Running time on a Normal PC (with specification listed in Table 1). Maximal Tile size: 10000 pixels. PMC: peak
memory consumption.
It takes about 13 minutes to generate approximately 70 million points (17.5 km2), including the process of DSM resampling and ortho-rectification. The tiling scheme RSP provides could be easily scaled-up using more computational power for processing very large format images (city-wide, state-wide).
5. CONCLUSION
This paper has introduced an operational-ready software package named RSP (RPC stereo processor) that produces DSM and orthophoto from RPC-modelled stereo imagery. The aim of the development is to provide a handy tool to effectively process satellite stereo data modelled by RPF. RSP is highly optimized and can compute large-frame image very efficiently. The main working principle and software modules are introduced, and the evaluation on the Terrassa dataset in ISPRS benchmark has shown that RSP delivers a convincing result. Due to the high development intensity, automatic tie point measurements are not yet implemented, and multi-stereo fusion is not readily supported. In the next steps, fully automatic tie measurement, adjustment and multi-stereo processing will be implemented.
REFERENCES
Akca, D., M. Freeman, I. Sargent and A. Gruen, 2010. Quality assessment of 3D building data. The Photogrammetric Record 25 (132), 339-355.
Ashraf, S., L. Brabyn and B. J. Hicks, 2013. Alternative solutions for determining the spectral band weights for the subtractive resolution merge technique. International Journal of Image and Data Fusion 4 (2), 105-125.
Deseilligny, M. P. and I. Clery, 2011. Apero, an open source bundle adjusment software for automatic calibration and orientation of set of images. In: Proceedings of ISPRS International Workshop on 3D Virtual Reconstruction and Visualization of Complex Architectures, Trento, Italy, 2-4 March, pp. 269-276.
Fraser, C. S. and H. B. Hanley, 2003. Bias compensation in rational functions for IKONOS satellite imagery. Photogrammetric engineering and remote sensing 69 (1), 53-58.
Furukawa, Y. and J. Ponce, 2010. Accurate, dense, and robust multiview stereopsis. Pattern Analysis and Machine Intelligence, IEEE Transactions on 32 (8), 1362-1376.
Gruen, A. and D. Akca, 2005. Least squares 3D surface and curve matching. ISPRS Journal of Photogrammetry and Remote Sensing 59 (3), 151-174.
Hirschmüller, H., 2008. Stereo processing by semiglobal matching and mutual information. IEEE Transactions on Pattern Analysis and Machine Intelligence 30 (2), 328-341. Huang, X., L. Zhang and W. Gong, 2011. Information fusion of aerial images and LIDAR data in urban areas: vector-stacking, re-classification and post-processing approaches. International Journal of Remote Sensing 32 (1), 69-84.
Krauß, T., P. d'Angelo, M. Schneider and V. Gstaiger, 2013. The Fully Automatic Optical Processing System CATENA at DLR. International Archives of the Photogrammetry, Remote Sensing and Spatial Information Sciences 177-181.
Kuschk, G., P. d'Angelo, R. Qin, D. Poli, P. Reinartz and D. Cremers, 2014. DSM Accuracy Evaluation for the ISPRS Commission I Image matching Benchmark. The International Archives of the Photogrammetry, Remote Sensing and Spatial Information Sciences 40 195-200.
Morgan, M., K. Kim, S. Jeong and A. Habib, 2004. Epipolar geometry of linear array scanners moving with constant velocity and constant attitude. International Archives of the Photogrammetry, Remote Sensing and Spatial Information Sciences XXXV (B3), 1024-1029.
Noh, M.-J. and I. M. Howat, 2015. Automated stereo-photogrammetric DEM generation at high latitudes: Surface Extraction with TIN-based Search-space Minimization (SETSM) validation and demonstration over glaciated regions. GIScience & Remote Sensing 52 (2), 198-217.
Qin, R., 2014. Change detection on LOD 2 building models with very high resolution spaceborne stereo imagery. ISPRS Journal of Photogrammetry and Remote Sensing 96 (2014), 179-192.
Qin, R., A. Gruen and C. Fraser, 2014. Quality Assessment of Image Matchers for DSM Generation - A Comparative Study Based on UAV Images. In: Asian Conference on Remote Sensing, Nay Pyi Taw, Myanmar, 27-31, Octomber, 2014, pp. Rothermel, M., K. Wenzel, D. Fritsch and N. Haala, 2012. SURE: Photogrammetric Surface Reconstruction from Imagery. In: Proceedings LC3D Workshop, Berlin, pp.
Wenzel, K., M. Rothermel and D. Fritsch, 2013. SURE–The ifp Software for Dense Image Matching. In: Photogrammetric Week, pp. 59-70.
Zabih, R. and J. Woodfill, 1994. Non-parametric local transforms for computing visual correspondence. In: Proceedings of European Conference on Computer Vision, Stockholm, Sweden, May, pp. 151-158.
Zhang, Q., R. Qin, X. Huang, Y. Fang and L. Liu, 2015. Classification of Ultra-High Resolution Orthophotos Combined with DSM Using a Dual Morphological Top Hat Profile. Remote Sensing 7 (12), 16422-16440.


