MINERAL ABUNDANCE AND PARTICLE SIZE DISTRIBUTION DERIVED FROM
IN-SITU SPECTRA MEASUREMENTS OF YUTU ROVER
OF CHANG’E
-3
Honglei Lin a, b, Xia Zhanga, *, Yazhou Yang c, Xing Wu a, b, Dijun Guo b, d
a Institute of Remote Sensing and Digital Earth, Chinese Academy of Sciences, Beijing, China- (linhl, zhangxia, wuxing)@radi.ac.cn
b University of Chinese Academy of Sciences, Beijing, China
c Planetary Science Institute, School of Earth Sciences, China University of Geosciences, Wuhan, China- [email protected]
d Center for Lunar and Planetary Sciences, Institute of Geochemistry, Chinese Academy of Sciences, Guiyang, China- [email protected]
Commission III, ICWG III/II
KEY WORDS: abundance, particle size distribution, in-situ, Hapke, Sparse unmixing, spectroscopy
ABSTRACT:
From geologic perspective, understanding the types, abundance, and size distributions of minerals allows us to address what geologic processes have been active on the lunar and planetary surface. The imaging spectrometer which was carried by the Yutu
Rover of Chinese Chang’E-3 mission collected the reflectance at four different sites at the height of ~1m, providing a new insight to understand the lunar surface. The mineral composition and Particle Size Distribution (PSD) of these four sites were derived in this study using a Radiative Transfer Model (RTM) and Sparse Unmixing (SU) algorithm. The endmembers used were clinopyroxene, orthopyroxene, olivine, plagioclase and agglutinate collected from the lunar sample spectral dataset in RELAB. The results show that the agglutinate, clinopyroxene and olivine are the dominant minerals around the landing site. In location Node E, the abundance of agglutinate can reach up to 70%, and the abundances of clinopyroxene and olivine are around 10%. The mean particle sizes and the deviations of these endmembers were retrieved. PSDs of all these endmembers are close to normal distribution, and differences exist in the mean particle sizes, indicating the difference of space weathering rate of these endmembers.
* Corresponding author. [email protected] 1. INTRODUCTION
Knowing the types, abundance, and size distribution of minerals is fundamental for planetary science, allowing us to address what geologic processes have been active on the planetary surface(Clark, King et al. 1990). The imaging spectrometer
which was carried by the Yutu Rover of Chinese Chang’E-3 mission collected the reflectance at four different sites at the height of ~1m, providing a new insight to understand the lunar surface (Zhang, Yang et al. 2015).
The abundance and effective particle size of the minerals can be derived using radiative transfer modeling (Hapke 1981, Shkuratov, Starukhina et al. 1999). However, the attempt to get the abundance and particle size distribution at the same time is limited using hyperspectral data. With the help of the particle size distribution, geological environment may be specified.
Here we proposed a methodology to derive the abundance and Particle Size Distribution (PSD) of minerals using radiative transfer model and sparse unmixing algorithm. The initial results of CE-3 measurements were present in this study.
2. DATA
The data including CE-3 VNIR (Visible and Near-infrared Imaging Spectrometer) data and mineral endmembers were used in this study:
1) CE-3 VNIS data
Chang’E-3 landed in northern Mare Imbrium at 44.1205ºN, 19.5102ºW (Wang, Wu et al. 2017). Spectra of four locations were measured using the VNIR spectrometer instruments (Fig.1).
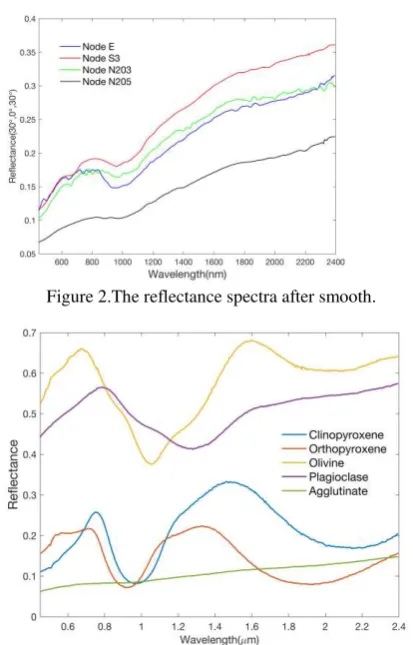
The noise was first removed using wavelet transform (Fig. 2).
2) Endmembers collected form RELAB database
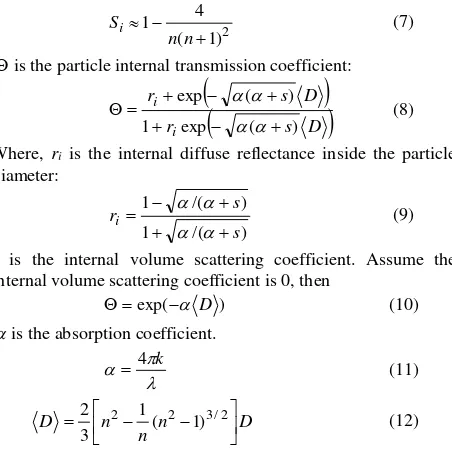
Endmembers including clinopyroxene, orthopyroxene, olivine, plagioclase and agglutinate were collected from RELAB database (Fig.3; Table 1). All the endmember spectra were measured at incidence angle 30º and emergence angle 0º. The International Archives of the Photogrammetry, Remote Sensing and Spatial Information Sciences, Volume XLII-3/W1, 2017
2017 International Symposium on Planetary Remote Sensing and Mapping, 13–16 August 2017, Hong Kong
This contribution has been peer-reviewed.
Figure 1. The four spectra measured by CE3. These four spectra are reflectance after photometric corrections (Jin, Zhang et al. 2015, Zhang, Yang et al. 2015).
Figure 2.The reflectance spectra after smooth.
Figure 3.The endmember spectra used in this study (Li and Li 2011, Shuai, Zhang et al. 2013).
Table 1 Mineral endmembers used in this study Mineral Name Sample ID Particle Size Real part of
refraction Clinopyroxene LS-CMP-009 0-250 1.73
Orthopyroxene LS-CMP-012 0-250 1.77
Olivine LR-CMP-014 0-45 1.83
Plagioclase LS-CMP-086 0-20 1.56 Agglutinate
LU-CMP-007-1
100-1000 1.49
3. METHODILOGY
The mineral abundance and PSD was derived in a three-step process: First, the k value of each endmember was calculated by solving the Hapke radiative transfer model. Second, the single-scattering albedos with different particle sizes were derived based on Hapke slab model, providing an endmember library. The reflectance of CE-3’s measurements were also converted to single-scattering albedo. At last, the abundance and particle size distribution of each endmember was derived using sparse unmixing algorithm.
3.1 Reflectance to single-scattering albedo
Minerals are generally present as intimate mixtures, and the optical characteristics of such mixtures depend on many parameters, such as the absorption and scattering characteristics, grain size of each component, and the average optical distance between reflections. Hapke proposed the function between the single-scattering albedo and reflectance r, assuming that particles are larger than wavelengths of light (Hapke 1981):
(1 ( )) ( ) ( ) ( ) 1
cosines of the angles of incidence and emergence, respectively, g is phase angle. B (g) is the backscattering:)]
is filling factor, setting to be 0.41 for lunar regolith. P(g) is the phase function, which is expressed as:
)
polynomials, b and c are set as -0.4 and 0.25, respectively.
H is a multiple-scattering function:
1
3.2 Conversion of imaginary part of optical constants
The optical constants and grain sizes of each mineral are the key variables for calculating the mineral single-scattering albedos. The mineral optical constants can be obtained based on Hapke or Shkuratov radiative transfer model (Hapke 1981, Shkuratov, Starukhina et al. 1999). Here, we used a Hapke radiative transfer model to retrieve the imaginary indices k of optical constants for the self-consistency of the model. The real part n
of optical constants are considered as a constant, because it
doesn’t vary more than 0.1 in the VIS-NIR wavelength(Roush 2003). Single-scattering albedos of the endmembers were calculated based on the Hapke model for a given grain size.
Where, Se is the reflectivity for external incident light:
05
2
is the particle internal transmission coefficient:
internal volume scattering coefficient is 0, then) exp( D
(10)
is the absorption coefficient.
According to the equations above, the single-scattering albedo is the function of n, k, and particle diameter D. Thus, the imaginary indices can be calculate if the n, D, are given. The single-scattering albedos of mineral endmembers with different particle sizes were calculated based on the obtained k
values. And then an endmember library was built for spectral unmixing.
3.3 Sparse unmixing algorithm
Sparse unmixing is designed to determine the optimal subset of signatures from a large spectral library that can best model each mixture. It is a linear model that can be written as follows (Iordache, Bioucas-Dias et al. 2011):
1 regularization parameter, which controls the relative weight of the sparsity of the solution. The number of endmembers present in a mixed pixel is usually much smaller than the availability of the spectral library, making the sparsity constraint useful. The average single-scattering albedo of mixture is a linear combination of the K-component:
each component. Assuming the particles have approximately the same shape, the equation of Fi is: abundance and particle size from the endmember library.4. RESULTS
The k values (Fig.4) of all endmembers were first obtained based on section 3.2. Then the single-scattering albedos of all the minerals were calculated for different particle sizes. Thus, an endmember library including different minerals with vary grain sizes was constructed. Finally, the single-scattering albedos of four spectra (Fig.5) measured by CE-3 were calculated according to section 3.1 and unmixed using sparse unmixing algorithm (section 3.3) to get the abundances and PSDs of each mineral.
Figure 4. The k values for mineral endmembers used in this study.
Figure 5. The single-scattering albedos of four locations measured by CE3.
4.1 Derived abundance and particle size
1) Node E
agglutinate may be finer, but the particle size smaller than 5 m
was not used due to the assumption of Hapke model (particles are larger than wavelengths of light).
The International Archives of the Photogrammetry, Remote Sensing and Spatial Information Sciences, Volume XLII-3/W1, 2017 2017 International Symposium on Planetary Remote Sensing and Mapping, 13–16 August 2017, Hong Kong
This contribution has been peer-reviewed.
Figure 6. Comparison of modeled and measured single-scattering albedo spectra of location Node E.
Figure 7. Particle size distribution of each mineral in location Node E.
2) Node S3, Node N203 and Node N205
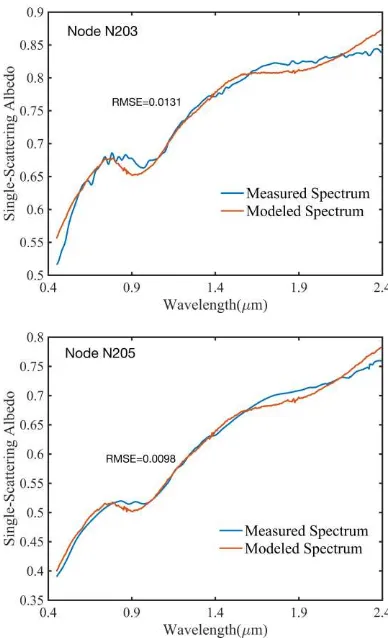
The results of Node S3, Node N203 and Node N205 have poor performance on model fitting (Fig.8), indicating that the endmembers in the library might not be sufficient. An appropriate endmember library should be constructed in the future work.
Figure 8. Comparisons of modeled and measured single-scattering albedo spectra of location Node S3, Node N203 and Node N205.
5. DISCUSSION
Among the four experiments, the spectrum measured in location Node E is modelled very well, the poor performance beyond 1600nm may be caused by thermal effects. For the other three locations, the modelled and measured spectra cannot match very well. There are probably two major reasons: 1) the endmembers used in this study were inappropriate 2) the thermal effect. Thus, our next work is to select more endmembers, including the olivine with different fo number, pyroxene with different calcium, iron and magnesium, plagioclase with different iron. The thermal effects will also be corrected combing the data of other missions (e.g. LRO DIVINER).
6. CONCLUSION
REFERENCE
Clark, R. N., T. V. V. King, M. Klejwa, G. A. Swayze and N. Vergo, 1990. High Spectral Resolution Reflectance Spectroscopy of Minerals. Journal of Geophysical Research-Solid Earth and Planets 95(B8),pp. 12653-12680.
Hapke, B. , 1981. Bidirectional Reflectance Spectroscopy .1. Theory. Journal of Geophysical Research, 86(Nb4), pp. 3039-3054.
Iordache, M. D., J. M. Bioucas-Dias and A. Plaza, 2011. Sparse Unmixing of Hyperspectral Data. Ieee Transactions on Geoscience and Remote Sensing, 49(6), pp. 2014-2039.
Jin, W. D., H. Zhang, Y. Yuan, Y. Z. Yang, Y. G. Shkuratov, P. G. Lucey, V. G. Kaydash, M. H. Zhu, B. Xue, K. C. Di, B. Xu, W. H. Wan, L. Xiao and Z. W. Wang, 2015. In situ optical measurements of Chang'E-3 landing site in Mare Imbrium: 2. Photometric properties of the regolith. Geophysical Research Letters, 42(20), pp. 8312-8319.
Li, S. A. and L. Li, 2011. Radiative transfer modeling for quantifying lunar surface minerals, particle size, and submicroscopic metallic Fe. Journal of Geophysical Research-Planets, pp. 116.
Roush, T. L., 2003. Estimated optical constants of the Tagish Lake meteorite. Meteoritics & Planetary Science, 38(3), pp. 419-426.
Shkuratov, Y., L. Starukhina, H. Hoffmann and G. Arnold, 1999. A model of spectral albedo of particulate surfaces: Implications for optical properties of the moon. Icarus, 137(2), pp. 235-246.
Shuai, T., X. Zhang, L. F. Zhang and J. N. Wang, 2013. Mapping global lunar abundance of plagioclase, clinopyroxene and olivine with Interference Imaging Spectrometer hyperspectral data considering space weathering effect. Icarus, 222(1), pp. 401-410.
Wang, Z. C., Y. Z. Wu, D. T. Blewett, E. A. Cloutis, Y. C. Zheng and J. Chen, 2017. Submicroscopic metallic iron in lunar soils estimated from the in situ spectra of the Chang'E-3 mission.
Geophysical Research Letters, 44(8), pp. 3485-3492.
Zhang, H., Y. Z. Yang, Y. Yuan, W. D. Jin, P. G. Lucey, M. H. Zhu, V. G. Kaydash, Y. G. Shkuratov, K. C. Di, W. H. Wan, B. Xu, L. Xiao, Z. W. Wang and B. Xue, 2015. In situ optical measurements of Chang'E-3 landing site in Mare Imbrium: 1. Mineral abundances inferred from spectral reflectance.
Geophysical Research Letters, 42(17), pp. 6945-6950.
The International Archives of the Photogrammetry, Remote Sensing and Spatial Information Sciences, Volume XLII-3/W1, 2017 2017 International Symposium on Planetary Remote Sensing and Mapping, 13–16 August 2017, Hong Kong
This contribution has been peer-reviewed.