Comparison of Lunar Topographic Models Derived from Multiple Sources
Based on Least Squares Matching
J. Guo*, B. Wu
Department of Land Surveying & Geo-Informatics, The Hong Kong Polytechnic University, Hung Hom, Kowloon,
Hong Kong – [email protected]
Commission IV, WG IV/7
KEY WORDS: Lunar Topographic Model,Comparison, Surface Matching, Least Squares, Chang’E-1, SELENE
ABSTRACT:
Lunar topographic information is of paramount importance for lunar exploration missions and lunar scientific investigations. For lunar topographic models derived from different sources or missions, it is not uncommon to see inconsistencies among them. This paper presents a detailed comparative analysis of lunar topographic models derived from the Chang’E-1 and SELENE altimeter data. A least squares matching method is developed to register one topographic model to the other through a seven parameters transformation (three translation parameters, three rotation parameters, and one scale factor). Two typical study areas on the Moon are selected for detailed investigation, including the Sinus Iridium (the primary candidate landing site area for future Chinese robotic or human landed missions) and the Apollo 15 landing site area. Experimental results indicate that there are small shifts in both horizontal and vertical directions between these two data sets. After the least squares matching and shift removal, the topography derived from the two data sets show a consistent trend.
1. INTRODUCTION
Lunar topographic information is of paramount importance for lunar exploration missions and lunar scientific investigations. Starting from the 1960s, a vast amount of lunar topographic data, including lunar images and laser altimeter data have been collected and processed in the Apollo missions (Mellberg, 1997) and the Clementine mission (Smith et al., 1997; Rosiek et al., 1999). More recently, China launched its first lunar probe Chang’E-1 in October 2007 (Ouyang et al., 2008; Zheng et al., 2008). The Japanese lunar mission SELENE (SELenological and ENgineering Explorer) was launched in September 2007 (Kato et al., 2008). The United States also successfully launched its LRO (Lunar Reconnaissance Orbiter) to the Moon in June 2009 (NASA, 2009). Among the payload on-board the Chang’E-1, SELENE, and LRO, there are sensors (e.g., cameras and laser altimeters) collect lunar topographic data at various levels of resolution. These new data sets enable a new era of lunar topographic modelling with the capabilities of providing more detailed and precision lunar topographic information.
For lunar topographic models generated from the imagery or laser altimeter data from different sources or missions, it is not uncommon to see inconsistencies among them due to unavoidable reasons (e.g., different data collecting times, errors from sensor positions and orientations, and different data processing methods). Systematic study of the inconsistencies between the lunar topographic models derived from different sources will be helpful to evaluate the accuracies of the topographic data and understand the performances of the sensors. This paper presents a detailed comparative analysis of lunar topographic models derived from different sources (i.e., from Chang’E-1 and SELENE altimeter data) based on least squares matching method. The longitude, latitude, and altitude coordinates in the Mean-Earth/polar axis (ME) coordinate system of the laser altimeter points are used for analysis for both the Chang’E-1 and SELENE data sets.
After giving a literature review on previous related works, a least squares matching method employing seven transformation parameters (three translation parameters, three rotation parameters, and one scale factor) is developed for the comparative analysis of different lunar topographic models. The Chang’E-1 and SELENE laser altimeter data at the Sinus Iridium area and Apollo 15 landing site are employed for detailed experimental analysis. Finally, concluding remarks are presented and discussed.
2. RELATED WORK
The topography of the Moon has been measured by several approaches, including radar interferometry, stereo-photogrammetry, and laser altimetry. Because of the Moon’s synchronous rotation, most early lunar topography results were restricted to the nearside. For the far-side of the Moon, both the accuracy and resolution were tremendously poor. Smith et al. (1997) reported the first reliable near-global topographic model of the Moon, the GLTM2, which was obtained by the Clementine LIDAR mission in 1994. USGS combined Earth-based radar interferometry data, Clementine stereoimages measurements, and Earth-based photos from Apollo, Mariner 10, and Galileo to generate the Unified Lunar Control Network 2005 (ULCN 2005), which is the latest global control network of the Moon (Archinal, 2005). More recently, a mass amount of lunar topographic data has been collected by the new lunar missions in the past several years, e.g., the Chang’E-1, SELENE, and LRO missions.
For the comparative analysis of lunar topographic models derived from different sources, İz et al. (2011) examined the consistency of the Chang’E-1 and SELENE reference frames in the global scale through the analysis of a large number of nearly co-located laser altimeter points from these two missions. A twelve parameter affine transformation model was used for comparison in the form of rigid body motions and
deformations. They found that the estimated relative rigid body motion and deformation parameters between the two reference frames are consistent (i.e., nearly zero estimates for the translations, rotations, and shear parameters), while the three strain parameters, which are similar in magnitude and sign, reveal a statistically significant scale difference of about 0.9×10⁻⁶ between the Chang’E-1 and SELENE reference frames.
Ping et al. (2009) used more than 3 million topographic measurements collected by the Chang’E-1 laser altimeter to produce an accurate global lunar topographic model named CLTM-s01. A detailed comparison between CLTM-s01 and other lunar topographic data, including the Clementine LiDAR data and the ULCN 2005 was presented. Clementine LiDAR has 72548 valid laser points, which is less than 2% of the Chang’E-1 Laser Altimeter data. Clementine LiDAR data didn’t cover the whole Moon. There are some areas with no or sparse data, especially in the Polar regions. ULCN 2005 combines all the historical stereo photos (e.g. Apollo photos, Clementine images), with the interpolated resolution of about 6.8 km and the elevation accuracy of laser measurements approximate 100m, respectively. For the CLTM-s01 model, the resolution is about 7 km and vertical accuracy is about 31 m, respectively. The comparative analysis revealed that over the large Maria regions on the near-side of the Moon, the differences are very little within 200 m, however, over the far-side of the Moon these differences are quite large. The comparative results show that Chang’E-1 laser altimeter model is an improvement of earlier models, including the Clementine model and ULCN 2005, not only in data coverage and range measuring accuracy, but also in spatial resolution.
Li et al.(2010) compared the DEMs (digital elevation model) generated from the Chang’E-1 data with those from the SELENE data using a wash-off relief map of the middle and low latitude. The results show an identical trend with similar data precision and spatial resolution. Li et al. (2010) also examined the differences of the highest and lowest points displayed in Chang’E-1 DEM and the SELENE DEM. For the highest point there is only subtle difference between the two DEMs, the point in SELENE DEM was about 100 m higher than the similar point on the Chang’E-1 DEM model. However, the plane position difference is up to 5.38 km for the lowest. The lowest point in Chang’E-1 DEM model was over 100 m higher than the lowest point in SELENE DEM model.
For surface comparison or matching between different topographic data sets, vast of efforts have been performed in the past. Williams (1999) studied the registration of three dimensional data sets with rigid motions. The registration process is comprised of two steps: correspondence selection and motion estimation. Besl and Mckay (1992) developed an ICP (Iterative Closest Point) algorithm for surface matching. The basic theory of ICP is based on the search of pairs of the nearest points in the two sets, estimating the rigid transformation, and iteratively refining the transformation by repeatedly generating pairs of corresponding points on the two sets by minimizing an error metric. However, this algorithm required a lot of calculation due to the exhaustive search of the nearest point. Other researches proposed improved and accelerated algorithm based on the ICP method (Park and Subbarao, 2003). Dijkman and van den Heuvel (2002) presented a semi-automatic registration method based on the Least Square Matching method. The registration is performed using the parameters of
described an automatic method for surface registration using template shaped targets. In this algorithm, seven parameters including three transformations, three rotations, and one scale factor could be obtained synchronously.
For the comparative analysis of lunar topographic models derived from different sources, only simple and straightforward methods were used in the past, and the comparisons were mostly focused on the global scale for the whole Moon. This research presents a detailed comparison of different lunar topographic models in specific local regions based on a strict least squares matching method.
3. COMPARISON OF LUNAR TOPOGRPHIC MODELS DERIVED FROM CHANG’E-1 AND SELENE DATA 3.1 Overview of the Approach
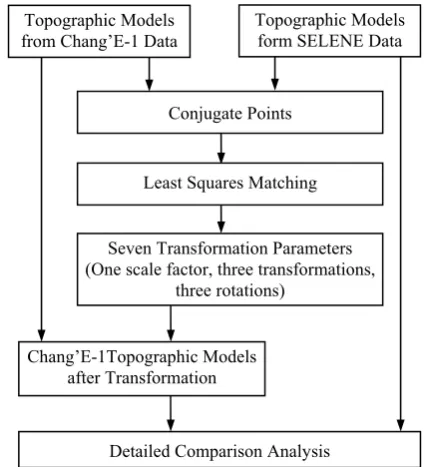
Different lunar topographic models derived from the Chang’E-1 and SELENE laser altimeter data are used for comparative analysis in this research. The framework of the comparative analysis approach is illustrated in Figure 1. The least square adjustment model integrates topographic data derived from the Chang’E-1 and SELENE data using several conjugate points through a strict mathematic model. Conjugate points were carefully identified manually, which are obvious terrain features (e.g., mount peaks or centers of craters) and evenly distributed in the study region. After the least squares matching, seven parameters (one scale factor, three transformations, and three rotations) can be obtained. Finally, the detailed comparative analyses between these two data sets are performed.
Figure 1. Framework of the least square adjustment approach for the Chang’E-1 and SELENE laser altimeter data
3.2 Surface Matching Based on Least Squares Method Due to the different times and the different sensors at different positions, from which Chang’E-1 laser altimetry data and SELENE laser altimetry data were obtained, the inconsistencies must exist between the two data sources. Assume s (x, y, z) and f (x, y, z) are conjugate regions of the Moon, from which
Seven Transformation Parameters (One scale factor, three transformations,
three rotations)
data) were chosen, respectively. This method estimates the transformation parameters of a 3D transformation, which satisfies the least squares matching of the search surface to the template surface. Akca (2007) reported that in an ideal situation one would have
s (x, y, z) = f (x, y, z) (1)
Because of the effects of random errors, Equation (1) is not consistent. Therefore, a true error vector v(x, y, z) is added, which is expressed as:
s (x, y, z)-v(x, y, z) = f (x, y, z) (2)
Equation (2) is an observation equation, which functionally connects the observations s (x, y, z) to the parameters of f (x, y, z). The matching is achieved by least squares minimization of a function, minimizing the sum of squares of the Euclidean distances between the conjugate points on both surfaces. This surface matching technique is a generalization of the least squares matching concept and offers high flexibility for any type of 3D surface correspondence problem, as well as a statistical tools for the analysis of the quality of final matching results.
To express the geometric relationship between the conjugate surface patches, a 7-parameter 3D similarity transformation is applied: vector. Each observation is related to a linear combination of the parameters, which are variables of a deterministic unknown function. The observation equations of the least squares adjustment can be represented in matrix form as Equation (4):
V = AX – L, P (4)
where X is the unknown vector to be solved, L is the observation vector, A is the coefficient matrix containing the partial derivatives from each observation, and P is the a priori weight matrix of the observations that reflects measurement quality and the contributions of the observations to the final result.
The seven transformation parameters obtained from the above least squares process represent the overall differences between the two topographic models. By applying the seven transformation parameters to one reference topographic model (e.g., the one Chang’E-1 data), one set of data can be matched to another using the parameters, and finally a detailed comparison can be performed.
3.3 Comparative Analysis of Lunar Topographic Models from Chang’E-1 and SELENE Data
Two typical study areas on the Moon are selected for detailed investigation. The first one is the Sinus Iridium, which is the primary candidate landing site area for future Chinese robotic or human landed missions. The second one is the famous Apollo 15 landing site area. Sinus Iridium is located at 44.1° N, 31.5° W with a diameter of 236 km, which is surrounded from the northeast to the southwest by the long range. The Sinus Iridium is considered as one of the most beautiful features on the Moon, and its bay and surrounding mountains are a favourite among lunar observers. The Apollo 15 landing site is located at 26.08° N, 3.66° E at the foot of the Apennine mountain range. Two typical terrain features can be identified in this area, including the winding Hadley Rille and Apennine Mountains
(http://www.nasm.si.edu/collections/imagery/apollo/AS15/a15l andsite.htm).
3.3.1 Experiments at the Sinus Iridium Area
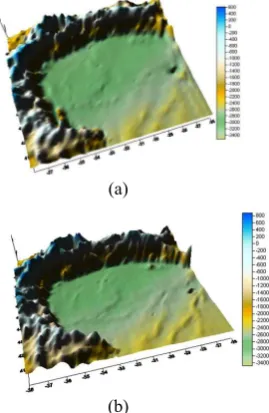
At the Sinus Iridium area, two DEMs were interpolated using the Chang’E-1 laser altimeter data and SELENE laser altimeter data with the same resolution 1200 m (see Figure 2). The unit of horizontal and vertical axis is degree, while the height information is expressed with meter. Figure 3 shows the Chang’E-1 and SELENE laser altimetry data directly overlaid on the Chang’E-1 images (backward images) at the Sinus Iridium area, respectively. Figure 4 shows the 2D grey-scale images of the DEMs. They are used to help identifying conjugate points on the two surfaces. There is a total of six conjugate points selected in this study area for further surface matching purpose. Due to the rare texture identified in the middle of the relative plat bay, most of the conjugate points were selected along the range and the center of the small craters, for example, mainly mountain peaks and typical terrain features were chosen. A seven parameter transformation was performed to match the Chang’E-1 DEM to the SELENE DEM using the conjugate points based on the least squares method as discussed above.
(a)
(b)
Figure 2. Interpolated DEM with the same resolution of 1200 m using Chang’E-1 (a) and SELENE (b) laser altimetry data at the Sinus Iridium area, respectively
(a) (b)
Figure 3. The registered Chang’E-1 (a) and SELENE laser altimetry data (b) directly overlaid on the Chang’E-1 images (backward images) at the Sinus Iridium area, respectively
(a) (b)
Figure 4. The 2D grey-scale images from Chang’E-1 laser altimetry data (a) and SELENE laser altimetry data (b) with the same 360-m resolution
The obtained transformation parameters were used to register the Chang’E-1 laser altimeter data to the SELENE reference frame and remove the systematic shifts between them. After the least squares adjustment, the internal relative positions and orientations of the two DEMs remain the same. Table 1 shows the obtained transformation parameters between the Chang’E-1 DEM and the SELENE DEM, which indicate the differences in the positional and orientation components between these two data sets. For the Sinus Iridium area, there is about 288 m offset between these two data sets in the horizontal direction, and the SELENE laser altimeter data is higher than the Chang’E-1 laser altimeter data by about 550 m. The deviations in rotations between these two data sets are small. The scale factor is approximately 1.
Name Values at
Sinus Iridium
Scale 1.00746
ΔX (longitude, degree) 0.0290204 (880m)
ΔY (latitude, degree) -0.0305055 (-925m)
ΔZ (altitude) 544.733 m
Δ
ϕ
(arc) 0.0038Δ
ω
(arc) -4.5158e-004Δ
κ
(arc) 0.0014Table 1. Transformation parameters between Chang’E-1 and SELENE laser altimeter data at Sinus Iridium area
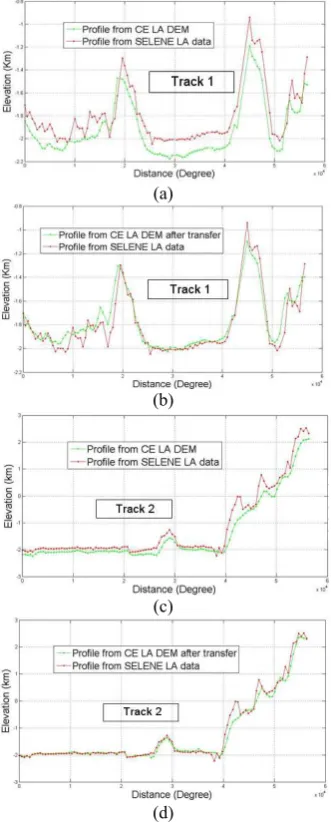
To further examine the performances of the least squares adjustment, two tracks of the SELENE laser altimeter data were selected for detailed analyses at the Sinus Iridium area, as illustrated in Figure 3(b), which are much denser than the
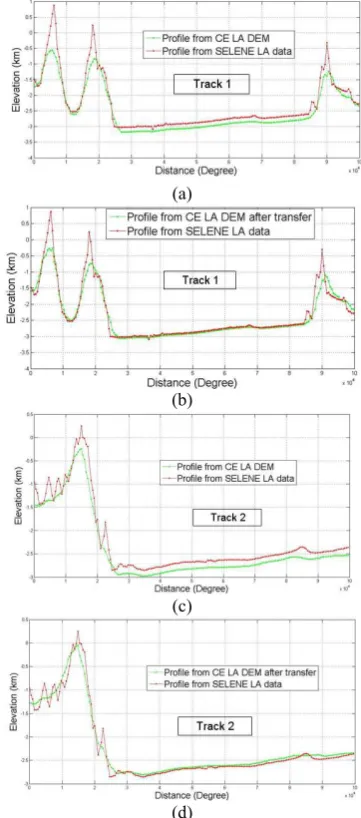
were derived. The first profile was obtained by directly connecting the SELENE laser points on the track (red lines in Figure 5). The second profile was derived from the interpolated DEM generated from the Chang’E-1 laser altimetry data (blue lines in Figure 5). These profiles can be used to examine the relative topography derived from the data sets from these two missions.
(a)
(b)
(c)
(d)
Figure 5. Profiles comparison between the SELENE and Chang’E-1 data sets, (a) and (b): the profiles from track 1 before and after transformation, respectively, (c) and (d): the profiles from track 2 before and after transformation, respectively
From Figure 5, it can be noticed that the general trend among these profiles are identical to the real terrain of the Moon. Because the DEM are interpolated from the relatively sparse Chang’E-1 laser altimeter points which may not be sufficient to represent the actual topography in the area. The profile derived from the DEM generated using the Chang’E-1 laser altimetry data show relatively smooth topography compared with the other one. Statistical data including average, maximum, minimum and standard deviation values of the differences for each track and the whole area before and after the Least Squares Matching at Sinus Iridium area are listed in Table 2.
The differences may be caused by the possible errors in the registration of the two data sets and the possible errors in the SELENE laser altimeter data and the Chang’E-1 data.
Table 2. Statistical data for each track and the whole area of 2D grey-scale images at Sinus Iridium area before and after Least Squares Matching
3.3.2 Experiments at the Apollo 15 Landing Site Area
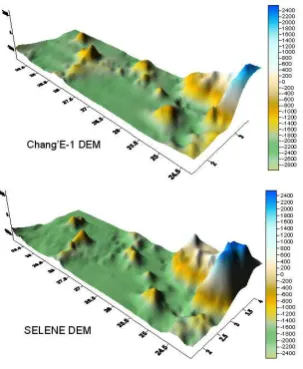
At the Apollo 15 landing site area, two DEMs were first interpolated using the Chang’E-1 laser altimetry data and SELENE laser altimeter data with the same resolution 1200 m (see Figure 6), whose unit is the same with the Sinus Iridium area. Figure 7 shows the registered original Chang’E-1 and SELENE laser altimetry data directly overlaid on the Chang’E-1 images (backward images) at the Apollo Chang’E-15 landing site, respectively. Figure 8 shows the 2D grey-scale images of the DEMs which are used to identify the conjugate areas on the two images. There are totally six conjugate points chosen at this landing site for further surface matching. The main mountain peaks and typical terrain features were carefully selected manually and evenly distributed in the study area. Similar to the Sinus Iridium area, a seven parameter transformation was conducted to match the Chang’E-1 DEM to the SELENE DEM using the conjugate points.
Figure 6. Interpolated DEM with the same resolution of 1200 m using Chang’E-1 and SELENE laser altimetry data at the Apollo 15 landing site area, respectively.
(a) (b)
Figure 7. The registered Chang’E-1 (a) and SELENE laser altimetry data (b) directly overlaid on the Chang’E-1 images (backward images) at the Apollo 15 landing site, respectively
(a) (b)
Figure 8. The 2D grey-scale images from Chang’E-1 laser altimetry data (a) and SELENE laser altimetry data (b) with the same 360-m resolution
Table 3 also shows the obtained transformation parameters between the Chang’E-1 DEM and the SELENE DEM, which indicate the differences in the positional and orientation components between these two data sets. For the Apollo 15 landing site area, there is about 288 m offset between these two data sets in the horizontal direction, and the SELENE laser altimeter data is higher than the Chang’E-1 laser altimeter data by about 150 m. The deviations in rotations between these two data sets are very small, which show the consistent results with our recent study (Wu et. al., 2011). The scale factor is approximately 1, which means there is very small differences between these two models for scale aspect.
Name Apollo 15 landing site Value
Scale 1.00101
ΔX (longitude, degree) -0.00627942 (-190m)
ΔY (latitude, degree) -0.00716208 (-217m)
ΔZ(altitude) 148.526 m
Δ
ϕ
(arc) 0.0083Δ
ω
(arc) -0.0024Δ
κ
(arc) 0.0015Table 3. Transformation parameters between Chang’E-1
and SELENE laser altimeter data at the Apollo 15
Landing Site area
Sinus Iridium Average (m)
Max (m)
Min (m)
Stdv (m)
Track 1 Before 181.05 1520.7 7.32 219.55
After 51.88 1207.45 1.67 218.95
Track 2 Before 157.98 679.44 6.25 109.8 After 22.51 455.65 1.56 109.75 Whole
area
Before 160 1700 — 150
After 10 1520 — 145
As with previous experimental analysis for the Sinus Iridium area, two tracks of the SELENE laser altimeter data at the Apollo 15 landing site area covering the typical terrain were selected for further analysis, which were illustrated in Figure 7 (b). The first profile was obtained by directly connecting the SELENE laser altimeter points on the track (red lines in Figure 9). The second profile was derived by directly interpolating the DEM from the Chang’E-1 laser altimeter points (blue lines in Figure 9).
(a)
(b)
(c)
(d)
Figure 9. Profile comparison between the SELENE and Chang’E-1 data sets, (a) and (b) : the profiles from track 1 before and after transformation, respectively, (c) and (d) : the profiles from track 2 before and after transformation, respectively
From Figure 9, it can be noticed that the general trend among these profiles are identical to the real terrain of the Moon. However, differences between them before and after the least squares matching can also be found. Statistical data including average, maximum, minimum and standard deviation values for each track and the whole area of 2D grey-scale images before and after the Least Squares Matching at the Apollo 15 Landing Site area are listed in Table 4.
Table 4. Statistical data for each track and the whole area of 2D grey-scale images at Apollo 15 Landing Site area before and after Least Squares Matching
4. CONCLUSIONS AND DISCUSSION
The least squares adjustment model presented in this paper provides a mathematical model to transfer one lunar data to another data from a different lunar mission. The experimental analyses using the data sets at the Sinus Iridium and the Apollo 15 landing site areas lead to the following conclusions:
(1) This study reveals that although the derived DEM from Chnag’E-1 laser altimeter data and SELENE laser altimeter data presented relatively consistent trend, inconsistencies may exist between the lunar data from different missions due to the unavoidable errors (e.g. different time to get data, errors from sensor positions and orientations, and different data processing methods). Through compare the Chang’E-1 DEM and SELENE DEM derived from the laser altimetry data using profiles of each track at two selected typical areas, small shifts (288m and 1.3 km in horizontal, 550 m and 150 m in altitude for the Sinus Iridium and Apollo 15 data sets, respectively) between these two data sets were found.
(2) It indicates that the least squares adjustment can significantly reduce the inconsistencies between the topographic models derived from the laser altimeter data from different missions. At the same time, seven transformation parameters, including one scale factor, three transformation parameters and three rotation parameters were obtained, which could help examine the differences between them and transfer one data sets to the other.
It is very valuable to find the differences between the lunar data from different lunar missions, because it could help generate more precise terrain models. This will be more in demand when Chang’E-3 and other new lunar probes have been launched to the Moon. Currently, only some control points have been selected manually, future research will study the line and area matching between different data sets, which will be more reliable.
ACKNOWLEDGMENTS
The authors would like to thank the National Astronomical Observatories of the Chinese Academy of Sciences for providing the Chang’E-1 data sets. The work described in this paper was supported in part by a grant from the Research Grants Council of Hong Kong under Project PolyU 5312/10E and in part by the Hong Kong Polytechnic University under GrantA/C 1-BB83.
References:
Akca, D., 2007. Least Squares 3D Surface Matching. A PhD Apollo 15
Landing Site
Average (m)
Max (m)
Min (m)
Stdv (m)
Track 1 Before 122.77 397.37 1.03 84.04 After 27.84 256.06 0.35 72.29 Track 2 Before 215.39 882.99 0.94 18.2
After 52.84 669.33 0.78 164.6 Whole
Area
Before 140 1680 — 180
After 10 1560 — 160
Archinal ,B. A., M. R. Rosiek, and B. L.,2005. Unified lunar control control network 2005 and topographic model. Lunar and Planetary Science XXXVI.
Besl, p.J., and McKay, N.D., 1992. A method for registration of 3D shapes. IEEE Transactions on Pattern Analysis and Machine Intelligence, 14 (2), pp.239-256.
Dijkman, S.T., and van den Heuvel, F.A., 2002. Semi automatic registration of laser scanner data. International Archives of Photogrammetry, Remote Sensing and Spatial Information Sciences, 34 (5), pp.12– 17.
Gruen, A., and G. Akca, D., 2005. Least squares 3D surface and curve matching. ISPRS Journal of Photogrammetry & Remote Sensing, pp.151-174.
İz H. B., Y. Q. Chen, X. L. Ding, B. A. King, C. K. Shum, C. Wu, and M. Berber, 2011. Assessing Consistency of Chang’E-1 and SELENE Reference Frames using Nearly-colocated Laser Altimetry Footprint Positions, Chinese Journal of Science, special issue on recent lunar missions, published online.
Kato, M., S. Sasakia, K. Tanakaa, Y. Iijimaa, and Y. Takizawaa, 2008. The Japanese lunar mission SELENE: Science goals and present status. Advances in Space Research, vol. 42, no. 2, pp. 294-300.
Li, C. L., X. Ren, J. Liu, X. Zou, L. Mou, J. Wang, R. Shu, Y. Zou, H. Zhang, C, Lv, J. Liu, W. Zuo, Y. Su, W. Wen, W. Bian, M. Wang, C. Xu, D. Kong, X. Wang, F. Wang, L. Geng, Z. Zhang, L. Zheng, X. Zhu, and J. Li, 2010. Laser Altimetry Data of Chang’E-1 and the global Lunar DEM Model. Science China Earth Science, vol. 40, no. 3, pp. 281-293.
Mellberg,W. F., 1997. Moon Missions - Mankind’s first voyages to another world. Plymouth, MI: Plymouth Press.
NASA (National Aeronautics and Space Administration), 2009. Lunar Reconnaissance Orbiter. http://lunar.gsfc.nasa.gov/ (2009).
Ouyang, Z. Y., J. Jiang, C. Li, H. Sun, Y. Zou, J. Liu, J. Liu, B. Zhao, X. Ren, J. Yang, W. Zhang, J. Wang, L. Mou, J. Chang, L. Zhang, H. Wang, Y. Li, X. Zhang, Y. Zheng, S. Wang, W. Bian, 2008. Preliminary Scientific Results of Chang’E-1 Lunar Orbiter: Based on Payloads Detection Data in the First Phase. Chinese Journal of Space Science, vol. 28, no. 5, pp. 9-17.
Park, S.Y.and Subbarao, M., 2003. A fast point-to-tangent plane technique for multi-view registration. IEEE International Conference on 3D Digital Imageing and Modeling, Banff, pp. 276-283.
Ping, J. S., Q. Huang, J. G. Yan, J. F. Cao, G. S. Tang, and R. Shu, 2009. Lunar topographic model CLTM-s01 from Chang’E-1 laser altimeter. Science in China Series G: Physics, Mechanics & Astronomy, vol. 52, no. 7, pp. 1105-1114. Rosiek,M., R. Kirk, and E. Howington-Kraus, 1999. Lunar Topographic Maps Derived from Clementine Imagery. Lunar Planet. Sci. XXX, Abstract #1853, LPI, Houston, TX.
Smith, D. E., M. T. Zuber, G. A. Neumann, and F. G. Lemoine, 1997. Topography of the Moon from the Clementine LiDAR. JGR - Planets, vol. 102-E1, pp. 1591-1611.
Williams, J.A., Bennamoun, M., Latham, S., 1999. Multiple view 3D registration; a review and a new technique, IEEE SMC’ 99 Conference Proceedings, Tokyo, Japan.
Wu, B., Guo, J. Zhang, Y.S., King, B., Li, Z.L., and Chen,Y.Q., 2011. Integration of Chang’E-1 Imagery and Laser Altimeter Data for Precision Lunar Topographic Modelling. IEEE Transactions on Geoscience and Remote Sensing, Vol. 49, No.12, pp.4889-4903.
Zheng, Y., Z. Ouyang, C. Li, J. Liu, and Y. Zou, 2008. China’s Lunar Exploration Program: Present and future. Planetary and Space Science, vol. 56, pp. 881–886.