HYDROLOGIC AND CRYOSPHERIC PROCESSES OBSERVED FROM SPACE
M.Menenti a,f,*, X. LI b, J. WANG b, H. Vereecken c, Jiren LI d, M. Mancini e, Q.LIU f, L.JIA f, Jing LI g, C.Kuenzer h, S. HUANG d
,H.Yesou i, J.WEN b, Y. Kerr l, X. CHENG m, N. Gourmelen n, C. KE o, R.Ludwig p, H. LIN q, M. Eineder r, Y. MA s and Z. B. SU t a
Faculty of Civil Engineering and Earth Sciences (CITG), Delft University of Technology (TUD), Post Box 5048, 2628 CN Delft, The Netherlands, E-Mail: [email protected]
b
Cold and Arid Region Environment Research Engineering (CAREERI), Chinese Academy of Sciences (CAS), 320 Donggang West Road, 730000 Lanzhou, P.R. China. E-Mail: [email protected]
c Julich Research Centre, Germany. E-Mail: [email protected] d
China Institute of Water Resources and Hydropower Research, China. E-Mail: [email protected] ; e
Politecnico di Milano, Italy. E-Mail: [email protected] f
State Key Laboratory of Remote Sensing Science, Institute of Remote Sensing and Digital Earth (RADI), Chinese Academy of Science (CAS), Beijing 100101 P.R. China, Email: [email protected] , [email protected]
g
College of Disaster Reduction and Emergency Management. Beijing Normal University, China. Email: [email protected] h
German Remote Data Sensing Centre (DFD), German Aerospace Centere (DLR), Germany. Email: [email protected] i
SERTIT, University of Strasbourg, 300 bd Sébastien Brant, CS 10413, F-67412 Illkirch Cedex, France, E-Mail: [email protected]
l Center for the Study of the Biosphere from Space (CESBIO), France. E-Mail: [email protected] m
Beijing Normal University, China. E-Mail: [email protected] n
School of GeoSciences, University of Edinburgh, Drummond Street, Edinburgh EH8 9XP UK. E-Mail: [email protected] o
School of Geographic & Oceanographic Sciences, Nanjing University, China. E-Mail: [email protected] p
Department of Geography, Ludwig-Maximilian-University Munich, Germany. E-Mail: [email protected] q
Institute of Space and Earth Information Science, Chinese University of Hong Kong, China. E-Mail: [email protected] r
Remote Sensing Technology Institute (IMF), German Aerospace Center (DLR), Germany. E-Mail: [email protected] s
Institute of Tibetan Plateau Research, Chinese Academy of Sciences, China. E-Mail: [email protected] t
University of Twente, ITC, Netherlands. E-Mail: [email protected]
THEME: WACY - Water Cycle. PROG: Special Dragon session "National, regional and international programmes including education and outreach"
KEY WORDS: Terrestrial Water Cycle; Multi Sensor Data Products; Glaciers; Water Resources; High Elevation Climate
ABSTRACT:
Ten Dragon 3 projects deal with hydrologic and cryosphere processes, with a focus on the Himalayas and Qinghai – Tibet Plateau, but not limited to that. At the 1st Dragon 3 Progress Symposium in 2013 a significant potential for a better and deeper integration appeared very clearly and we worked out an overview of the ten projects identifying specific issues and objectives shared by at least two projects. At the Mid Term Symposium in 2014 a joint session was held over two days. As regards cryospheric processes science highlights covered: Glacier flow velocity by optical and SAR features tracking and InSAR; Patterns in space and time of glacier flow velocity; Mass change estimated with DTM-s and altimetry; Reflectance and LST used to classify glacier surface and understand surface processes, Inventory and changes in the number and area of lakes in the Qinghai – Tibet Plateau 1970, 1990, 2000 and 2010; Deformation of permafrost along the Qinghai – Tibet railway.
Highlights on hydrologic processes included: Global comparison of SMOS, ASCAT and ERA soil moisture data products; Relative deviations evaluated by climate zone; Soil moisture data products improved with ancillary data; Assimilation of FY - , TRMM and GPM precipitation data products in WRF; Improved algorithm and data products on fractional snow cover; Improvement of MODIS ET with assimilation of LST; TRMM data products evaluated in the Yangtze; Calibration of river basin models using LST; System to calibrate, correct and normalize (spatial, spectral) data collected by imaging spectral radiometers; Integration of data acquired by different sensors, e.g. ET Monitor with optical and microwave (SMOS, FY – 3) data; Hydrological data products used both for forcing and evaluation of Qinghai – Tibet Plateau hydrological model; Wetlands vulnerability assessed through changes in land cover 1987 – 2013; Multi incidence angle and multi – temporal SAR to monitor water extent. In the general session a proposal for a Dragon Water Cycle Initiative was presented.
1. INTRODUCTION
1.1 General
The headwater areas of seven major rivers in SE Asia, i.e. Yellow River, Yangtze, Mekong, Salween, Irrawaddy, Brahmaputra and Ganges, are located in the Tibetan Plateau. Estimates of the Plateau water balance rely on sparse and scarce observations that cannot provide the required accuracy, spatial density and temporal frequency. Fully integrated use of satellite
and ground observations is necessary to support water resources management in SE Asia and to clarify the roles of the interactions between the land surface and the atmosphere over the Tibetan Plateau in the Asian monsoon system.
Ten Dragon 3 projects (see Table 1) deal with hydrologic and cryosphere processes, with a focus on the Himalayas and Qinghai – Tibet Plateau, but not limited to that.
ID Title Lead Investigators
ID 10649 Water Cycle & River Basins Prof. LI Xin
Prof. Harry Vereecken
ID 10664 Yangtze River Basin Hydrology Prof. LI Jiren
Prof. Marco Mancini
ID 10680 Hydrology Products Prof. LIU Qinhuo
Prof. Massimo Menenti
ID 10697 Dongting Lake Flood Dynamics Prof. LI Jing
Dr. Claudia Kuenzer
ID 10557 Wetlands Monitoring Prof. HUANG Shifeng
Dr. Yesou Herve
ID 10611 SMOS CalVal and Soil Moisture Prof. WEN Jun
Dr. Yann Kerr
ID 10302 Himalayan Glacier Dynamics Prof. CHENG Xiao
Dr. Noel Gourmelen
ID 10612 Glaciers & Hydrological Dynamics Prof. KE Changqing
Prof. Ralf Ludwig
ID 10674 Cryosphere Dynamics - Tibetan Plateau Prof. LIN Hui
Dr. Michael Eineder
ID 10603 CEOP-TPE Prof. MA Yaoming
Prof. Z. Bob Su
Table 1. Overview of Dragon 3 Projects addressing cryosphere and hydrosphere processes.
As regards cryosphere processes, science highlights covered: Glacier flow velocity by optical and SAR features tracking and InSAR; Patterns in space and time of glacier flow velocity; Mass change estimated with DTM-s and altimetry; Reflectance and LST used to classify glacier surface and understand surface processes, Inventory and changes in the number and area of lakes in the Qinghai – Tibet Plateau 1970, 1990, 2000 and 2010; Deformation of permafrost along the Qinghai – Tibet railway.
Highlights on hydrologic processes included: Global comparison of SMOS, ASCAT and ERA soil moisture data products; Relative deviations evaluated by climate zone; Soil moisture data products improved with ancillary data; Assimilation of FY - , TRMM and GPM precipitation data products in WRF; Improved algorithm and data products on fractional snow cover; Improvement of MODIS ET with assimilation of LST; TRMM data products evaluated in the Yangtze; Calibration of river basin models using LST; System to calibrate, correct and normalize (spatial, spectral) data collected by imaging spectral radiometers; Integration of data acquired by different sensors, e.g. ET Monitor with optical and microwave (SMOS, FY – 3) data; Hydrological data products used both for forcing and evaluation of Qinghai – Tibet Plateau hydrological model; Wetlands vulnerability assessed through changes in land cover 1987 – 2013; Multi incidence angle and multi – temporal SAR to monitor water extent
1.2 Understanding the Regional Terrestrial Water Cycle
The headwater areas of seven major rivers in SE Asia, i.e. Yellow River, Yangtze, Mekong, Salween, Irrawaddy, Brahmaputra and Ganges, are located in the Tibetan Plateau. Estimates of the Plateau water balance rely on sparse and scarce observations that cannot provide the required accuracy, spatial density and temporal frequency. Fully integrated use of satellite and ground observations is necessary to support water resources management in SE Asia and to clarify the roles of the interactions between the land surface and the atmosphere over the Tibetan Plateau in the Asian monsoon system.
A series of international efforts initiated in 1996 with the GAME-Tibet project. The CEOP – AEGIS project (Menenti et al., 2014) was built upon 10 years of experimental and modelling research with the active support of many key-players and pioneers of this long term research initiative. These studies identified the elements of a comprehensive system to observe timely the state of land surface over the Plateau, extract precursor information to improve forecast precipitation over the headwater areas of the Yellow River, Yangtze, Mekong, Salween, Irrawaddy, Brahmaputra and Ganga, monitor the water balance of the Plateau and its water yield, and improve timely detection of floods and droughts, towards an infrastructure for the Group on Earth Observations (GEO) water theme and capacity building in S and E Asia.
The Dragon 3 Cryosphere and Hydrosphere Projects, although generally limited to China, cover and expand this area of research on the terrestrial water cycle.
To study terrestrial water cycle, particularly at the river basin scale requires high quality remote sensing products (RSPs) of land surface variables. New or significantly improved algorithms have been developed and evaluated against ground measurements. Variables retrieved include land surface properties, rain rate, aerosol optical depth, water vapour, snow cover and water equivalent, soil moisture and lake level. Several Dragon Investigators have focused on the observation for space of static and dynamic properties of glaciers. Common to all algorithms developed is the capability to make use of heterogeneous raw data. This paper presents an overview of the progress within the Dragon 3 framework in the development and validation of RSPs toward several key water budget components, including precipitation, snow cover area (SCA), soil moisture (SM), evapotranspiration (ET) and changes in groundwater stock.
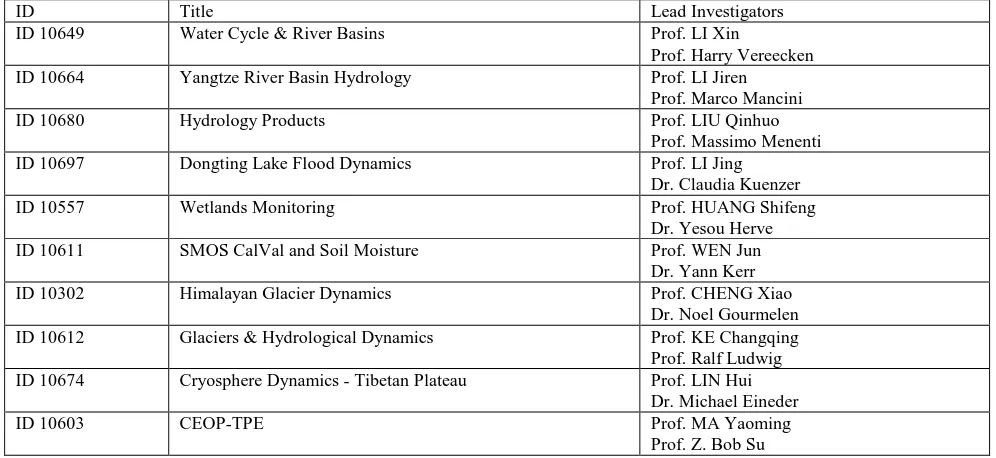
Figure 1. The Qinghai – Tibet Plateau and the main river Basins of South and East Asia (adapted from Menenti et al. 2014).
2. OVERVIEW OF PROJECTS
2.1 Water Cycle & River Basins
The overall objective of the Water Cycle and River Basins project is to close the water cycle at the river basin scale. Water budget components including precipitation, evapotranspiration (ET), soil moisture (SM), snow water equivalent (SWE), runoff, and groundwater storage will be estimated using multisource remote sensing observations and corresponding time series products of these variables will be generated. These products, in combination with hydrology and land surface modelling will be integrated by data assimilation methods to precisely close the land water budget at the river basin scale.
The detailed implementation of the project includes the identification of the 6 key experimental areas (KEAs) in the Heihe River Basin, China and the Ruhr Catchment, Germany. Within the KEAs, intensive and long-term observations will be implemented. In particular, it is expected that the estimation approaches for the key hydrological variables will be improved, the basin scale remote sensing and assimilated data products will be achieved (from 2012-2015), and the prediction of water resources will be improved by using the achieved high-resolution, spatiotemporally consistent key hydrological products.
2.2 Yangtze River Basin Hydrology
The main objective of the Yangtze River Basin Hydrology project is to assess water quantity and quality under natural and human pressure on the Yangtze River basin, by using two distributed hydrological models (FEST-EWB & XAJ) coupled with satellite and ground data.
The detailed sub-objectives were designed to reach the main goal, which leads to the deliverables including GIS database of satellite and ground data, flow duration curves of different river cross-sections for hydropower and agricultural potential use,
evapotranspiration product, soil moisture product used for flood forecast and irrigation time management, flooded area map, soil erosion map, and maps of suspended solid sediments, chlorophyll and turbidity and surface water temperature.
2.3 Hydrology Products
The overall objective of the Hydrology Products project is to generate hydrological data products by merging broadly similar radiometric data collected by satellite systems operated by ESA and the China National Space Administration, with generic algorithms. To support monitoring of the terrestrial water cycle, a suite of land surface biophysical variables will be generated using largely automated procedures with multi-source remotely sensed data. Those variables include LST, LAI, FVC, FAPR, Albedo, ET, SM, Snow Cover, SWE and so on.
To facilitate this aim, a software system is being developed, named Multi-Source Remote Sensing Production System (MSRSPS), to realize the functions for batch production of land surface variables. The MSRSPS is composed of three sub-systems including multi-source remote sensing data pre-processing sub-system (M-RSPPS), land surface variables batch production sub-system (LSV-BPS), and data and task management sub-system (D&T-MSS).
2.4 Dongting Lake Flood Dynamics
The aim of this project is to depict the potential of remote sensing for the support of spatial planning for the wetland of Dongting Lake, to assess its dynamics, including flood pulse dynamics, wetland development, the quantification of wetland degradation and the derivation of landuse changes in the direct surroundings of the lake.
Based on Envisat ASAR data at different resolution (mapping of inundation extent and frequency), the project is going to derive inundation time series for the three consecutive years of the DRAGON 3 project, as well as for past years based on different modes of different special and temporal resolution. In The International Archives of the Photogrammetry, Remote Sensing and Spatial Information Sciences, Volume XL-7/W3, 2015
addition, MERIS data and optical data of multi-spectral data of the Environmental Monitoring Constellation and Beijing-1 and 2 data were used to investigate wetland composition and biodiversity wetland degradation, land use dynamics in the direct lakes surrounding, mapping and change detection of agricultural crops etc. To do the above investigation, the automated, transferable algorithms and tools are being developed jointly among partners.
2.5 Wetlands Monitoring
The goals of this project are: 1) large and small water bodies monitoring, in terms of water extent height, quality, 2) wetland ecosystem understanding, 3) epidemiology and 4) regional interaction and global context. The project is being carried out by a broad Team integrating new members from Europe and China , in terms of geography. It is focused on the middle and lower Yangtze reaches, as, few hundred millions of inhabitants downstream of 3 gorges dam, depend directly on the services that wetlands provide: regulating services such as flood storage; provisioning services such as fishing. From the largest Poyang and Dongting, it will extent to smaller lakes, downstream in Anhui province but also upstream as Napahai in the 3 valleys region and Rouergai in Qinghai – Tibet Plateau.
On a continuity path after DRAGON 1 and 2, the monitoring of Poyang Lake was maintained on a relative high frequency thanks to the access of a large set of HJ1 completed by CSK and TerraSAR SAR images. An analysis of the water surface of Poyang Lake, 2000-2011 was done, highlighting the periods with excess or deficit of water. A major fact is the apparent increase of drought event, both in summer following the rain period, and during dry season.
2.6 SMOS Cal-Val and Soil Moisture
To quantify and remediate the uncertainties in SMOS and SAR-based soil moisture products, regional soil moisture monitoring networks have been established around the world. The project will focus on two of these initiatives, which focus on the Tibetan Plateau and Taklamakhan. Su et al. (2011) describe a Plateau-scale soil moisture/temperature observatory consisting of three regional soil moisture calibration/validation sites. Each site holds a network of at least 20 stations and data records starting from 2006, 2008 and 2010 for the three sites, respectively. Similarly, a comprehensive soil moisture/temperature network has been installed in the Taklamakhan desert, where the ground instrument for measuring L-band brightness temperatures is installed as well. This project makes use of these in-situ data sets to validate the SMOS and the experimental SAR soil moisture products from ASAR, Sentinel-1 and PALSAR-2. The specific target is to reduce soil moisture retrieval uncertainties related to surface roughness and vegetation effects. The discrete scatter modeling suite developed at the Tor Vergata University in Rome (Bracaglia et al. 1995) will be utilized as a theoretical reference and for the advanced interpretation of the observations.
2.7 Himalayan Glacier Dynamics
Melting of the Himalayan Glaciers has direct consequences for the sea level worldwide, and also has direct consequences for regional hydrology, which directly affects the water supply providing to over 1.4 billion people and the risk of flooding events. To understand and quantify the changes affecting the Himalayan Glaciers, the project aims to quantify the degree of mass imbalance of the Himalayan Glaciers by exploiting Earth
Observation dataset, which can help understand the mechanisms by which mass is being lost and how the Himalayan Glaciers responds to the forcing of heat transport by the atmosphere. The project is going to deliver glacier elevation change, flow divergence, and improve the determination of mass imbalance at the scale of the Himalayan range.
The specific objective of this project is to quantify secular and seasonal changes in the mass and stability of the Himalayan glaciers by: 1) Observation of glacier area changes and debris-cover evolution; 2) Quantifying glacier elevation and elevation changes; 3) Quantifying secular and seasonal variations in the flow, and flow divergence, of the glaciers of the HTTSK region as well as their uncertainties and 4) Assimilation of Earth Observation (i.e. Dh/Dt and Dv/Dt) with field observations for estimates of glacier mass balance.
2.8 Glaciers & Hydrological Dynamics
The goal of this project is to use Earth Observation to support the needs for the monitoring, mapping, and water resource potential evaluating of glacier change in the Yigong Zangbo and Parlung Zangbo catchments. Some key glacier variables will be retrieved using ESA and other satellite data. Finally the applicability of quantitative remote sensing in cryosphere applications and glacier water resource potential evaluation will be promoted.
The scope of this project is to illustrate the capabilities of multi-source remote sensing data for an assessment of glacier change and its hydrological effects in the Yigong Zangbo & Parlung Zangbo Catchments. The project will investigate the use of multi-temporal and synergistic use of EO data to accurately identify and monitor dynamics of glaciers and how they are changing over time.
The specific goals include: 1) the use of synergistic data sets from optical and microwave images to detect glacier length, area and boundaries change by means of neural network and machine learning methods; 2) InSAR measurement of glacier ice-velocity fields; 3) the use of synergistic data sets from RS and GIS (DEM) to evaluate glacier volume, elevation, mass balance change and to assess water resource potential; 4) the examination of glacier change, its hydrological effects and climatic change background, based on the data base developed in this project.
2.9 Cryosphere Dynamics – Tibetan Plateau
The objective of this project will be concentrated on the Cryosphere dynamics in the Tibetan Plateau by the synergistic use of microwave and optical earth observations as well as ground measurements. According to the data analysis and numerical simulation, the interaction between glacier, permafrost and plateau lake dynamics will be exploited through methodology development and Virtual Geographic Environment (VGE) system integration. The relationship of the plateau environmental condition and global climate change will be further studied in supporting the regional sustainable development, e.g. water balance estimation and engineering structures safety operation.
2.10CEOP-TPE
plateau cryosphere (glaciers, snow and permafrost) and the plateau atmosphere at various temporal and spatial scales, but a fundamental understanding of the details of the coupling is lacking.
The objectives of the project is to improve the understanding of the interaction between the Asian monsoon, glaciers/permafrost and the Tibetan plateau atmosphere in terms of water and energy budgets in order to assess and understand the causes of changes in cryosphere and hydrosphere in relation to changes of plateau atmosphere in the Asian monsoon system and to predict the possible changes in water resources in the Third Pole Environment. A core innovation of the project is to verify or falsify recent hypotheses and projections of the changes of glaciers and permafrost in relation to surface and tropospheric heating on the Tibetan plateau as precursors of monsoon pattern changes and glaciers retreat, and their impacts on water resources in South East Asian. To achieve this aim, both earth observation data and in-situ measurements will be used to advance process understanding relevant to monsoon scale, and develop coupled regional scale hydro-climatic models to explain different physical links and scenarios that cannot be observed directly.
Figure 2. Impact of terrain characteristics on the accuracy of fractional snow-cover identification for all the MOD10A1 and FCLS snow products.
3. HIGHLIGHTS OF RESULTS
3.1 Water Cycle & River Basins
In terms of snow products, several commonly used methods on mapping fractional SCA, such as linear spectral mixture analysis, statistical regression relationship and machine learning approach were assessed. On this basis, a sub-pixel snow mapping algorithm combined with a prior spectral library and cloud-removal approach has been developed by using MODIS data. Daily fractional SCA data were therefore produced in the Heihe River Basin (HRB) from January 2010 to December 2012. Besides, a multilayer feed-forward artificial neural network (ANN) was developed for mountainous fractional SCA mapping (Fig.2). Landsat ETM+ and MODIS images acquired in three periods were chosen to evaluate the proposed method at the HRB. Results demonstrated that the ANN can easily incorporate auxiliary information to improve the accuracy of SCA mapping effectively.
As for the basin scale SM product, change detection method was used to estimate SM and its freeze/thaw status based on ENVISAT/ASAR global mode data with 1 km resolution in the
upper reaches of the HRB. Comparison analysis and validation during the period from 2008 to 2011 were performed by using SM observations at the A’rou freeze/thaw observation station at 10 cm. Results indicated that the root mean square error (RMSE) of the estimated volumetric SM was 0.11 cm3/cm3. Indirect validation in the spatial domain gave theoretical maximum RMSE ranging from 0.03 cm3/cm3 to 0.12 cm3/cm3, with 91.77% of grids were below 0.06 cm3/cm3 and better results were obtained over flat terrain.
3.2 Yangtze River Basin Hydrology
A georeferenced data base for the entire basin has been implemented for meteorological data, satellite images and ground data. Satellite images have been selected and analysed: AATSR and MODIS for land surface temperature (LST) estimate, MERIS for snow cover area computation and land use definition, ASTER data for the Digital elevation model. The hydrological model FEST-EWB parameters have been calibrated for the upper Yangtze River basin, based on the comparison of simulated and observed satellite land surface temperature and river discharge. Flow duration curves at main river cross sections, pixel wise evapotranspiration and water availability maps have been estimates (Corbari et al. (2013)). XAJ model parameters have been calibrated against observed discharge in a typical basin within the research area. Low relative errors on volume and high Nash–Sutcliffe index value of daily discharge have been found, confirming XAJ model goodness.
3.3 Hydrology Products
The three year time series (2008 – 2010) of gap-free daily and hourly land surface temperature was reconstructed using two time series analysis algorithms: HANTS and MSSA. The latter performed better to reconstruct long gaps, while the former with short gaps. The entire cloud – free, hourly, 2008 – 2010 time series was then analyzed using HANTS to determine the amplitudes of dominant periodic components. The same procedure was applied to a concurrent time series of soil heat flux. The results were applied to map the spectral soil thermal admittance and to estimate soil thermal properties of different layers by inverse modelling.
The hybrid remotely sensed ET estimation model named ETMonitor (Hu and Jia, 2015) was applied to estimate the daily actual ET globally and evaluated against eddy covariance measurements at sites in China (Fig.3) and Europe. The model is forced by a variety of biophysical parameters derived from microwave and optical remote sensing observations.
We have developed a method to correct sub-pixel topography induced effects on surface reflectance retrieved from kilometric pixel size geostationary satellite radiometric data using a fine The International Archives of the Photogrammetry, Remote Sensing and Spatial Information Sciences, Volume XL-7/W3, 2015
Figure 3. Monthly ET at 1 km x km spatial resolution; China, July 2010 (Hu and Jia, 2015)
resolution DEM and integrating the sub-pixel adjacency effect. A time series of daily instantaneous, i.e. at the time of MODIS data acquisition, solar radiative fluxes at the surface from 2008 to 2010 was produced and evaluated against measurements collected at four ground stations on the Qinghai – Tibet Plateau.
We have used different remote sensing data products to characterize the response of Tibetan glaciers to climate forcing (Fig.4). The ice surface displacements of eight glaciers in the Nyainqˆentanglha Range were monitored over nearly two decades from 1993 to 2009 by applying the feature-tracking method (COSI-Corr) to a time series of Landsat image data. The accuracy of the estimated ice displacement was evaluated by using measurements of stable ground outside the glaciers. The glacier surface displacements observed in this way were used to study glacier response to climate forcing, characterized with the MODIS land surface temperature product (MOD11C3) and TRMM precipitation data products. Observed displacements measured were larger in the summer season than the winter season. This implies that the glacier surface displacements in the summer season seems to be more associated with the higher temperature and the day – night regional thermal cycle
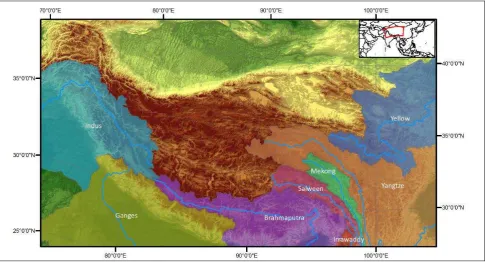
Figure 4. Dependency of the Tibetan lakes on direct glacial runoff determined by integrating the SRTM and glaciers inventory (Phan Hien et al., 2013)
3.4 Dongting Lake Flood Dynamics
As a first step the derivation of the extent of surface water inundation is considered a prerequisite for further analyses of lake dynamics and wetland habitat dynamics. In Dongting Lake area the existence and development of the wetlands heavily depend on the fast changing water coverage. The derivation of surface water can be conducted using radar or optical remote sensing data. Depending on the time span the data is available analyses can go back to the 1970s (with Landsat) or back to 1990s (with ERS). For radar based derivation we use an automated approach that is a combination of thresholds and morphological operations to mask the area of low backscatter indicating water. In-depth analysis of ASAR time series data for the past decade regarding inundation length and frequency are ongoing.
Further remote sensing based analyses will comprise the derivation of land cover changes in wetlands as well as land use
changes in agricultural areas utilizing optical remote sensing data from different sensors.
3.5 Wetlands Monitoring
Crane counts in the basin showing increases from the 1980’s through the late 1990’s and declines since 2000.
Figure 5. Poyang Lake water surface variations between 2000 and 2011 (top); Shengjin Lake (Anhui Pr) viewed by HJ-1 on the 3rd of May 2010 (42km) (bottom)
3.6 SMOS CalVal and Soil Moisture
A database with the available ASAR WS scenes and SMOS observations has been assembled with matching in-situ soil moisture/temperature measurements. The in-situ measurements have been quality-checked and processed towards volumetric soil moisture, m3 m-3, using laboratory determined site specific calibration coefficients.
All (+500) ASAR Wide Swath mode data sets have been reprocessed and for the Tibetan Ngari prefecture soil moisture estimation has been performed using the algorithms of the Italian Institute for Applied Physics (IFAC-CNR) and ITC-UT algorithms. Initial analysis yielded promising results. The comparison with in-situ measurements generated for both algorithms correlations on the order of 0.65 and 0.80 for the VV and HH polarization, respectively. The ITC-UT algorithm produced, however, a significant bias, which will be further investigated.
Figure 6. Soil moisture maps derived from ASAR WS images (Van der Velde et al. 2012)
3.7 Himalayan Glacier Dynamics
Partial monitoring of the Pamir-Karakoram-Himalaya glaciers from satellite observations has revealed a mixed picture; while many of the glaciers are retreating, in some cases locally stable or advancing glaciers in this region have also been observed (Kaab et al, 2012;Gardelle et al, 2013). Nevertheless, the Earth Observation technologies that allow studying mass balance of these glaciers, with a size generally less than 10km, only exist since the 2000's, whereas the climate variability requires to work over several decades. But it is possible, thanks to satellite imagery; in particular the Landsat serie that acquired repeated images of the Earth since the 70's; to quantify the evolution of the dynamic of Asian glaciers over the last decades.
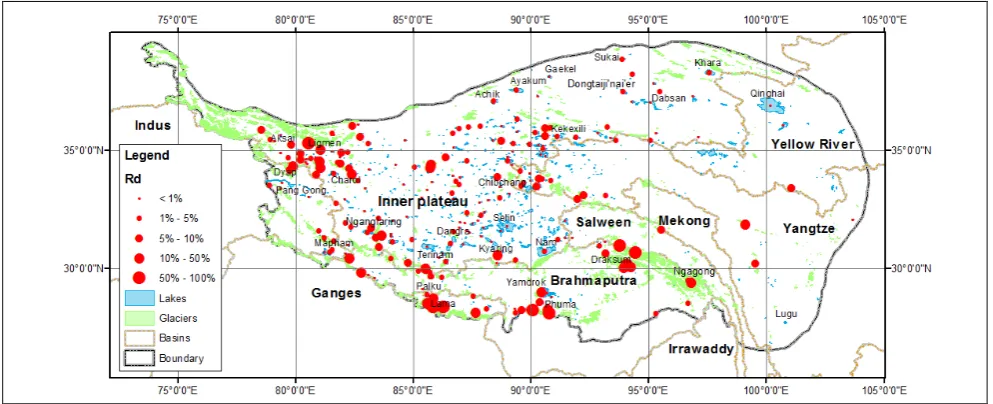
Figure 7. Surface flow velocity of glaciers in the Pamir-Karakoram – Himalaya region: a) Hindu-Kush, b) Pamir-Karakoram, c) Jammu-Kashmir, d) Everest, e) Bhutan; (Dehecq et al., 2015)
We developed and applied a method to derive glaciers velocity fields from feature-tracking techniques of Landsat images over the entire mountain range. By taking benefit of the repetitivity in the Landsat serie, we show that it is possible to derive annual velocity fields for more than 90% of the glaciers areas, with an uncertainty of 2-3m/year for the missions Landsat 5-7 (1982-2012). The lower quality and resolution of the older missions (1972-1993) restrict the sensitivity to the largest and fastest glaciers, but is sufficient enough to analyse the evolution of glaciers dynamic over decadal scales. This evolution will be analysed in lights of the glaciers mass balance over the last decade.
3.8 Glaciers & Hydrological Dynamics
The Second Glacier Inventory Dataset of China (Version 1.0) has been shared on the websites (http://westdc.westgis.ac.cn , http://nsidc.org , http://www.wgms.ch) since 2014. The main The International Archives of the Photogrammetry, Remote Sensing and Spatial Information Sciences, Volume XL-7/W3, 2015
remote sensing data source of the second Chinese glacier inventory is Landsat TM/ETM+ images for delineating glacier borders.
The newest digital elevation model SRTM V4 is the data source for extracting glacier attributes. However, in the South – Eastern Tibetan Plateau, including Hengduan Mountain and the eastern Nyainqentanglha Mountain normally covered by snow and cloud, the optical remote sensing images are difficult to acquire because of snow and cloud weather influenced by the South Asian Monsoon, and cannot meet the requirements for the second Chinese glacier inventory. Meanwhile, 6201 glaciers’ information is from the first Chinese glacier inventory, which recorded glaciers during 1960s-1980s, therefore, the second inventory for these glaciers cannot not show us their present situations because of the global warming.
It is necessary to update the second inventory for these glaciers with SAR images. In this study, we use ENVISAT ASAR images from June to August in 2010 to update the second glacier inventory in the Parlong Zangbu Basin, where 2146 glaciers are from the first Chinese glacier inventory. According to penetration and backscatter features, as well as in the support of DEM, we recognize the glaciers using the decision tree method. The results (Fig.8) show that 187 glaciers retreated, 27 glaciers advanced, and others no change. Glacier area decreased 293 km2, and glacier retreat was dominant.
Figure 8. Changes in glacial area (km2), volume (km3) and water equivalent (108m3)
3.9 Cryosphere Dynamics - Tibetan Plateau
The primary methodologies being developed are: (1) a synergistic analysis and interpretation of multi-source SAR data, optical satellite imagery and ground-based glaciological data for glacier facies, glacier DEM extraction and surface velocity estimation; (2) new fusion algorithms for lake identification and change detection using temporal, multi-source satellite remote sensing imagery and satellite radar or lidar altimetry data; (3) permafrost geo-parameter extraction and surface deformation monitoring jointly using ground-based measurements, SAR interferometry as well as numerical estimation models; (4) an integrated VGE platform for multi-dimensional visualization, geospatial analysis, dynamical modelling and decision-marking for geological and environmental process.
Two adjacent lakes, Bam Co and Nam Co, increased by 32.74% to 250.728 km2 and 3.57% to 2016.98 km2 in 1990s and 2000s, respectively. The latter also presented 2m water level increasing detected by both Envisat/RA2 and Icesat altimeter.
By deriving water loading caused ground subsidence using StaMPS/MTI with ERS&Envisat SAR data, we estimated a 2mm/year rate around Bam Co, while no significant subsidence found for the area adjacent Nam Co. By considering that no glacier flows into the Bam Co basin, we attribute its dynamic mostly to permafrost degradation preliminarily. For the Puruogangri ice field, we measured the ice flow velocity (Fig. 9) and the glacier surface elevation by using SAR interferometry applied to ERS- 1/2 SAR Tandem images acquired in September 1998. A maximum surface velocity of 0.12 m/day (around 43.8 m/year) was observed in glacier tongues of the eastern portion of the Puruogangri, with a mean velocity of 0.07 m/day. However, the glaciers of the western centre portion experienced relatively stable patterns, which are consistent to the GPS observations obtained in 2002 (Pu, 2002) and our field work in 2012 (Fig. 9).
Figure 9. Glacier surface velocity and Field work (up right) in Puruogangri ice field
3.10CEOP-TPE
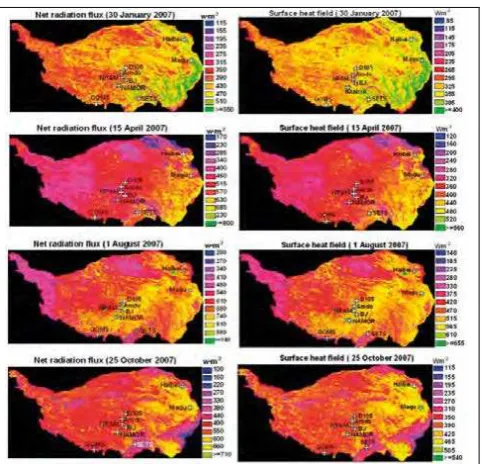
A parameterization scheme based on Moderate Resolution Imaging Spectroradiometer (MODIS) data and in-situ data was tested for deriving the regional surface heating field over a heterogeneous landscape (Fig.10). As a case study, the methodology was applied to the whole Tibetan Plateau (TP) area. Four images of MODIS data were used in this study for comparison among winter, spring, summer, and autumn. The results were validated using the observations measured at the stations of the Tibetan Observation and Research Platform (TORP). Therefore, reasonable regional distribution of the surface heating field over a heterogeneous landscape can be obtained using this methodology.
Simultaneously, a parameterization methodology based on NOAA/AVHRR data and field observations is described and tested for deriving the regional surface reflectance, surface temperature, net radiation flux and soil heat flux over a heterogeneous landscape. As a case study, the methodology was applied to the Tibetan Plateau area. Two scenes of NOAA/AVHRR data were used in this study. The derived results were also validated using the ‘ground truth’. The results show that reasonable regional distribution of surface variables (surface reflectance and surface temperature), net radiation flux and soil heat flux over the heterogeneous landscape of the Tibetan Plateau can be obtained by using this methodology.
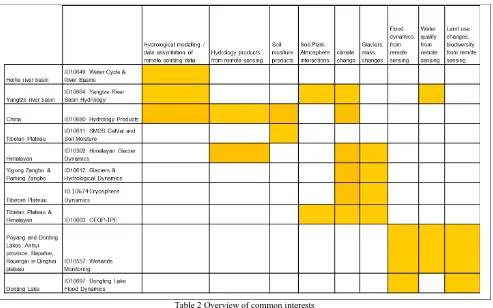
Table 2 Overview of common interests
4. COMMON INTERESTS AND PERSPECTIVES
4.1 Common Interests
A first common and specific objective of most projects is to develop and apply multisource data products to bring to fruition the opportunity of nearly unlimited access to satellite data sources in Europe, China, USA and Japan. This is a clear strength of a potential Dragon Water Cycle Initiative.
A concise overview of specific scientific and technical commen interests is provided in Table 2. Most hydro – meteorology projects focus on generating multiple data products on hydrological variables (e.g. ID10680, 10664, 10603 & 10649) and their application to observe and understand the water and energy cycle over land, particularly by calibrating and validating hydrological models. In addition to hydrological aspects, the Yangtze River project also addresses water quality issues, i.e. by generating maps of soil erosion and water quality
indicators. The SMOS Cal/Val projects aims specifically at improving the accuracy of soil moisture data products by using in-situ measurements and a suite of satellite data, SMOS and SMAP in particular.
The CEOP-TPE project aims also at generating data products on hydrological variables, but within the broader context of the regional climate variability and its impacts on cryosphere and hydrosphere in the Asian Monsoon System. The geographical domain of this project is the Qinghai – Tibet Plateau and the river basins fed by Plateau water.
The Dongting Lake project is more focused on wetland dynamics, flood dynamics, land use dynamics and assessment of the wetland ecosystem, with multisource satellite data. The Wetlands Monitoring project aims to investigate Poyang and Donting Lake dynamic, water quality and erosion and related impacts on biodiversity.
The cryosphere projects (e.g. ID10302, 10612 & 10674) are aiming at detecting and measuring glacier dynamics. The Himalayan Glacier project has already provided observations of surface flow velocity and will deliver glacier elevation change by using CryoSAT-2 data, flow divergence by using InSAR, SAR and ASAR data, and the boundary and debris-cover glacier extent by using multi-source data (e.g. both RS and DEM). The Glaciers & hydrological dynamics project intends on the one hand to address the same processes, but with a clear focus on the Yigong Zangbo & Palung Zangbo catchments. In addition, the project has provided a vital contribution by updating the 1st Inventory of glaciers in China. The Cryosphere Dynamics project shares the goal of observing and understanding glacier dynamics, but adds the unique dimension of exploring the linkage with lake dynamics and terrain deformations.
4.2 Common Perspectives
The information summarized in the previous pages points clearly towards a future Dragon Terrestrial Water Cycle Initiative aiming at reinforcing inter-project cooperation, relevant to water cycle, under the Dragon Program umbrella.
Such an initiative should address the following themes:
Hydrological modelling / data assimilation of remote sensing data;
Hydrology products from remote sensing
Glaciers and lakes mass change in response to climate and human pressure
Water quantity vs quality from remote sensing Monitoring of hydrological conditions (floods and
droughts) in response to climate and human pressure
Impact of hydrological conditions on land cover, land use and biodiversity
Vulnerability and adaptation of water resources systems
Such an initiative would pave the way to address the following recommendations:
Integrated projects with a wider scope could be more effective towards future China – EU collaboration in EO science and applications; Glaciers and lakes changes must be quantified more
precisely and we need to attribute such changes to specific climate forcing; changes in precipitation vs. changes in evapotranspiration;
Need to understand and quantify such processes and changes in pilot catchments;
Necessary connection of regional and global analyses of water resources;
Cryosphere and Hydrology questions should be linked towards better science;
Larger data volumes are needed: larger quotas for multi – temporal studies on large areas;
Integration of multiple sensors to improve revisit frequency and improve accuracy and information content should be promoted; China – EU virtual constellations for specific applications;
Land surface temperature measurements needed at 50 m – 100 m spatial resolution for cryosphere and hydrological applications;
Vital for the practical relevance of R&D on water resources is availability of operational hydrological ground data such as on precipitation and river discharge;
REFERENCES
Dehecq, A., N. Gourmelen and E.Trouve , 2015. Deriving large-scale glacier velocities from a complete satellite archive: Application to the Pamir–Karakoram–Himalaya Rem. Sens. Env. Vol. 162: 55–66
Hu G.C. and L. Jia, 2015. Monitoring of Evapotranspiration in a Semi-Arid Inland River Basin by Combining Microwave and Optical Remote Sensing Observations, Remote Sensing, 7(3), 3056-3087; doi:10.3390/rs70303056.
Menenti, M., L. Jia and J. Colin, 2014. Coordinated Asia-European long-term Observing system of Qinghai – Tibet Plateau hydro-meteorological processes and the Asian-monsoon systEm with Ground satellite Image data and numerical Simulations (CEOP-AEGIS). Final Report, Ed. University of Strasbourg, France, ISSN 2118-7843: 60 p.