FRACTAL DIMENSIONS FOR RADIOISOTOPE POLLUTION PATTERNS BY
NUCLEAR POWER PLANT ACCIDENTS
Keisuke Saito a*, and Susumu Ogawa b
a
Nagasaki University, Graduate school of engineering, Bunkyo-machi, Nagasaki, 852-8521 Japan [email protected]
b
Nagasaki University, Graduate school of engineering, Bunkyo-machi, Nagasaki, 852-8521 Japan [email protected]
KEY WORDS: Chernobyl, deposit, fractal, Fukushima, NOAA/AVRR
ABSTRACT:
The radioisotope pollution shows two types of patterns: dry and wet deposits for nuclear power plant accidents. Two surface pollution patterns were analysed by fractal. In Fukushima nuclear power plant accident, surface pollution by wet deposits was estimated to occur. However, actually it was no rain and white crystals were observed on the surface. Then, fractal analysis was carried out for the spatial distribution patterns of radio isotopes on the surface to judge the types of deposits. As a reference, Chernobyl nuclear power plant accident was checked for the spatial distribution patterns of radioisotopes on the surface. The objective patterns by fractal analysis were the surface pollution maps in Fukushima and Chernobyl, Abukuma river watershed map, and NOAA/AVHRR. The calculation of fractal dimensions was carried out with the box counting for binarized images. Fractal analysis results suggested the next conclusions. The radioisotope pollution in Fukushima might occur in both dry and wet deposits. The dry deposit might make the pollution pattern similar to the watershed, while the wet deposit might make the pollution pattern similar to cloud images. Moreover, most radioisotope contaminants might flow on the road in the forest valley and deposit on forest with and without rainfall in Fukushima.
1. INTRODUCTION
Each process was calculated from meteorological data for radioisotope pollutions (Japan Meteorological Agency, 2014) with hydrogen explosions at Fukushima Daiichi nuclear power plant derived from the earthquake and Tsunami on March 11, 2011. The pollution at Iidate village was estimated mainly from wet deposits by hydrogen explosion at the second reactor on March 15 (Imanaka, 2014). However, it was little rainfall at the period and dry deposits might be the main pollution by the leak including air vent. Then, the radioisotope pollution was examined on March 12 to 31. Moreover, fractal analysis was applied to the contribution rate of dry and wet deposits in Fukushima. Fractal dimension is the value corresponding to complexity for the forms.
1.1 Outline of the Fukushima nuclear power plant accident
At 14:46 on March 11, 2011, the great earthquake with magnitude of 9.0 occurred from a focus of Sanriku-oki. At 15:50, the great tsunami attacked Fukushima Daiichi and Daini Nuclear Power Plants. The emergent core cooling system did not work and lost cooling ability. Fukushima Daiichi had meltdown at Reactors 1 to 3, and a hydrogen explosion occurred, which made building structures flying to pieces and a big amount of isotopes leaking into the atmosphere. At 13:10 on March 20, Reactor 4 was fired. On March 21, it rained in the Kanto plain, and high concentration of iodine 131 was detected from drinking water in waterworks in the Tone river watershed on March 22 and 23.
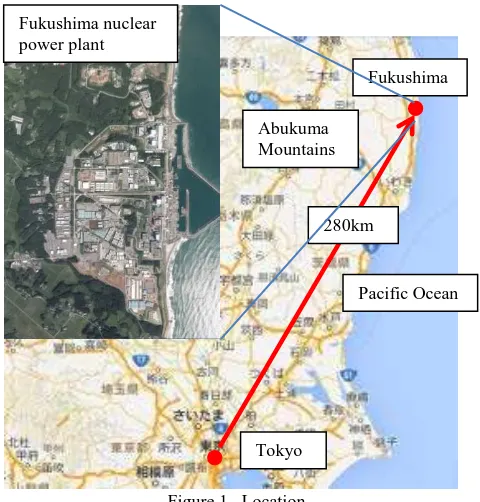
1.2 Location
Fukushima nuclear power plant is located in the place 280km away from Tokyo. On the east side it faces the Pacific Ocean, from which tsunami flowed in. On the other hand, on the west side it faces Abukuma highlands, where the flat land near the plant continues to steep slopes on the surroundings. Location of Fukushima nuclear power plant is shown in Figure 1.
Figure 1. Location Tokyo
Fukushima
280km
Pacific Ocean Abukuma
Mountains Fukushima nuclear
In a particle model, the particle was assumed to be sand with specific weight 2.65 for concrete debris generated by hydrogen explosions in the nuclear power plants and to diffuse by wind with radioisotopes and to fall down with Stokes equation.
��=�
��= particle density, 2650kg/m3 �� = air density, 1.225kg/ m3 µ = viscosity, 1.8×10⁻⁵Pas.
The pollution particle trajectory was obtained each height from the meteorological archives (Meteorological data archive) for the explosions polluting to East Fukushima on March 12 and 15.
2.2 Atmospheric diffusion model
All pollutions were calculated with the plume model and pollution Mar 15 was wet deposit.
Plume model: wind speed >1m/s
C0=√2���
ℎ = vertical mixing layer height � = lateral distance
�� = lateral diffusion distance width in the Axis y direction as next.
σ�= tan���×�+���+��0 (3)
where ��� = standard deviation of wind fluctuation (4o) ��� = diffusion width from Pasquill diagram ��0 = initial diffusion width and half of the grid size
(0.5km).
Horizontal diffusion width in Pasquill is next.
σ�= 0.1467�0.889 (Stability D) (4)
σy= 0.396�
0.865 (Stability B) (5)
Dry deposit speed:
k���=�ℎ� (6) � = precipitation runoff coefficient � = precipitation (m/s).
Here, L = 1.5, R = 0.0015m/s, kwet = 0.00001s-1.
Vd = 0.002m/s corresponds to particle size 0.005mm, 5mm sand particle with natural falling. When precipitation is less than 1.5mm/h, both dry and wet deposits showed in the same way.
2.3 Fractal analysis
Fractal is an irregular geometry with self-similar. Fractal is determined by fractal dimensions, which distribute 1 to 2 in two dimensional images. In fractal analysis, the objects were a soil pollution map in Fukushima accident (Ministry of Education, Culture, Sports, Science and Technology, 2011), a soil pollution map in Chernobyl accident (International Advisory Committee, 1991), Abukuma river watershed map, and NOAA/AVHRR data. In fractal dimension calculation, the box counting method was selected for binarized images.
D = lim�→0loglog �(1/��)=−lim�→0log �log �� (8) 3.1 Particle model
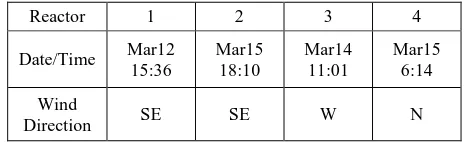
The main hydrogen explosions occurred four times as shown in Table 1. But, only the fourth reactor showed the increase of spatial dose and the others did not show any increase of spatial dose. Moreover, the wind direction at the fourth reactor explosion was north.
Reactor 1 2 3 4
Date/Time Mar12 15:36
Table 1. Hydrogen explosions and the wind directions
Figure 2. Particle flying traces estimated from wind directions and speeds on March 12.
From this result, the possibility of pollution should be contributed by radioisotopes flying at altitude 100m to 300m.
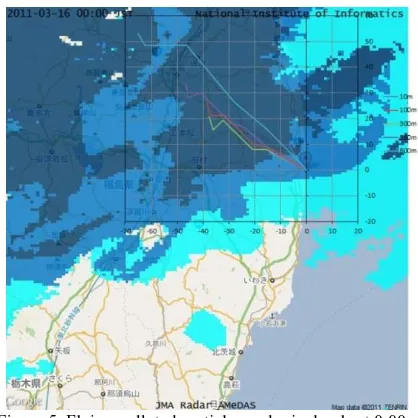
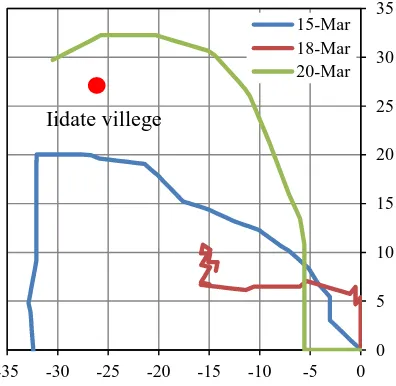
On the other hand, it rained at Iidate village at 16:00 on March 15 shown in Figure 3. At 18:10, the second reactor exploded. Raincloud passed over Fukushima from west and caught flying radioisotopes over East Fukushima at 21:00 as shown in Figure 4. By 24:00 most polluted particles fell down in wet deposit as shown in Figure 5. Polluted particles less than 800m in altitude were estimated to fall down in wet deposit. Polluted particles more than 1000m in altitude passed away to the Pacific Ocean.
Figure 3. Hyetograph on March 15 to 16 at Iidate village.
Figure 4. Flying polluted particles and rainclouds at 21:00 on March 15.
Figure 5. Flying polluted particles and rainclouds at 0:00 on March 16.
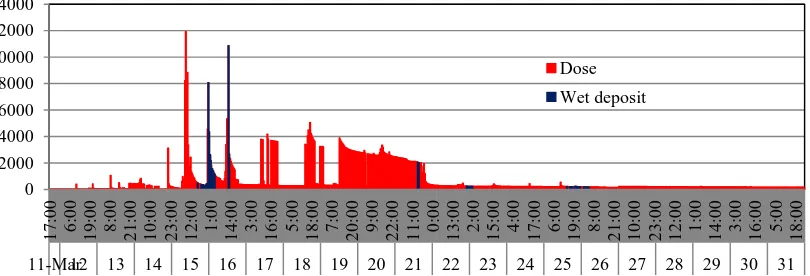
3.2 A time-series of spatial dose and precipitation
A time-series of spatial dose during March 12 and 31 and the contribution to pollution for Iidate village with wind directions east to south and precipitation are shown in Figures 4 and 5.
Figure 6 shows a time-series of spatial dose and the ratio of pollution for Iidate village with 19.6%. Figure 7 shows a time-series of spatial dose and the ratios of dry to wet deposits, respectively 6.5% for wet and 93.5% for dry deposits. Precipitation at Iidate village during the period is shown in Figure8.
During this period, it rained a little with rain intensity 0.5 to 1.5 mm/h and pollution was dry deposits except March 15. It means that pollution at Iidate village was contributed by mainly dry deposits from the leak of radioisotopes including air vent.
0 0.5 1 1.5 2
1 4 7 1013161922 1 4 7 1013161922
15-Mar 16-Mar
where the atmospheric stability was D, the mean wind direction was south southeast with 157.5o, the mean wind speed was 1.3 m/s during 12:00 to 22:30. It rained at 22:30 to 23:30. The mean spatial dose at the gate of Fukushima Daiichi nuclear power plant was 657 μSv/h. It was only wet deposit during this period.
3) Pollution on March 20
where the atmospheric stability was B, the mean wind direction was southeast with 146o, the mean wind speed was 1.7 m/s during 12:00 to 17:30. The mean spatial dose at the gate of Fukushima Daiichi nuclear power plant was 2832 μSv/h.
Figure 6. A time series of spatial dose (unit: μSv/h) and the ratio of pollution for Iidate village.
Figure 7. A time series of spatial dose (unit: μSv/h) and the ratio of dry and wet deposits.
Figure 8. Precipitation at Iidate village on March 11 to 31. 0
Figure 9. Main pollution routes for Iidate.
The overlapped atmospheric pollution map shows almost a normal distribution. From the altitudes in DEM(Figure10), the deposit ratios were assumed to be 0.3 on the adverse slopes and 0.1 on the downward slopes, and Figures 11 and 12 were obtained.
Figure 10. DEM
Figure 11. Overlapped radioisotope pollutions on March 15, 18
Figure 12. Actual pollution map by aircraft monitoring (upper) and synthesized radioisotope pollutions with altitude
correction (lower). (Unit: μSv/h)
3.4 Fractal analysis
Fractal dimensions were quite different between a soil pollution map in Fukushima nuclear power plant accident and Chernobyl accident, respectively 1.83 and 1.53. The fractal dimension for Abukuma river watershed was 1.83, while the one of NOAA/AVHRR with a cloud image was 1.56. It means that the fractal dimension of soil pollution in Fukushima nuclear power plant accident corresponded to the one of Abukuma river watershed.
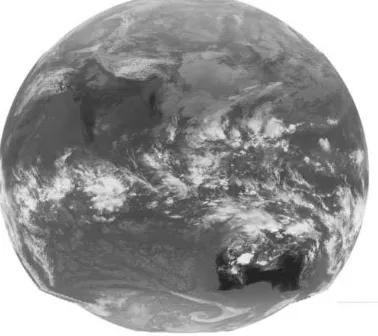
On the other hand, the fractal dimension of soil pollution in Chernobyl nuclear power plant accident corresponded to the one of NOAA/AVHRR with a cloud image.as shown in Figure 13. 0
5 10 15 20 25 30 35
-35 -30 -25 -20 -15 -10 -5 0
15-Mar 18-Mar 20-Mar
Iidate villege
0 10 20 30 40 50
0 5000 10000 15000 20000 25000 30000
50 40 30 20 10 0 -10 -20
25000-30000 20000-25000 15000-20000 10000-15000 5000-10000 0-5000
(μSv/h)
N
Figure 13. NOAA/AVHRR image
Objects Fractal dimension
Soil pollution map in Fukushima 1.83
Soil pollution map in Chernobyl 1.53
Abukuma river watershed 1.83
NOAA/AVHRR with cloud image 1.56
Table 2 Fractal dimensions f radioisotope pollutions
4. DISCUSSION 4.1 Radioisotope pollution at Iidate village
The pollution at Iidate village stated from hydrogen explosion on March 12, but most of contribution was three pollutions on March 15, 18, and 20. Pollution on March 12 was brought by radioisotopes about 100m in altitude. On March 15, 18, and 20, radioisotopes at less than 200m, 500m, and 500m in altitude respectively flowed in the village, but on March 15, it rained directly after sedimentation and others without rainfall. The pollution distributions were determined by mainly the landforms. Especially, radioisotopes collided against the slopes of mountains with altitude 500m to 1192m and adsorbed the surface with pollution.
4.2 Dry deposit and wet deposit
On March 12 to 31, precipitation was 24.5mm in total and ranged 0.5 to 1.5mm/h. On the other hand, in Chernobyl, it rained with more than 5mm at most on April 29 in radioisotope emission during 10 day period, as shown in Figure 14.
Figure 14. Precipitation distribution in Chernobyl on April 29, 1986. (International Advisory Committee,1991)
Figure 15. Radioisotope pollution patterns in Chernobyl. (International Advisory Committee,1991)
As a result, the wet deposit brought a pattern of radioisotope pollution as shown in Figure 15. The change of the altitude is small there and the deposit developed without the effect of the landforms. Therefore, in Fukushima dry deposit was dominant with the effect of the landforms, while in Chernobyl wet deposit was dominant with the effect of precipitation.
5. CONCLUSIONS
From the above results, the next items were concluded.
(1) The radioisotope pollution for Iidate village from Fukushima Daiichi power plant was emitted by the leak mainly on March 15, 18 and 20.
(2) The radioisotope pollution from Fukushima Daiichi nuclear power plant was limited because the diffusion of radioisotopes was controlled by mountain in altitude 500m to 1192m.
In this paper, the deposit ratio was obtained from the altitude in DEM, but the next elements are required to be estimated considering the movement of radioisotopes after the deposit.
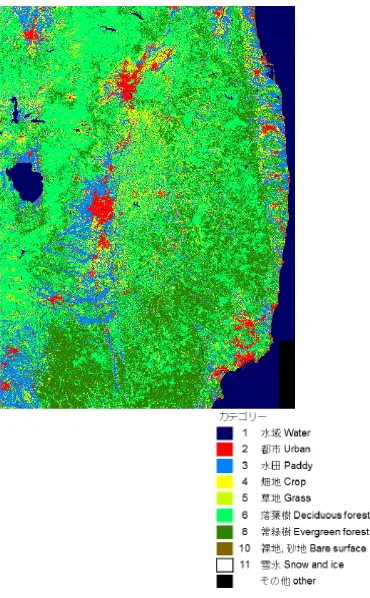
(1) Runoff from rivers and groundwater. (Figure 16) (2) Absorption and runoff by land covers. (Figure 17) (3) Transportation by public networks. (Figure 18)
Figure 16. Runoff from rivers and groundwater
Figure 17. Land cover
Figure 18. Transportation by public network
From these elements, emission by explosions and leaks, advective diffusion in the atmosphere, and movement on the ground surface should be analysed as the comprehensive pollution mechanism near future.
REFERENCES
Imanaka, T., 2014. Estimate of initial external exposure in Iidate village, Science, 84, 3, pp. 322-332.
IAEA, 1991. International Advisory Committee, The international Chernobyl Project, Technical report, Vienna,
Japan Meteorological Agency, 2014. Various data and materials, 2014.
National Institute of Informatics, 2011. Archives of 2011 Great East Japan Earthquake, http://agora.ex.nii.ac.jp/earthquake/-201103-eastjapan/weather/data/wind-20110311/surf/
Mandelbrot, B.B., 1982. The Fractal Geometry of Nature, W.H.Freeman and Company, New York.
Ministry of Education, Culture, Sports, Science and Technology, 2011. Aircraft monitoring.