THE EFFECT OF ENVIRONMENTAL PERFORMANCE,
CORPORATE GOVERNANCE AND PROFITABILITY ON
FIRM’S VALUE
(Empirical Study on Manufacturing Companies Registered on the Stock Exchange in 2014-2016)
Submitted as a Partial Fulfillment of the Requirements for Getting the Bachelor degree of Accounting Department on Faculty Economics and
Business
Created y:
NADYA RUSMIGINA SUMINAR B200 144 022
ACCOUNTING DEPARTMENT
FACULTY OF ECONOMICS AND BUSINESS MUHAMMADIYAH UNIVERSITY OF SURAKARTA
1
THE EFFECT OF ENVIRONMENTAL PERFORMANCE, CORPORATE GOVERNANCE AND PROFITABILITY ON FIRM’S VALUE (Empirical Study on Manufacturing Companies Listed on the Stock
Exchange in 2014-2016)
Abstract
This study is aims to examine the effect of environmental performance, corporate governance and profitability to the firm’s value on manufacturing companies listed in Indonesia Stock Exchange 2014-2016. Corporate governance are represented by institution ownership, the proportion of independent commissioner board and the number of audit committee. Environmental performance was measured by PROPER, profitability measured by ROA and firm’s valued measured by Tobin’s Q. This study is quantitative research which are used secondary data taken by purposive sampling method. Sample obtained 123 samples, but there are outlier data so the final samples are 102 samples. The analytical method used is multiple linear regression method. The result of this study indicate that environmental performance, institution ownership, and the number of audit committee have no significant effect on firm’s value. Otherwise the proportion of independent commissioner board and profitability have significant effect on firm’s value.
Keywords: environmental performance, corporate governance, profitability, firm’s value
Abstrak
Penelitian ini bertujuan untuk menguji pengaruh kinerja lingkungan, tata kelola perusahaan dan profitabilitas terhadap nilai perusahaan pada perusahaan manufaktur yang terdaftar di Bursa Efek Indonesia tahun 2014-2016. Tata kelola perusahaan diproksi dengan kepemilikan institusional, proporsi dewan komisaris independen, dan ukuran komite audit. Kinerja lingkungan diukur dengan menggunakan PROPER, profitabilitas diukur dengan menggunakan ROA, dan nilai perusahaan diukur dengan menggunakan Tobin’s Q. Penelitian ini adalah penelitian kuantitatif dengan menggunakan data sekunder yang diambil dengan metode purposive sampling. Sampel yang diperoleh sebanyak 123 sampel, namun terdapat data outlier sehingga diperoleh sampel akhir sebanyak 102 sampel. Metode analisis yang digunakan adalah analisis regresi linear berganda. Hasil penelitian menunjukkan bahwa kinerja lingkungan, kepemilikan institusional dan ukuran komite audit tidak berpengaruh secara signifikan terhadap nilai perusahaan, sedangkan proporsi dewan komisaris independen dan profitabilitas berpengaruh secara signifikan terhadap nilai perusahaan.
Kata kunci: Kinerja lingkungan, tata kelola perusahaan, profitabilitas, nilai perusahaan
2
1. INTRODUCTION
Firm’s value is the perception of investors to the success level of the company that is often associated with stock prices (Hardiyanti, 2012). Every company that has been Go-Public will publish the company's financial report. If the performance of a company is good or company produces sufficient profits even higher than the previous period, generally investors will be interested in buying shares and that's when the stock price starts moving up. According to Nurlela and Islahuddin (2008), firm’s value is an important indicator for investors to assess the company as a whole.
Measurement of firm’s value is usually based on book value and market value. Measurements with book value and market value are considered less representative because measurements with book values often occur financial transaction manipulation, whereas market values often occur stock’s manipulation by speculators to get profits. One alternative to measure firm’s value is by combining book values and equity market value, which is through the Tobin's Q ratio. This measurement is superior because it is summarizes future information that is relevant to the company's investment decisions and provides an overview of the extent to which the market evaluates the company from various aspects seen by outsiders including investors.
The importance of firm’s value for investors makes management try to increase the value of the company through optimizing the company's performance. Uncontrolled company activity towards various resources causes higher environmental damage. Environmental performance appears as an indicator of the company's concern for the environment. Republic of Indonesia Minister of Environment Regulation Number 6 of 2013 Regarding the Company Performance Rating Program in Environmental Management has set PROPER as a benchmark for measuring the company's efforts in creating a green environment. According to Sukasih and Sugiyanto (2017), the better environmental activities carried out by the company will lead to increased trust in the eyes of stakeholders.
Meanwhile, the process of maximizing firm’s value also often leads to a conflict of interest between managers (agents) and shareholders (principals).
3
Agency theory provides a view that fraud practices by agents which can impact on declining firm’s value can be minimized by the existence of a monitoring or monitoring mechanism, namely the implementation of corporate governance (Hariati and Yeney, 2014).
Another important indicator for investors in assessing a company's performance is profitability. Profitability is the ability of a company which is measured in percentage to know the ability of company to generate profits from sales and investment. Profitability describes whether a business entity has good opportunities or prospects in the future. The higher the profitability of the business entity, the more the company's ability to maintain its survival will be guaranteed (Hermuningsih, 2013).
1.1 Literature Review and Hypothesis Development 1.1.1 Literature Reviews
a. AgencyTheory
According to Jensen and Meckling (1976), agency theory describes relationships or contracts between one or more people (principle) employing other people (agents) to carry out services on their behalf involving delegation of authority for taking decision to the agent. This theory is related to corporate governance because it highlights the direct relationship between principals and agents. Agency theory assumes that each individual is motivated to fulfill their own desires so that it creates a conflict of interest or agency conflict. The agency conflict can be minimized by corporate governance.
b. Legitimacy Theory
According to Deegan and Unerman (2006) in Hariati and Yeney (2014), legitimacy theory states that, organizations continually try to ensure that their operations are accepted according to the limits and norms of society, so they try to ensure that their activities are accepted by outsiders. The company's efforts to preserve the environment are a form of corporate responsibility towards the environment.
4
c. Signaling Theory
Signaling theory explains how a company gives a signal to the parties concerned (Machmuddah, et al. 2015). Companies that provide information about the company's environmental disclosure means a signal to stakeholder about the quality of its management.
d. Firm’s value
Firm’s value is the perception of investors on the level of companies success that is often associated with stock prices (Hardiyanti, 2012). The high and low stock prices are largely influenced by the condition of the issuer. The better the performance of the issuer, the greater the effect of the increase in stock prices, and vice versa.
e. Environmental performance
According to Suratno, et al (2006), environmental performance is the performance of a company in creating a green environment. The company will strive to care for the environment by carrying out environmental conservation efforts to create a green environment.
f. Corporate Governance
According to Shleiver and Vishay (1997) in Ulya (2014) the definition of Corporate governance is a series of mechanisms that can protect minority parties from expropriation carried out by managers and controlling shareholders with an emphasis on legal mechanisms. Good corporate governance can reduce agency problems because it will encourage the creation of an efficient and transparent company. In this study, corporate governance is proxied into 3, namely institutional ownership, the proportion of independent commissioners and the size of the audit committee.
g. Institutional Ownership
Institutional ownership is a form of ownership’s share of a company owned by one or more institutions (Pamungkas, et al. 2017). Based on agency theory, institutional ownership is considered capable of being a monitoring mechanism for actions and decisions taken by management. According to Muzaki (2016),
5
institutional investors will be involved in strategic decision making so it is not easy to believe in earnings manipulation.
h. The Proportion Of Independent Commissioner Board
Independent commissioners are commissioners from outside company, have no affiliation with commissioners, directors, and shareholders, and do not have direct or indirect issuer's shares (Ulya, 2014). The existence of an independent board of commissioners in a company will increase supervision of management, so can minimize fraudulent actions that management take in financial reporting. i. The Number of Audit Committee
According to the Chairman of BAPEPAM Decree Number: Kep-29 / PM / 2004, dated September 24, 2004 in Regulation number IX.I.5 concerning the Establishment and Work Guidelines of the Audit Committee, the audit committee is a committee formed by the board of commissioners to perform tasks company processing supervision.
j. Profitability
Profitability is the ability of a company which is measured in percentage to know the ability of company to generate profits from sales and investment. Profitability is very important for the company in order to maintain business continuity because it indicates future prospects (Wijaya and Sendana, 2015). 1.1.2 Research Hypothesis
a. The Effect of Environmental Performance on Firm’s values
According to legitimacy theory, disclosure of corporate social activities is a form of corporate responsibility towards the community to ensure that the company is able to maintain the environment properly. Companies with good environmental management will get a positive response from the community so that the company's image will increase. According to Lingga and Suaryana (2017), investors are more interested in companies that have good image in the community, because it has an impact on the high consumer loyalty to the company's products then profitability will increase. The higher the profitability of the company, the greater the return received so that it will have an impact on
6
increasing the value of the company. Research by Lingga and Suaryana (2017) and Hariati and Yeney (2014) show that environmental performance has a positive effect on firm value. This shows that environmental performance is one of the factors that can affect firm’s value. Based on the theoretical foundation and the results of previous research, it can be concluded the hypothesis as follows: H1: Environmental performance has a significant effect on Firm’s value b. The Effect of Institutional Ownership on Firm’s Values
Institutional ownership is a form of share ownership of a company owned by one or more institutions (Pamungkas, et al. 2017). Institutional ownership is one way to reduce agency conflict. According to Jensen and Meckling (1976), the higher the level of institutional ownership of a company, the stronger the level of control carried out by external parties to the company so that agency conflicts that occur within the company will decrease. Researched by Lestari (2017) and Susanti (2010) found that Institutional ownership has a positive effect on firm value. Based on this description we can conclude the hypothesis as follows:
H2: Institutional Ownership has a significant effect on Firm’s value
c. The Effect of Independent Board of Commissioners Proportion on Firm’s Values
Fama and Jansen (1983) argue that non-executive directors can act as mediators in disputes that occur among internal managers and control management policies and provide advice to management. More higher the proportion of independent commissioners in the company, more stringent the control so that agency costs will be smaller and the more efficient the company makes the value of the company increase. Manik Research (2011), Hariati and Yeney (2014), and Putra (2015) found a positive relationship between the proportion of independent commissioners and Firm’s value. Based on this description we can conclude the hypothesis as follows:
H3: The proportion of independent commissioners board has a significant effect on Firm’s value
7
d. The Effect of the Audit Committee on Firm’s Values
The audit committee is a non-executive part of corporate governance seen as a market mechanism requirement, in order to maintain public confidence in the mechanism accounting, auditing and other control systems (Linda, 2012). The FCGI statement (2008) describes the relationship of the audit committee to the performance or value of the company, that is, the audit committee is responsible for the field of corporate control. With the existence of an audit committee that is responsible for understanding things that might harm the company, it will minimize the decline in the value of the company. Research conducted by Linda (2012), Manik (2011), and Syafitri (2018) found a positive relationship between the audit committee and Firm’s value. Based on this description, we can conclude the hypothesis as follows:
H4: Audit committee size has a significant effect on Firm’s value e. Profitability Influence on Firm’s values
According to Wijaya and Sendana (2015), companies that experience increased profits reflect that the company has good performance, giving rise to positive sentiment from investors and can make the company's stock price increase, rising stock prices in the market means that the company's value increases in the eyes of investors. Some studies show that profitability has a positive effect on firm value, including Hermuningsih (2013), Hardiyanti (2012) and Wijaya and Sendana (2015). Based on the theoretical foundation, the hypothesis can be concluded as follows:
H5: Profitability has a significant effect on firm value.
2. METHODS 2.1 Types of Research
This research is a quantitative approach research that aims to examine how the influence of independent variables with the dependent variable. The dependent variable of this study is firm’s value, while the independent variables are
8
environmental performance, institutional ownership, the proportion of independent commissioners, the size of the audit commitee and profitability. 2.2 Population
The population in this study were all manufacturing companies listed on the Indonesia Stock Exchange (IDX) in the 2014-2016 period.
2.3 Samples
Determination of samples used purposive sampling technique. This method was chosen with the aim of getting samples that fit the specified criteria. Criteria used include:
1) Manufacturing companies listed on the Stock Exchange during the 2014-2016 period.
2) Manufacturing companies listed on the IDX during the 2014-2016 period that did not experience delisting.
3) Manufacturing companies listed on the Stock Exchange during the 2014-2016 period which received PROPER ratings in a row.
4) Manufacturing companies that present financial statements in Rupiah units in a row during 2014-2016.
2.4 Data and Data Sources
This research uses secondary data. The data used for this study are annual reports of manufacturing company that has been published contained in
www.idx.co.id. Data of the ranking of companies that perform environmental performance are obtained from the PROPER report issued by the Ministry of Environment (KLH), while the share price is obtained from
www.finance.yahoo.com.
2.5 Research Variables and Measurement 1) Firm’s Value (Dependent variable)
Firm’s value is measured using Tobin's Q. Tobin's Q is a ratio measured from the market value of equity plus the book value of total debt then divided by the book value of total assets (Lingga and Suaryana, 2017).
9
2) Independent Variables
a. Environmental Performance
Variables of environmental performance are measured by PROPER which has been introduced by the Ministry of Environment. The PROPER scoring system is measured by an ordinal scale based on company ratings, there are gold rating is given a value of 5, green 4, blue 3, red 2, and black 1.
b. Institutional Ownership
Institutional ownership measured by the percentage of shares held by institutional investors or the shares owned by the institution are divided by the total shares of the company.
Institutional Ownership= ′
Total Shares X100% (2)
c. The Proportion of independent commissioners
The proportion of independent commissioners is measured by the number of independent commissioners divided by the total members of the board of commissioners.
The Proportion of Independent Commissioners = The amount of independent Commissioners
Total of Board Commissioners (3)
d. Size of the Audit Committee
The size of the audit committee is measured by summing up the number of members of the audit committee owned by the company.
e. Profitability
Profitability in this study is proxied by using Return On Assets (ROA). ROA is a ratio used to measure the company's overall ability to generate profits with the amount of assets available within the company.
ROA = Earning After tax
Total Asset x100% (4)
2.6 Data Analysis Methods
Analysis method used in this study is multiple linear regression analysis. Before conducting multiple regression analysis to test the hypothesis, it is necessary to test classic assumptions, including: normality test, multicollinearity test, heteroscedasticity test, and autocorrelation test. Testing goodness of fit include the t test, F test and the coefficient of determination (Rsquare).
10
3. RESULTS AND DISCUSSION
Based on data obtained from the IDX in 2014-2016 there were 141 manufacturing companies. But in this study there are outlier data where the data will cause problems in testing classical assumptions. The total data of the study sample were 41 companies with a 3-year observation period resulting in a total of 123 samples. But there are 21 outlier data, so that the number of samples during the 2014-2016 period was 102 samples.
3.1 Descriptive Analysis
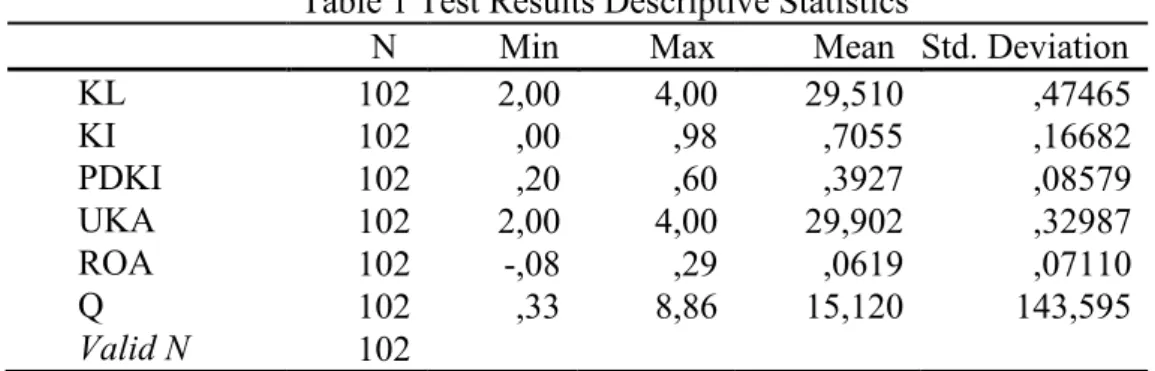
Table 1 Test Results Descriptive Statistics
N Min Max Mean Std. Deviation KL 102 2,00 4,00 29,510 ,47465 KI 102 ,00 ,98 ,7055 ,16682 PDKI 102 ,20 ,60 ,3927 ,08579 UKA 102 2,00 4,00 29,902 ,32987 ROA 102 -,08 ,29 ,0619 ,07110 Q 102 ,33 8,86 15,120 143,595 Valid N 102
Source: Secondary data processed by the author, 2018
The results of the descriptive analysis of firm value (Q) show a minimum value is 0.33, a maximum value is 8.86, an average is 1.5120, and a standard deviation is 1, 43595. Environmental performance (KL) shows a minimum value is 2.00, a maximum value is 4.00, an average is 2.9510, and a standard deviation is 0.47465. Institutional ownership (KI) shows a minimum value is 0.00, a maximum value is 0.98, an average is 0.7055, and a standard deviation is 0.16682. The proportion of independent commissioners (PDKI) shows a minimum value is 0.20, a maximum value is 0.60, an average is 0.3927, and a standard deviation is 0.08579. The audit committee size (UKA) shows a minimum value is 2.00, a maximum value is 4.00, an average is 2.9902, and a standard deviation is 0, 32987. Profitability shows a minimum value is 0.08, a maximum value is 0.29, an average is 0, 0619, and a standard deviation is 0,07110.
3.2 Classical Assumption 1) Test Normality
The normality test of this study uses the CLT test (Central Limit Theorem) is the theorem which states that if the sample tested is large enough (n> 30), then
11
the distribution of the sample is considered to follow a normal distribution (Gujarati, 2006). This study has 102 research samples, so the sample is considered to have a normal distribution because the amount exceeds 30 samples.
2) Multicollinearity Test
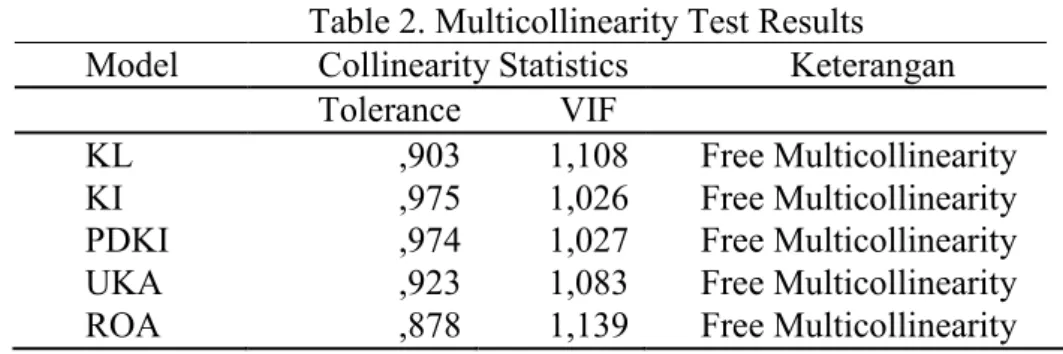
Table 2. Multicollinearity Test Results Model Collinearity Statistics Keterangan Tolerance VIF
KL ,903 1,108 Free Multicollinearity KI ,975 1,026 Free Multicollinearity PDKI ,974 1,027 Free Multicollinearity UKA ,923 1,083 Free Multicollinearity ROA ,878 1,139 Free Multicollinearity Source: Secondary data processed by authors, 2018
Testing in this study by looking at VIF values and values Tolerance. In table 2 the VIF value of each variable is less than 10 and the Tolerance value for each variable is more than 0.10, so there is no multicollinearity problem in this study.
3) Test Heteroskedastiditas
Table 3. Heteroskidastity Test Results Variabel Sig. (2 tailed) Keterangan
KL ,861 Free Heteroscedasticity KI ,425 Free Heteroscedasticity PDKI ,051 Free Heteroscedasticity UKA ,249 Free Heteroscedasticity ROA ,268 Free Heteroscedasticity Source: Secondary data processed by author, 2018
This study using Spearman's Rank Correlation by looking at values sig on the residual where if the sig value is more than 0.05 then it is free of heteroscedasticity. Table 3 shows the sig value of KL of 0.861; KI of 0.425; PDKI of 0.051; UKA of 0.249; and ROA of 0.268. The fifth sig value of the variable is more than 0.05, indicating that there is no heteroscedasticity in the variable.
4) Autocorrelation Test
Table 4.Autocorrelation Test Results
Model R R Square Adjusted R Square Std. Error of the Estimate Durbin-Watson 1 ,537a ,289 ,252 12,420,232 1,984 Source: Secondary data processed by the author, 2018
12
Testing of autocorrelation of this study use Durbin-Watson (DW). Based on table 4, it is obtained DW value of 1.984. Decision making has no positive or negative autocorrelation if the value of dU <dw <4-dU. This study obtained a dU value of 1.7813; 4-dU of 2.2187; dL of 1.5762; and 4-dL of 2.4238. The provisions of dU <dw <4-dU with a value of 1.7813 <1.984 <2.2187 are fulfilled, then the regression model is free from autocorrelation.
5) Linear Regression Test
Table 5. Linear Regression Model Unstandardized Coefficients T Sig. KL ,292 1,067 ,289 KI ,285 ,379 ,705 PDKI 2,937 2,012 ,047 UKA ,231 ,592 ,555 ROA 8,919 4,807 ,000 Source: Secondary data processed authors, 2018
Based on the results of linear regression is known regression equation as follows:
Q = -1,947 + 0,292KL + 0,285KI + 2,937PDKI + 0,231UKA + 8,919ROA + e (5) Interpretation of the regression equation is as follows:
a. Constant values of -1,947 indicate that if all independent variables are fixed or constant, then Firm’s value will be -1,947.
b. KL regression coefficient value of 0.292 means that if a 1 percent increase in environmental performance, then the value of the company will increase by 0.292 percent. Conversely, if a decrease of 1 percent from environmental performance, the value of the company will decrease by 0.292 percent.
c. The KI regression coefficient of 0.285 means that if a 1 percent increase is from institutional ownership, then the value of the company will increase by 0.285 percent. Conversely, if a 1 percent decrease in institutional ownership, the value of the company will decrease by 0.285 percent.
d. PDKI regression coefficient of 2,937 means that if an increase of 1 percent of the proportion of independent commissioners, then the value
13
of the company will increase by 2.937 percent. Conversely, if the decrease of 1 percent of the proportion of independent commissioners, then the value of the company will decrease by 2.937 percent.
e. The UKA regression coefficient of 0.231 means that if an increase of 1 percent of the size of the audit committee, then the value of the company will increase by 0.231 percent. Conversely, if a decrease of 1 percent from the audit committee, the value of the company will decrease by 0.231 percent.
f. The regression coefficient value of 8.919 means that if the increase of 1 percent of profitability, then the value of the company will increase by 8.919 percent. Conversely, if a 1 percent decrease in profitability, the company's value will decrease by 8.919 percent.
3.3 Hypothesis 1) t Test
t test aims to examine the effect of independent variables of environmental performance, institutional ownership, the proportion of independent commissioners, audit committees and profitability to the firm’s value in 2014-2016. Based on the sig value of the t test in table 5 it can be concluded that environmental performance, institutional ownership, and audit committees do not significantly effect firm’s value, while the proportion of independent commissioners and profitability have a significant effect on firm value.
2) F Test
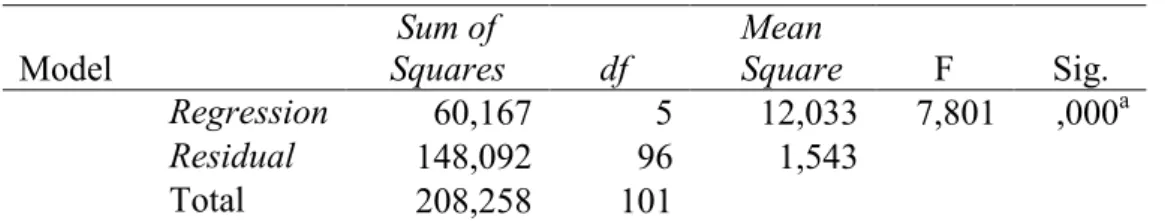
Table 6. F Test Results Model Sum of Squares df Mean Square F Sig. Regression 60,167 5 12,033 7,801 ,000a Residual 148,092 96 1,543 Total 208,258 101 Source: Secondary data processed by the author, 2018
Table 6 shows the significance value of the ANOVA table of 0,000, which means that the value is less than 0.05 or 0,000 <0.05, it can be said that the independent variables of environmental performance, institutional ownership, proportion of independent commissioners, audit committee size and profitability
14
are jointly or simultaneously affect the dependent variable of the firm's value. Thus the regression model used in this study is feasible or fit used as a regression model of hypothesis testing.
3) R2 Test
Table 7. RTest Results2
Model R R Square Adjusted R Square Std. Error of the Estimate 1 537a 0289 0252 1.2420232 Source: Secondary data processed authors, 2018
Table 4.8 shows the amount of adjusted Rsquare is 0.252 or 25.2%. This means that as many as 25.2% of company value variables can be explained by the five independent variables namely environmental performance, institutional ownership, the proportion of independent commissioners, the size of the audit committee and profitability, while the remaining 74.8% (100% - 25.2%) explained by other variables not in the model.
The interpretations of this study are as follows:
1) The Effect of environmental performance on firm’s value
The results of the study show that the environmental performance variable has a significance of 0.289. This value is greater than 0.05, so the 1st hypothesis is not supported. This proves that environmental performance has no significant effect on firm value.
The results of this study are consistent with the research conducted by Tjahjono (2013) and Yendrawati and Tarusnawati (2013) which state that environmental performance does not have a significant effect on firm value. This is allegedly because environmental performance not disclosed in annual reports cannot affect the value of companies in Indonesia, so investors will find it difficult to know the environmental activities of companies and investors prefer to use other variables to assess investment portfolios such as financial ratios. Mareta and Fitriyah (2017) also stated that investor behavior conditions that occur in Indonesia are different from other countries, especially western countries which are considered to be very concerned about environmental activities, so that environmental performance has not been able to influence the value of the
15
company. But the results of this study do not support the statements of Lingga and Suaryana (2017) and Hariati and Yeney (2014) which show that companies that pay attention to their environmental management will be responded positively by investors through increasing stock prices.
2) Effect of institutional ownership on firm value
Institutional ownership variables have a significance of 0.705. This value is greater than 0.05, then the 2nd hypothesis is not supported. This proves that institutional ownership does not have a significant effect on firm value.
Institutional investors with majority share ownership indicate a concentrated ownership structure. The dominance of institutional investors in management will make management tend to carry out policies that are not optimal and make decisions that will provide benefits to institutional shareholders so that they ignore other shareholders, both minority and foreign shareholders. This will result in the disinterest of investors and prospective investors to invest in companies that have greater institutional ownership, so that the value of the company will also decrease.
The results of this study are consistent with the research conducted by Muzaki (2016), Rahma (2014), and Manik (2011) which states that institutional ownership has no effect on firm value. However, the results of this study do not support the research conducted by Lestari (2017) and Susanti (2010) who found that institutional ownership has a positive effect on firm value.
3) The influence of the proportion of independent commissioners on company value
The variable proportion of independent commissioners (PDKI) has a significance of 0.047. This value is greater than 0.05, then the third hypothesis is supported, thus the variable proportion of independent commissioners has a significant effect on firm value.
The results of this study are in accordance with agency theory. The existence of an independent board of commissioners in a company will improve supervision of management, so as to minimize fraudulent actions that management can take in financial reporting and can improve the quality of
16
financial reporting which will ultimately have an impact on increasing company value. Hariati and Yeney (2014) also stated that the monitoring activities of independent commissioners could overcome the problem of conflicts of interest between internal managers.
The results of this study are in line with research conducted by Dewi and Nugrahanti (2014), Hariati and Yeney (2014) and Putra (2015) which state that the proportion of independent commissioners has a positive effect on firm value. However, it does not support the research conducted by Muzaki (2016) and Wehdawati (2015) which states that the proportion of independent commissioners does not affect the value of the company.
4) Effect of audit committee size on firm value
The audit committee size variable (UKA) has a significance of 0.555. This value is greater than 0.05, then the 4th hypothesis is not supported, thus the variable size of the audit committee does not significantly influence the value of the company.
The results of this study are in line with the research of Hariati and Yeney (2014) and Rasaningrum (2016). The size of the audit committee is not able to guarantee an increase in company performance and is unable to be one of the factors to increase the effectiveness of the audit committee. The results of this study are not in accordance with FCGI (2008) which states that the existence of an audit committee responsible for monitoring management will minimize the decline in the value of the company. The effectiveness of an audit committee can be formed if the audit committee is independent, transparent, has high accountability, is fair and has an audit committee charter.
The results of this study do not support the results of Linda (2012), Muntiah (2014), Muzaki (2016) and Syafitri et al (2018) who found a positive relationship between the audit committee and company value.
5) Effect of profitability on firm value
Variable profitability (ROA) has a significance of 0,000. This value is greater than 0.05, then the 5th hypothesis is supported, thus the variable profitability has a significant effect on the value of the company.
17
High profitability shows the company has good performance so that the company's prospects in the future are considered to be better in the eyes of investors. This will lead to a positive response from investors and can make stock prices increase, thus the value of the company will increase as well.
The results of this study are in line with the research of Hermuningsih (2013), Hardiyanti (2012) and Wijaya and Sendana (2015) which state that profitability has a significant effect on firm value. However, it does not support research conducted by Thaib and Dewantoro (2017) and Khoiruddin and Sudarsono (2015) which state that profitability does not have a significant effect on firm value.
4. CONCLUSION 4.1 Conclusions
Based on the results of data analysis that has been done can be concluded as follows:
a. Environmental performance does not significantly influence the value of the company, thus H1 is not supported. The results of this study do not support
the research of Lingga and Suaryana (2017) and Hariati and Yeney (2014). But the results of this study support the research of Tjahjono (2013) and Yendrawati and Tarusnawati (2013).
b. Institutional ownership does not significantly influence the value of the company, thus H2 is not supported. The results of this study do not support
the research of Lestari (2017) and Susanti (2010). But the results of this study support Muzaki's (2016) research, Rahma (2014), and Manik (2011). c. The proportion of independent commissioners has a significant effect on
firm value, thus H3 is supported. The results of this study support the
research of Dewi and Nugrahanti (2014), Hariati and Yeney (2014) and Putra (2015). However, it does not support Muzaki (2016) and Wehdawati (2015) research.
d. The size of the audit committee does not significantly influence the value of the company, thus H4 is not supported. The results of this study do not
18
support the results of Linda (2012), Muntiah (2014), Muzaki (2016) and Syafitri et al (2018). But this study supports the research of Hariati and Yeney (2014) and Rasaningrum (2016).
e. Profitability has a significant effect on firm value, thus H5 is supported. The
results of this study support the research of Hermuningsih (2013), Hardiyanti (2012) and Wijaya and Sendana (2015). However, it does not support the research conducted by thaib and toro Council (2017) and Khoiruddin and Sudarsono (2015)
4.2 Limitations
Research conducted by the author still has several limitations which at the same time can be an illustration for further research, among others:
a. This study only examined five factors that influence value companies, namely environmental performance, institutional ownership, the proportion of independent commissioners, the size of audit committees and profitability so that other variables suspected of influencing firm value were not examined in this study.
b. This study only uses 3 measurements for the proxy of corporate governance, namely institutional ownership, the proportion of independent commissioners and the size of the audit committee, so that there are other proxies not examined in this study.
c. The research sample is only limited to manufacturing companies listed on the Indonesia Stock Exchange in 2014-2016, so it is not known how it affects other types of companies.
d. This study uses stock price data on the website www.finance.yahoo.com so that there is a stock price with a decimal value that has a stock split and there are differences with stock price data in the annual report
.
4.3 Suggestions
Based on the limitations of the research described, it is expected that further research will be broader in developing research. Suggestions that can be given for further research, namely:
19
a. Adding several other variables as factors that can affect the value of the company such as the age of the company, disclosure of CSR, leverage, and others.
b. Add proxy for corporate governance such as board size, number of audit committee meetings, managerial ownership and others.
c. Expanding other industrial sectors listed on the IDX such as the mining sector, property and real estate. In addition, it also adds a longer observation period and so the results obtained will further explain the actual conditions. d. Further research can use stock price data in the annual report so that the
results obtained further explain the value of the company in accordance with disclosures at the annual report.
BIBLIOGRAPHY
Dewi, LC, dan Nugrahanti, YW (2014). Pengaruh Struktur Kepemilikan dan Dewan Komisaris Independen terhadap Nilai Perusahaan (Studi pada Perusahaan Industri Barang Konsumsi di BEI Tahun 2011–2013). Jurnal
Kinerja. Universitas Kristen Satya Wacana. 18(1). PP 64-80.
Fama, E., & Jensen, M. (1983). Agency Problem and Residual Claims. Journal
Of Law And Economic, 26(2), 301-325.
Forum For Corporate Governance In Indonesia (FCGI). Peranan Dewan
Komisaris dan Komite Audit dalam Pelaksanaan Corporate Governance. Seri Tata Kelola Perusahaan Jilid 11.
Gujarati, Damodar. 2006. Dasar-Dasar Ekonometrika. Jakarta: Erlangga.
Hardiyanti, Nia. 2012. Analisis Pengaruh Insider Ownership, Leverage, Profitabilitas, Firm Size dan Deviden Payout Ratio terhadap Nilai Perusahaan (Studi Pada Perusahaan Manufaktur yang terdaftar di BEI Tahun 2007-2010). Thesis.Universitas Diponegoro, Semarang.
Hariati, Isnin dan Rihatiningtyas, YW (2014). Pengaruh Tata Kelola Perusahaan dan Kinerja Lingkungan terhadap Nilai Perusahaan. Simposium Nasional
Akuntansi XVII. Lombok.
Hermuningsih, S. 2013. Pengaruh Profitabilitas, Growth Opportunity, Struktur Modal terhadap Nilai Perusahaan pada Perusahaan Publik di Indonesia.
20
Jensen, Michael C., dan Meckling, William H. 1976. Theory of The Firm:
Managerial Behavior, Agency Cost and Ownership Structure. Journal of Financil Economic, Vol. 3 No. 4, PP: 305-360.
Khoiruddin, M., Sudarsono, MA (2015). Penentu Nilai Perusahaan Penerbit Efek Syariah. Jurnal Dinamika Manajemen (Journal Of Management Dynamics). Universitas Negeri Semarang.
Lestari. (2017). Pengaruh Kepemilikan Institusional dan Struktur Modal terhadap Nilai Perusahaan. Jurnal Riset Manajemen dan Bisnis (JRMB) Fakultas
Ekonomi Uniat. Universitas Islam Attahiriyah. 2(9). P-ISSN : 2527–7502.
Linda. 2012. Mekanisme Corporate Governance dan Biaya Agensi. Simposium
Nasional Akuntansi XV, 1-25. Banjarmasin.
Lingga, W. dan Suaryana, A. (2017). Pengaruh Langsung dan Tidak Langsung Kinerja Lingkungan pada Nilai Perusahaan. E-Jurnal Akuntansi Universitas
Udayana. Universitas Udayana. Vol.20.2. PP 1419-1445. ISSN 2302-8556.
Machmuddah, Z., Utomo, STD, Dulmuid, MS (2014). Manajemen Laba, Pengungkapan Lingkungan Perusahaan dan Mekanisme Tata Kelola Perusahaan. Simposium Nasional Akuntansi XVII. Lombok.
Manik, T. (2011). Analisis Pengaruh Kepemilikan Manajemen, Komisaris Independen, Komite Audit, Umur Perusahaan terhadap Kinerja Keuangan.
JEMI. 2 (2). 25-36.
Mareta, A., dan Fitriyah, FK (2017). Pengaruh Kinerja Lingkungan dan Kepemilikan Asing terhadap Nilai Perusahaan (Studi pada Perusahaan Manufaktur yang Mengikuti Proper dan Terdaftar di Bursa Efek Indonesia Periode 2013-2015). Jurnal Akuntansi Bisnis dan Ekonomi (JABE). Universitas Widyatama. 20(7). PP 449-471. ISSN- 2252-3936.
Muntiah, S. (2014). Pengaruh Mekanisme Corporate Governance terhadap Kinerja Perusahaan. Didapatkan dari
http://eprints.dinus.ac.id/8768/1/jurnal_13448.pdf
Muzaki, Ahmad. (2016). Pengaruh Tata Kelola Perusahaan, Kinerja Lingkungan dan Ukuran Perusahaan terhadap Nilai Perusahaan (Studi Pada Perusahaan Manufaktur yang terdaftar di BEI Tahun 2013-2015). Naskah Publikasi. Universitas Muhammadiyah Yogyakarta.
Nurlela, R., Islahuddin. (2008). Pengaruh Corporate Social Responsibility terhadap Nilai Perusahaan dengan Prosentase Kepemilikan Manajemen Sebagai Variabel Moderating. Simposium Nasional Akuntansi XI. Pontianak.
21
Pamungkas, BH, Ramadhanti, W., Warsidi. (2017). Pengaruh Faktor Corporate
Governance terhadap Nilai Perusahaan dengan Kualitas Laba sebagai
Variabel Mediasi antara Perusahaan Publik di Indonesia dan Thailand.
Simposium Nasional Akuntansi Xx. Jember.
Putra, BPD (2015). Pengaruh Dewan Komisaris, Proporsi Komisaris Independen, terhadap Kinerja Perusahaan. Jurnal Manajemen Teori dan Terapan. Universitas Airlangga. 2(8). PP 70-85.
Rahma, Alfiarti. (2014). Pengaruh Kepemilikan Manajerial, Kepemilikan Institusional, dan Ukuran Perusahaan terhadap Keputusan Pendanaan dan Nilai Perusahaan (Studi Kasus pada Perusahaan Manufaktur yang terdaftar di Bursa Efek Indonesia Periode 2009-2012). Jurnal Bisnis Strategi. Universitas Diponegoro. Vol.23.2. PP 45-69.
Rasaningrum, R. (2016). Pengungkapan Tanggung Jawab Sosial dan Tata Kelola Perusahaan: Pengaruhnya Terhadap Nilai Perusahaan (Studi Empiris pada Perusahaan Manufaktur yang Terdaftar di Bursa Efek Indonesia). Naskah
Publikasi. Universitas Muhammadiyah Surakarta.
Sukasih, A., dan Sugiyanto, E. (2017). Pengaruh Struktur Good Corporate
Governancedan Kinerja Lingkungan terhadap Pengungkapan Corporate Social Responsibility (Studi Pada Perusahaan Manufaktur di Bursa Efek
Indonesia Periode 2011-2015). Jurnal Riset Akuntansi Dan Keuangan
Indonesia. Universitas Muhammadiyah Surakarta. 2 (2). PP 121-131.
Suratno, IB, Darsono, dan Mutmainah, S. (2006). Pengaruh Environmental
Performance terhadap Environmental Disclosure Dan Economic Performance (Studi Empris Pada Perusahaan Manufaktur Yang Terdaftar Di
Bursa Efek Jakarta Periode 2001-2004). Simposium Nasional Akuntansi IX. Padang.
Susanti, Rika. (2010). Analisis Faktor-Faktor Yang Berpengaruh terhadap Nilai Perusahaan (Studi Kasus Perusahaan Go Publik yang Listed Tahun 2005-2008). Essay. Universitas Diponegoro, Semarang.
Syafitri, T., Nuzula, NF, dan Nurlaily, F. (2018). Pengaruh Good Corporate Governance terhadap Nilai Perusahaan (Studi pada Perusahaan Industri Sub Sektor Logam dan Sejenisnya yang terdaftar di BEI Periode 2012-2016).
Jurnal Administrasi Bisnis (JAB). Univеrsitas Brawijaya Malang. 56(3). PP
118-126.
Thaib, Ilham dan Dewantoro, A. (2017). Pengaruh Profitabilitas dan Likuiditas terhadap Nilai Perusahaan dengan Struktur Modal sebagai Variabel Intervening (Studi pada Perusahaan Transportasi Laut di Bursa Efek Indonesia). Jurnal Riset Perbankan Manajemen dan Akuntansi. Perbanas Institute. 1(1). PP 25-44.
22
Tjahjono, Mazda Eko. 2013. Pengaruh Kinerja Lingkungan terhadap Nilai Perusahaan dan Kinerja Keuangan. Jurnal Ekonomi. Universitas Sultan Ageng Tirtayasa. Vol.4.1. PP 38-46.
Ulya, MA (2014). Pengaruh Corporate Governance terhadap Kinerja Ekonomi Perusahaan dengan Kinerja Lingkungan sebagai Variabel Intervening.
Jurnal Akuntansi Diponegoro. 3(3). PP 1-14.
Wehdawati, Swandari, F., dan Jakrillah, S. (2015). Pengaruh Mekanisme Good Corporate Governance dan Struktur Kepemilikan terhadap Kinerja Keuangan Perusahaan Manufaktur yang terdaftar di BEI Tahun 2010-2012.
Jurnal Wawasan Manajemen. Universitas Lambung Mangkurat
Banjarmasin. Vol.3.3. PP 205-216.
Wijaya, BI, dan Sendana, IPB (2015). Pengaruh Profitabilitas terhadap Nilai Perusahaan (Kebijakan Dividen dan Kesempatan Investasi sebagai Variabel Mediasi. E-Jurnal Manajemen Unud. Vol.4.12. PP: 4477-4500. ISSN : 2302-8912.
Yendrawati, R., dan Tarusnawati, LR (2013). Peran Environment Al Performance terhadap Environment Al Disclosure dan Economic Performance. Jurnal
Keuangan dan Perbankan. Universitas Islam Indonesia. Vol.17.3. PP
434-442.
www.finance.yahoo.com www.idx.co.id