Kota Jayapura Dalam Angka/
Jayapura City in Figures 2014
BAB 3
PENDUDUK DAN KETENAGAKERJAAN
Population and Employment
3.1 PENDUDUKJumlah penduduk Kota
Jayapura tahun 2013, tercatat
sebanyak 272.544 orang atau
bertambah 1,58 persen dari tahun
sebelumnya. Jumlah penduduk
terbanyak terdapat di Distrik Abepura
dengan jumlah 77.570 orang.
Sedangkan Distrik Muara Tami
merupakan distrik dengan jumlah penduduk terkecil yaitu 11.869 orang. Dengan luas wilayah 940 km2 berarti kepadatan penduduk Kota Jayapura 290 jiwa/km2.
Tahun 2013, jumlah rumah tangga di Kota Jayapura tercatat
64.209 ruta. Dengan jumlah
penduduk laki-laki 143.848 jiwa dan perempuan 128.696 jiwa, rasio jenis kelamin di Kota Jayapura sebesar 112 yang berarti jumlah penduduk laki-laki lebih banyak 12 persen daripada penduduk perempuan.
Penduduk Kota Jayapura didominasi oleh kelompok penduduk usia 20-34 tahun. Sementara itu kelompok penduduk usia tua (65 tahun keatas) mempunyai proporsi
yang sangat kecil. Hal ini
menunjukkan bahwa tingkat
kematian penduduk usia lanjut sangat tinggi.
3.1 POPULATION
Population of Jayapura City in 2013 were 272.544 people or increase 1,58 percent from the previous year. The biggest populations were found in Abepura Subdistrict for about 77.570 people. While Muara Tami Subdistrict has the smallest population with 11.869 people. The area of Jayapura City was 940 km2, hence its population density was reached 290 inhabitants per km2.
In 2013, number of householdsin Jayapura City recorded were 64.209 households. With
143.848 men population and 128.696
women population, sex ratio at Jayapura City was 112 which means that total of men population was 12 percent more than women population.
Population of Jayapura City were dominated by age group 20-34 years. Meanwhile, old age group (65 years and over) has very small proportion. It means that the death rate of old population were still high
Kota Jayapura Dalam Angka/
Jayapura City in Figures 2014
3.2 KETENAGAKERJAAN
Tahun 2013, jumlah pencari kerja (pencaker) di Kota Jayapura tercatat 18.680 orang, terdiri dari 8.407 pencaker laki-laki dan 10.273 pencaker perempuan. Sebagian besar tingkat pendidikan pencaker adalah SLTA/sederajat yang mencapai 8.228 orang atau 44,09 persen
3.2 EMPLOYMENT
In 2013, the number of job seekers in Jayapura City were recorded 18.680 people, consisting of 8.407 men and10.273 women. Most of the job seeker was a high school graduate reached 8.228 people or 44,09 percent.
Kota Jayapura Dalam Angka/ Jayapura City in Figures 2014 20.000 15.000 10.000 5.000 0 5.000 10.000 15.000 20.000 0-4 5-9 10-14 15-19 20-24 25-29 30-34 35-39 40-44 45-49 50-54 55-59 60-64 65-69 Gambar/Figure 3.1
Jumlah Penduduk Menurut Kelompok Umur dan jenis Kelamin di Kota Jayapura
Number of Population by Group of Age and Sex in Jayapura City 2013 (orang/persons)
=1.000 Laki-Laki/Male =1.000 Perempuan/Female
Sumber : Badan Pusat Statistik Kota Jayapura
Kota Jayapura Dalam Angka/ Jayapura City in Figures 2014
Halaman ini sengaja dikosongkan
Kota Jayapura Dalam Angka/ Jayapura City in Figures 2014 45%
55%
Gambar/Figure 3.3
Persentase Pencari Kerja Menurut Jenis Kelamin di Kota Jayapura
Percentage of Job Seekers by Sex in Jayapura City 2013 (persen/percent) Laki-Laki/Male Perempuan/Female 11.869 77.570 42.828 71.178 69.099
Muara Tami Abepura Heram Jayapura Selatan Jayapura Utara Gambar/Figure 3.2
Jumlah Penduduk Menurut Distrik di Kota Jayapura Number of Population by Subdistrict in Jayapura City
Kota Jayapura Dalam Angka/ Jayapura City in Figures 2014
Halaman ini sengaja dikosongkan
Kota Jayapura Dalam Angka/ Jayapura City in Figures 2014
Tabel 3.1.1
Luas Wilayah, Jumlah Penduduk, dan Kepadatan Penduduk Menurut Distrik di Kota Jayapura, 2013
Table Areas, Number of Population, and Population Density by Subdistricts in
Jayapura City, 2013 Distrik Subdistrict Luas Area Penduduk (orang) Population (people) Kepadatan Penduduk (orang/km2) km2 % Jumlah Total % Population Density (people per (1) (2) (3) (4) (5) (6) 1. Muara Tami 626,7 66,67 11.869 4,35 19 2. Abepura 155,7 16,56 77.570 28,46 498 3. Heram 63,2 6,72 42.828 15,71 678 4. Jayapura Selatan 43,4 4,62 71.178 26,12 1.640 5. Jayapura Utara 51,0 5,43 69.099 25,35 1.355 Jumlah Total 2013 940 100,00 272.544 100,00 290 2012 940 100,00 268.301 100,00 285 2011 940 100,00 262.797 100,00 280 2010 940 100,00 258.890 100,00 275 Sumber : Badan Pusat Statistik Kota Jayapura
Kota Jayapura Dalam Angka/ Jayapura City in Figures 2014
Tabel 3.1.2
Jumlah Penduduk Kota Jayapura Menurut Jenis Kelamin dan Rasio Jenis Kelamin Per Distrik, 2013
Table Population of Jayapura City by Sex and Sex Ratio Per Subdistrict, 2013
Distrik
Subdistrict
Penduduk (orang)
Population (people) Rasio Jenis
Kelamin Sex Ratio Laki-laki Male Perempuan Female Jumlah Total (1) (2) (3) (4) (5) 1. Muara Tami 6.264 5.605 11.869 112 2. Abepura 41.168 36.402 77.570 113 3. Heram 22.800 20.028 42.828 114 4. Jayapura Selatan 37.310 33.868 71.178 110 5. Jayapura Utara 36.306 32.793 69.099 111 Jumlah Total 2013 143.848 128.696 272.544 112 2012 142.014 126.287 268.301 112 2011 139.693 123.104 262.797 113 2010 137.609 121.281 258.890 113
Sumber : Badan Pusat Statistik Kota Jayapura Source : BPS-Statistics of Jayapura City
Kota Jayapura Dalam Angka/ Jayapura City in Figures 2014
Tabel 3.1.3
Jumlah Penduduk Kota Jayapura Menurut Kelompok Umur dan Jenis Kelamin, 2013
Table Population of Jayapura City by Age Group and Sex, 2013
Kelompok Umur
Age Groups
Penduduk (orang)/Population (people)
Laki-laki/Male Perempuan/Female Jumlah/Total
(1) (2) (3) (4) 0-4 15.109 13.888 28.997 5-9 13.956 13.189 27.145 10-14 12.505 11.544 24.049 15-19 12.892 12.001 24.893 20-24 17.957 15.810 33.767 25-29 16.785 14.679 31.464 30-34 14.115 12.334 26.449 35-39 11.017 10.038 21.055 40-44 9.438 8.400 17.838 45-49 7.176 6.051 13.227 50-54 4.955 4.302 9.257 55-59 3.351 2.771 6.122 60-64 2.266 1.718 3.984 65+ 2.326 1.971 4.297 Jumlah Total 2013 143.848 128.696 272.544 2012 142.014 126.287 268.301 2011 139.693 123.104 262.797 2010 137.609 121.281 258.890
Sumber : Badan Pusat Statistik Kota Jayapura Source : BPS-Statistics of Jayapura City
Kota Jayapura Dalam Angka/ Jayapura City in Figures 2014
Tabel 3.1.4
Jumlah Penduduk Distrik Muara Tami Menurut Kelompok Umur dan Jenis Kelamin, 2013
Table Population of Muara Tami Subdistrict by Age Group and Sex, 2013
Kelompok Umur Penduduk (orang)/Population (people)
Age Groups Laki-laki/Male Perempuan/Female Jumlah/Total
(1) (2) (3) (4) 0-4 746 691 1.437 5-9 586 665 1.251 10-14 576 498 1.074 15-19 498 438 936 20-24 516 472 988 25-29 693 589 1.282 30-34 569 517 1.086 35-39 490 382 872 40-44 384 334 718 45-49 329 315 644 50-54 268 266 534 55-59 242 171 413 60-64 154 115 269 65+ 213 152 365 Jumlah Total 2013 6.264 5.605 11.869
Sumber : Badan Pusat Statistik Kota Jayapura Source : BPS-Statistics of Jayapura City
Kota Jayapura Dalam Angka/ Jayapura City in Figures 2014
Tabel 3.1.5
Jumlah Penduduk Distrik Abepura Menurut Kelompok Umur dan Jenis Kelamin, 2013
Table Population of Abepura Subdistrict by Age Group and Sex, 2013
Kelompok Umur Penduduk (orang)/Population (people)
Age Groups Laki-laki/Male Perempuan/Female Jumlah/Total
(1) (2) (3) (4) 0-4 4.116 3.758 7.874 5-9 3.835 3.636 7.471 10-4 3.419 3.257 6.676 15-19 3.710 3.468 7.178 20-24 5.481 4.870 10.351 25-29 5.119 4.355 9.474 30-34 4.248 3.535 7.783 35-39 3.282 2.833 6.115 40-44 2.723 2.281 5.004 45-49 1.971 1.644 3.615 50-54 1.248 1.092 2.340 55-59 893 741 1.634 60-64 559 445 1.004 65+ 564 487 1.051 Jumlah Total 2013 41.168 36.402 77.570
Sumber : Badan Pusat Statistik Kota Jayapura Source : BPS-Statistics of Jayapura City
Kota Jayapura Dalam Angka/ Jayapura City in Figures 2014
Tabel 3.1.6
Jumlah Penduduk Distrik Heram Menurut Kelompok Umur dan Jenis Kelamin, 2013
Table Population of Heram Subdistrict by Age Group and Sex, 2013
Kelompok Umur Penduduk (orang)/Population (people)
Age Groups Laki-laki/Male Perempuan/Female Jumlah/Total
(1) (2) (3) (4) 0-4 2.209 1.991 4.200 5-9 2.024 1.902 3.926 10-14 1.831 1.647 3.478 15-19 2.315 2.265 4.580 20-24 3.797 3.205 7.002 25-29 2.742 2.186 4.928 30-34 2.092 1.820 3.912 35-39 1.536 1.451 2.987 40-44 1.421 1.294 2.715 45-49 1.108 909 2.017 50-54 794 581 1.375 55-59 458 336 794 60-64 253 206 459 65+ 220 235 455 Jumlah Total 2013 22.800 20.028 42.828
Sumber : Badan Pusat Statistik Kota Jayapura Source : BPS-Statistics of Jayapura City
Kota Jayapura Dalam Angka/ Jayapura City in Figures 2014
Tabel 3.1.7
Jumlah Penduduk Distrik Jayapura Selatan Menurut Kelompok Umur dan Jenis Kelamin, 2013
Table Population of Jayapura Selatan Subdistrict by Age Group and Sex, 2013
Kelompok Umur Penduduk (orang)/Population (people)
Age Groups Laki-laki/Male Perempuan/Female Jumlah/Total
(1) (2) (3) (4) 0-4 4.152 3.823 7.975 5-9 3.887 3.626 7.513 10-14 3.360 3.069 6.429 15-19 3.167 2.960 6.127 20-24 4.054 3.784 7.838 25-29 4.292 3.965 8.257 30-34 3.802 3.325 7.127 35-39 2.920 2.757 5.677 40-44 2.542 2.260 4.802 45-49 1.796 1.468 3.264 50-54 1.235 1.119 2.354 55-59 842 721 1.563 60-64 610 478 1.088 65+ 651 513 1.164 Jumlah Total 2013 37.310 33.868 71.178
Sumber : Badan Pusat Statistik Kota Jayapura Source : BPS-Statistics of Jayapura City
Kota Jayapura Dalam Angka/ Jayapura City in Figures 2014
Tabel 3.1.8
Jumlah Penduduk Distrik Jayapura Utara Menurut Kelompok Umur dan Jenis Kelamin, 2013
Table Population of Jayapura Utara Subdistrict by Age Group and Sex, 2013
Kelompok Umur Penduduk (orang)/Population (people)
Age Groups Laki-laki/Male Perempuan/Female Jumlah/Total
(1) (2) (3) (4) 0-4 3.886 3.625 7.511 5-9 3.624 3.360 6.984 10-14 3.319 3.073 6.392 15-19 3.202 2.870 6.072 20-24 4.109 3.479 7.588 25-29 3.939 3.584 7.523 30-34 3.404 3.137 6.541 35-39 2.789 2.615 5.404 40-44 2.368 2.231 4.599 45-49 1.972 1.715 3.687 50-54 1.410 1.244 2.654 55-59 916 802 1.718 60-64 690 474 1.164 65+ 678 584 1.262 Jumlah Total 2013 36.306 32.793 69.099
Sumber : Badan Pusat Statistik Kota Jayapura Source : BPS-Statistics of Jayapura City
Kota Jayapura Dalam Angka/ Jayapura City in Figures 2014
Tabel 3.1.9
Jumlah Penduduk Distrik Muara Tami Dirinci Menurut Kelurahan/ Kampung dan Jenis Kelamin, 2013
Table Population in Muara Tami Subdistrict by Ward/Village and Sex, 2013
Kelurahan/Kampung Penduduk (orang)/Population (people)
Ward/Village Laki-laki/Male Perempuan/Female Jumlah/Total
(1) (2) (3) (4) Koya Barat 2.456 2.221 4.677 Holtekam 532 508 1.040 Skow Yambe 295 307 602 Koya Timur 1.844 1.683 3.527 Skow Mabo 319 282 601 Skow Sae 312 275 587 Koya Tengah 225 161 386 Kampung Mosso 281 168 449 Jumlah Total 2013 6.264 5.605 11.869
Sumber : Badan Pusat Statistik Kota Jayapura Source : BPS-Statistics of Jayapura City
Kota Jayapura Dalam Angka/ Jayapura City in Figures 2014
Tabel 3.1.10
Jumlah Penduduk Distrik Abepura Dirinci Menurut Kelurahan/ Kampung dan Jenis Kelamin, 2013
Table Population in Abepura Subdistrict by Ward/Village and Sex, 2013
Kelurahan/Kampung Penduduk (orang)/Population (people)
Ward/Village Laki-laki/Male Perempuan/Female Jumlah/Total
(1) (2) (3) (4) Asano 4.170 3.672 7.842 Nafri 750 672 1.422 Enggros 218 203 421 Awiyo 6.950 5.826 12.776 Koya Koso 1.595 1.283 2.878 Yobe 4.159 3.717 7.876 Abe Pantai 1.541 1.416 2.957 Kota Baru 4.354 4.231 8.585 Vim 7.448 6.860 14.308 Wai Mhorock 5.435 4.456 9.891 Wahno 4.548 4.066 8.614 Jumlah Total 2013 41.168 36.402 77.570
Sumber : Badan Pusat Statistik Kota Jayapura Source : BPS-Statistics of Jayapura City
Kota Jayapura Dalam Angka/ Jayapura City in Figures 2014
Tabel 3.1.11
Jumlah Penduduk Distrik Heram Dirinci Menurut Kelurahan/Kampung dan Jenis Kelamin, 2013
Table Population in Heram Subdistrict by Ward/Village and Sex, 2013
Kelurahan/Kampung Penduduk (orang)/Population (people)
Ward/Village Laki-laki/Male Perempuan/Female Jumlah/Total
(1) (2) (3) (4) Yoka 1.171 971 2.142 Kampung Waena 966 866 1.832 Hedam 6.100 5.428 11.528 Waena 8.918 7.750 16.668 Yabansai 5.645 5.013 10.658 Jumlah Total 2013 22.800 20.028 42.828
Sumber : Badan Pusat Statistik Kota Jayapura Source : BPS-Statistics of Jayapura City
Kota Jayapura Dalam Angka/ Jayapura City in Figures 2014
Tabel
3.1.12
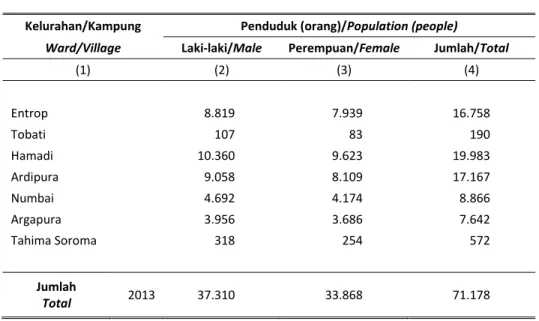
Jumlah Penduduk Distrik Jayapura Selatan Dirinci Menurut Kelurahan/Kampung dan Jenis Kelamin, 2013
Table Population in Jayapura Selatan Subdistrict by Ward/Village and Sex,
2013
Kelurahan/Kampung Penduduk (orang)/Population (people)
Ward/Village Laki-laki/Male Perempuan/Female Jumlah/Total
(1) (2) (3) (4) Entrop 8.819 7.939 16.758 Tobati 107 83 190 Hamadi 10.360 9.623 19.983 Ardipura 9.058 8.109 17.167 Numbai 4.692 4.174 8.866 Argapura 3.956 3.686 7.642 Tahima Soroma 318 254 572 Jumlah Total 2013 37.310 33.868 71.178
Sumber : Badan Pusat Statistik Kota Jayapura Source : BPS-Statistics of Jayapura City
Kota Jayapura Dalam Angka/ Jayapura City in Figures 2014
Tabel
3.1.13
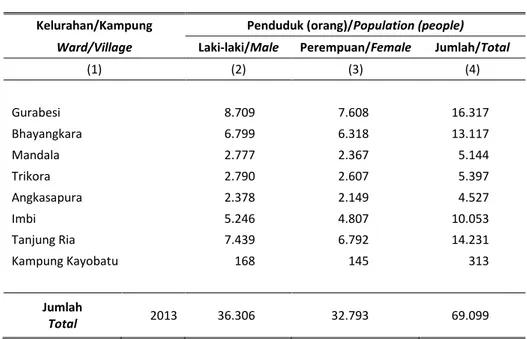
Jumlah Penduduk Distrik Jayapura Utara Dirinci Menurut Kelurahan/Kampung dan Jenis Kelamin, 2013
Table Population in Jayapura Utara Subdistrict by Ward/Village and Sex,
2013
Kelurahan/Kampung Penduduk (orang)/Population (people)
Ward/Village Laki-laki/Male Perempuan/Female Jumlah/Total
(1) (2) (3) (4) Gurabesi 8.709 7.608 16.317 Bhayangkara 6.799 6.318 13.117 Mandala 2.777 2.367 5.144 Trikora 2.790 2.607 5.397 Angkasapura 2.378 2.149 4.527 Imbi 5.246 4.807 10.053 Tanjung Ria 7.439 6.792 14.231 Kampung Kayobatu 168 145 313 Jumlah Total 2013 36.306 32.793 69.099
Sumber : Badan Pusat Statistik Kota Jayapura Source : BPS-Statistics of Jayapura City
Kota Jayapura Dalam Angka/ Jayapura City in Figures 2014
Tabel
3.1.14
Jumlah Penduduk, Rumah Tangga, dan Rata-rata Anggota Rumah Tangga di Kota Jayapura, 2010 – 2013
Table Number of Population, Households and Average of Households
Member in Jayapura City, 2010 - 2013
Tahun
Year
Jumlah Penduduk (orang)
Population (people)
Jumlah Rumah Tangga
Household Rata-rata Anggota Rumah Tangga Average of Household Member (1) (2) (3) (4) 2010 258.890 60.992 4,24 2011 262.797 61.913 4,24 2012 268.301 63.210 4,24 2013 272.544 64.209 4,24
Sumber : Badan Pusat Statistik Kota Jayapura Source : BPS-Statistics of Jayapura City
Kota Jayapura Dalam Angka/ Jayapura City in Figures 2014
Tabel
3.1.15
Jumlah Penduduk, Rumah Tangga, dan Rata-rata Anggota Rumah Tangga menurut Distrik di Kota Jayapura, 2013
Table Number of Population, Households and Average of Households
Member by Subdistrict in Jayapura City, 2013
Distrik Penduduk (orang) Rumah Tangga
Rata-rata Anggota Rumah Tangga
Subdistrict Population (people) Household Average of Household
Member (1) (2) (3) (4) 1. Muara Tami 11.869 2.797 4,24 2. Abepura 77.570 18.276 4,24 3. Heram 42.828 10.091 4,24 4. Jayapura Selatan 71.178 16.769 4,24 5. Jayapura Utara 69.099 16.279 4,24 Jumlah Total 2013 272.544 64.212 4,24 2012 268.301 63.210 4,24 2011 262.797 61.913 4,24 2010 258.890 60.992 4,24
Sumber : Badan Pusat Statistik Kota Jayapura Source : BPS-Statistics of Jayapura City
Kota Jayapura Dalam Angka/ Jayapura City in Figures 2014
Tabel 3.2.1
Pencari Kerja Yang Belum Berpengalaman Yang Mendaftarkan Diri di Disnaker Kota Jayapura Menurut Tingkat Pendidikan. 2012
Table Unexperience Job Applicants Registered in Labour Department by
Education Level. 2012
Tingkat Pendidikan Yang terdaftar Yang
ditempatkan Yang dihapuskan
Education Level Registered Placed Removed
(1) (2) (3) (4)
1. Tidak/belum Tamat SD 29 - -
Not/Not Yet Graduate Elementary School
2. Sekolah Dasar 154 - -
Elementary School
3. SLTP 857 - -
Junior High School
4. SLTA 4.954 - - High School 5. Sarjana Muda 3.334 - - Diploma Degree 6. Sarjana 3.454 - - Strata Degree 7. Pasca Sarjana 2 - - Post Graduate Jumlah Total 2012 12.784 - - 2011 19.034 841 1.476 2010 7.408 841 1.476
Sumber : Dinas Tenaga Kerja Kota Jayapura Source : Labour Dept. Office of Jayapura City
Kota Jayapura Dalam Angka/ Jayapura City in Figures 2014
Tabel 3.2.2
Banyaknya Pencari Kerja Yang Mendaftarkan diri di Disnaker Dirinci Menurut Pendidikan, 2013
Table Number of Job Applicants Registered in Labour Department Office by
Education. 2013 Pendidikan Education Laki-laki Male Perempuan Female Jumlah Total (1) (2) (3) (4) 1. Tidak/belum tamat SD
Not/Not Yet Graduate Elementary School 3 2 5
2. Sekolah Dasar/ Elementary School 25 45 70
3. SMP/ Junior High School (JHS) 501 409 910
4. SMA/ High School
- SMU 1.843 1.985 3.828
- STM Technic HS 876 845 1.721
- SMEA Economic HS 687 765 1.452
5. Setingkat SLTA/ HS Level 567 660 1.227
6. Sarjana Muda/ Diploma Degree 2.245 1.868 4.113 7. Sarjana Lengkap/ Strata Degree 1.655 3.679 5.334
8. Pasca Sarjana/ Post Graduate 5 15 20
Jumlah Total 2013 8.407 10.273 18.680 2012 6.157 6.627 12.784 2011 10.725 8.309 19.034 2010 5.188 5.709 10.897
Sumber : Dinas Tenaga Kerja Kota Jayapura Source : Labour Dept. Office of Jayapura City
Kota Jayapura Dalam Angka/ Jayapura City in Figures 2014
Tabel 3.2.3
Lowongan Yang Belum / Sudah Dipenuhi dan Terdaftar Menurut Sektor, 2010
Table Vacancies been Filled and Registered by Sectors, 2010
Sektor
Sektor
Belum dipenuhi akhir 2010
Not Filled Yet at End of 2010 Terdaftar pada 2010 Registered at 2010 Sudah dipenuhi Tahun 2010 Occupied 2010 (1) (2) (3) (4) 1. Pertanian/ Agriculture 136 83 122
2. Pertambangan dan Penggalian/ Mining 102 97 263
3. Industri/ Industry 124 66 254
4. Listrik. Gas dan Air/ 93 54 273
Electricity. Gas. and Water
5. Bangunan/ Construction 179 162 142
6. Perdagangan dan Hotel 169 132 155
Trade and Hotels
7. Angkutan dan Komunikasi 77 112 57
Transportation and Communication 8.
Keuangan. Asuransi. Usaha persewaan
bangunan/tanah dan jasa perusahaan. 186 131 32
Financial. Insurance. Rent. and Company Services
9. Jasa Kemasyarakan. Sosial dan perorangan 166 72 140 Public. Social. and Person Services
10. Kegiatan yang belum jelas batasnya 70 52 25
Unbounded Activity Jumlah Total 2012 … … … 2011 … … … 2010 1.302 961 1.463 2009 1.135 1.060 1.060
Sumber : Dinas Tenaga Kerja Kota Jayapura Source : Labour Dept. Office of Jayapura City
Kota Jayapura Dalam Angka/ Jayapura City in Figures 2014
Tabel 3.3.1
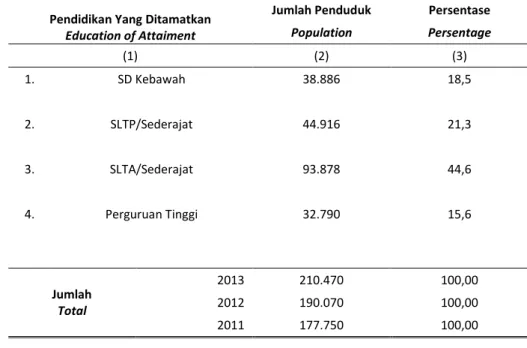
Banyaknya Penduduk Berumur 15 Tahun Ke Atas Menurut Pendidikan Tertinggi Yang Ditamatkan, 2013
Table Number of Population 15 Years Of Age and Over by Education
Attainment, 2013
Pendidikan Yang Ditamatkan
Education of Attaiment
Jumlah Penduduk Persentase
Population Persentage (1) (2) (3) 1. SD Kebawah 38.886 18,5 2. SLTP/Sederajat 44.916 21,3 3. SLTA/Sederajat 93.878 44,6 4. Perguruan Tinggi 32.790 15,6 Jumlah Total 2013 210.470 100,00 2012 190.070 100,00 2011 177.750 100,00
Sumber : Badan Pusat Statistik Kota Jayapura Source : BPS-Statistics of Jayapura City
Kota Jayapura Dalam Angka/ Jayapura City in Figures 2014
Tabel 3.3.2
Proporsi Wanita Usia 25 Tahun Keatas yang Pernah Kawin Menurut Usia Perkawinan Pertama di Kota Jayapura, 2012 - 2013
Table Proportion of Women Aged 25 Years and Older Who Ever Married by
The Age of First Marriage in Jayapura City, 2012-2013
Usia Perkawinan Pertama
2012 2013
Age of First Marriage
(1) (2) (3)
< 16 1.784 2.061
16-24 44.267 45.006
25+ 15.333 16.863
Sumber : Badan Pusat Statistik Kota Jayapura Source : BPS-Statistics of Jayapura City