Chapter 6
Properties, Sources, and Detection of Radiation
In the preceding five chapters, we introduced basic concepts of symmetry, and dis-cussed the structure of crystals in terms of three-dimensional periodic arrays of atoms and/or molecules, sometimes perturbed by various modulation functions. In doing so, we implicitly assumed that this is indeed the reality. Now it is time to think about the problem from a different point of view: how atoms or molecules can be observed – either directly or indirectly – and thus, how is it possible to determine the crystal structure of a material and verify the concepts of crystallographic symmetry. To begin answering this question, consider the following mental experiment: imagine yourself in a dark room next to this book. Since human eyes are sensi-tive to visible light, you will not be able to see the book, nor will you be able to read these words in total darkness (Fig. 6.1, left). Only when you turn on the light, does the book become visible, and the information stored here becomes accessible (Fig. 6.1, right). The fundamental outcome of our experiment is that the book and its content can be observed by means of a visible light after it has been scattered by the object (the book), detected by the eyes.
In general, a source of rays and a suitable detector (such as the light bulb and the eye, respectively) are required to observe common objects. Atoms, however, are too small to be discerned using any visible light source, because atomic radii1range from a few tenths of an angstr¨om to a few angstr¨oms, and they are smaller than 1/1,000 of the wavelengths present in visible light (from ∼4,000 to∼7,000 ˚A). A suitable wavelength to observe individual atoms is that of X-rays. The latter are short-wave electromagnetic radiation discovered by W.C. Roentgen,2and they have
1Atomic radius may be calculated self-consistently or it may be determined from experimental
structural data. Effective size of an atom varies as a function of its environment and nature of chemical bonding. Several different scales – covalent, ionic, metallic, and Van der Waals radii – are commonly used in crystallography.
2Wilhelm Conrad Roentgen (1845–1923). German physicist who on November 8, 1895
discov-ered X-rays and was awarded the first ever Nobel Prize in Physics in 1901 “in recognition of the extraordinary services he has rendered by the discovery of the remarkable rays subsequently named after him.” For more information about W.C. Roentgen see http://www.nobel.se/physics/ laureates/1901/index.html on the Web.
V.K. Pecharsky, P.Y. Zavalij,Fundamentals of Powder Diffraction and Structural 107
Characterization of Materials,DOI: 10.1007/978-0-387-09579-0 6, c
108 6 Properties, Sources, and Detection of Radiation
Fig. 6.1 The illustration of an observer placed in the absolutely dark room with a book (left) and the same room with the light source producing visible rays of light (right).
the wavelengths that are commensurate with both the atomic sizes and shortest in-teratomic distances.
Unfortunately, the index of refraction of X-rays is near unity for all materials and they cannot be focused by a lens in order to observe such small objects as atoms, as it is done by glass lenses in a visible light microscope or by magnetic lenses in an electron microscope. Thus, in general, X-rays cannot be used to image individual atoms directly.3However, as was first shown by Max von Laue in 1912 using a single crystal of hydrated copper sulfate(CuSO4·5H2O), the periodicity of the crystal lattice allows atoms in a crystal to be observed with exceptionally high resolution and precision by means of X-ray diffraction. As we will see later, the diffraction pattern of a crystal is a transformation of an ordered atomic structure into reciprocal space, rather than a direct image of the former, and the three-dimensional distribution of atoms in a lattice can be restored only after the diffraction pattern has been transformed back into direct space.
Particles in motion, such as neutrons and electrons, may be used as an alternative to X-rays. They produce images of crystal structures in reciprocal space because of their dual nature: as follows from quantum mechanics, waves behave as particles (e.g., photons), and particles (e.g., neutrons and electrons) behave as waves with wavelengthλdetermined by the de Broglie4equation:
λ = h
mv (6.1)
wherehis Planck’s constant(h=6.626×10⁻³⁴J s),mis the particle’s rest mass, andvis the particle’s velocity (mv=p, particle momentum).
3Direct imaging of atoms is feasible using X-ray holography, in which the wave after passing
through a sample is mixed with a reference wave to recover phase information and produce three-dimensional interference patterns. See R. Fitzgerald, X-ray andγ-ray holography improve views of atoms in solids, Phys. Today54, 21 (2001).
4Louis de Broglie (1892–1987) the French physicist who postulated the dual nature of the electron.
6.1 Nature of X-Rays 109
For example, a neutron (rest mass,m=1.6749×10⁻²⁷kg) moving at a constant velocityv=3,000 m/s will also behave as a wave withλ=1.319 ˚A. Moreover, charged particles, for example, electrons, can be focused using magnetic lenses. Thus, modern high-resolution electron microscopes allow direct imaging of atomic structures (for the most part in two dimensions on a surface) with the resolution suf-ficient to distinguish individual atoms. Direct imaging methods, however, require sophisticated equipment and the accuracy in determining atomic positions is sub-stantially lower than that possible by means of diffraction techniques.5Hence, direct visualization of a structure with atomic resolution is invaluable in certain applica-tions, but the three-dimensional crystal structures are determined exclusively from diffraction data. For example, electron microscopy may be used to determine unit cells or modulation vectors, both of which are valuable data that may be further employed in solving a crystal structure using diffraction methods, and specifically, powder diffraction.
Nearly immediately after their discovery, X-rays were put to use to study the in-ternal structure of objects that are opaque to visible light but transparent to X-rays, for example, parts of a human body using radiography, which takes advantage of varying absorption: bones absorb X-rays stronger than surrounding tissues. It is in-teresting to note that the lack of understanding of their nature, which did not occur until 1912, did not prevent the introduction of X-rays into medicine and engineer-ing. Today, the nature and the properties of X-rays and other types of radiation are well-understood, and they are briefly considered in this chapter.
6.1 Nature of X-Rays
Electromagnetic radiation is generated every time when electric charge accelerates or decelerates. It consists of transverse waves where electric (E) and magnetic (H) vectors are perpendicular to one another and to the propagation vector of the wave (k), see Fig. 6.2, top. The X-rays have wavelengths from∼0.1 to∼100 ˚A, which are located betweenγ-radiation and ultraviolet rays as also shown in Fig. 6.2, bottom. The wavelengths, most commonly used in crystallography, range between∼0.5 and
∼2.5 ˚A since they are of the same order of magnitude as the shortest interatomic dis-tances observed in both organic and inorganic materials. Furthermore, these wave-lengths can be easily produced in almost every research laboratory.
5Despite recent progress in the three-dimensional X-ray holography [e.g., see M. Tegze, G. Faigel,
110 6 Properties, Sources, and Detection of Radiation
microwave
Wavelength, λ (m)
10−12 10−11 10−10 10−9 10−8 10−7 10−6 10−5 10−4 10−3 10−2 10−1 100
γ
-rays X-rays ultraviolet visible infrared radio E
H
k
Wavelength, λ
Wavelength, λ
Fig. 6.2 Top– the schematic of the transverse electromagnetic wave in which electric (E) and magnetic (H) vectors are mutually perpendicular, and both are perpendicular to the direction of the propagation vector of the wave,k. The wavelength,λ, is the distance between the two neigh-boring wave crests.Bottom– the spectrum of the electromagnetic waves. The range of typical X-ray wavelengths is shaded. The boundaries between different types of electromagnetic waves are diffuse.
6.2 Production of X-Rays
The X-rays are usually generated using two different methods or sources. The first is a device, which is called an X-ray tube, where electromagnetic waves are generated from impacts of high-energy electrons with a metal target. These are the simplest and the most commonly used sources of X-rays that are available in a laboratory of any size, and thus, an X-ray tube is known as a laboratory or a conventional X-ray source. Conventional X-ray sources usually have a low efficiency, and their bright-ness6is fundamentally limited by the thermal properties of the target material. The latter must be continuously cooled because nearly all kinetic energy of the acceler-ated electrons is converted into heat when they decelerate rapidly (and sometimes instantly) during the impacts with a metal target.
The second is a much more advanced source of X-ray radiation – the synchrotron, where high energy electrons are confined in a storage ring. When they move in a circular orbit, electrons accelerate toward the center of the ring, thus emitting elec-tromagnetic radiation. The synchrotron sources are extremely bright (or brilliant7)
6Brightness is measured as photon flux – a number of photons per second per unit area – where
the area is expressed in terms of the corresponding solid angle in the divergent beam. Brightness is different from intensity of the beam, which is the total number of photons leaving the target, because intensity can be easily increased by increasing the area of the target irradiated by electrons without increasing brightness.
7 The quality of synchrotron beams is usually characterized by brilliance, which is defined as
6.2 Production of X-Rays 111
since thermal losses are minimized, and there is no target to cool. Their brightness is only limited by the flux of electrons in the high energy beam. Today, the so-called third generation of synchrotrons is in operation, and their brilliance exceeds that of the conventional X-ray tube by nearly ten orders of magnitude.
Obviously, given the cost of both the construction and maintenance of a syn-chrotron source, owning one would be prohibitively expensive and inefficient for an average crystallographic laboratory. All synchrotron sources are multiple-user facilities, which are constructed and maintained using governmental support (e.g., they are supported by the United States Department of Energy and National Science Foundation in the United States, and by similar agencies in Europe, Japan, and other countries).
In general, there is no principal difference in the diffraction phenomena using the synchrotron and conventional X-ray sources, except for the presence of several highly intense peaks with fixed wavelengths in the conventionally obtained X-ray spectrum and their absence, that is, the continuous distribution of photon energies when using synchrotron sources. Here and throughout the book, the X-rays from conventional sources are of concern, unless noted otherwise.
6.2.1 Conventional Sealed X-Ray Sources
As noted earlier, the X-ray tube is a conventional laboratory source of X-rays. The two types of X-ray tubes in common use today are the sealed tube and the rotating anode tube. The sealed tube consists of a stationary anode coupled with a cathode, and both are placed inside a metal/glass or a metal/ceramic container sealed under high vacuum, as shown in Fig. 6.3.
The X-ray tube assembly is a simple and maintenance-free device. However, the overall efficiency of an X-ray tube is very low – approximately 1% or less. Most of the energy supplied to the tube is converted into heat, and therefore, the anode must be continuously cooled with chilled water to avoid target meltdown. The input power to the sealed X-ray tube (∼0.5 to 3 kW) is, therefore, limited by the tube’s ability to dissipate heat, but the resultant energy of the usable X-ray beam is much lower than 1% of the input power because only a small fraction of the generated photons exits through each window. Additional losses occur during the monochromatization and collimation of the beam (see Sect. 11.2).
In the X-ray tube, electrons are emitted by the cathode, usually electrically heated tungsten filament, and they are accelerated toward the anode by a high electrostatic potential (30 to 60 kV) maintained between the cathode and the anode. The typical current in a sealed tube is between 10 and 50 mA. The X-rays are generated by the impacts of high-energy electrons with the metal target of a water-cooled anode, and they exit the tube through beryllium (Be) windows, as shown in Figs. 6.3 and 6.4.
112 6 Properties, Sources, and Detection of Radiation
Water
X-rays X-rays
Be window
Anode _
e Cathode
Be windows Coupling to a high
voltage cable
Water in
Fig. 6.3 The schematic (left) and the photograph (right) of the sealed X-ray tube. The bottom part of the tube is metallic and it contains the anode (high purity copper, which may be coated with a layer of a different metal, e.g., Cr, Fe, Mo, etc., to produce a target other than copper), the windows (beryllium foil), and the cooling system. The top part of the tube contains the cathode (tungsten filament) and it is manufactured from glass or ceramics, welded shut to the metal canister in order to maintain high vacuum inside the tube. The view of two windows (a total of four) and the “water out” outlet is obscured by the body of the tube (right). High voltage is supplied by a cable through a coupling located in the glass (or ceramic) part of the tube. Both the metallic can and the anode are grounded.
Windows, line focus
Anode Cathode Windows,
point focus
Cathode projection
Cathode
Anode Cathode
projection Point focus
Line focus
Fig. 6.4 The schematic explaining the appearance of two different geometries of the X-ray focus in a conventional sealed X-ray tube (left) and the disassembled tube (right). The photo on the right shows the metallic can with four beryllium windows, two of which correspond to line- and two to point-foci. The surface of the anode with the cathode projection is seen inside the can (bottom,
6.2 Production of X-Rays 113
A standard sealed tube has four Be windows located 90◦apart around the cir-cumference of the cylindrical body. One pair of the opposite windows corresponds to a point-focused beam, which is mostly used in single crystal diffraction, while the second pair of windows results in a line-focused beam, which is normally used in powder diffraction applications, see Fig. 6.4.
Given the geometry of the X-ray tube, the intensities of both the point- and line-focused beams are nearly identical, but their brightness is different: the point focus is brighter than the linear one. The use of the linear focus in powder diffraction is justified by the need to maintain as many particles in the irradiated volume of the specimen as possible. The line of focus (i.e., the projection of the cathode visible through beryllium windows) is typically 0.1 to 0.2 mm wide8and 8 to 12 mm long. Similarly, point focus is employed in single crystal diffraction because a typical size of the specimen is small (0.1 to 1 mm). Thus, high brightness of a point-focused beam enables one to achieve high scattered intensity in a single crystal diffraction experiment.
Recently, some manufactures of X-ray equipment began to utilize the so-called micro-focus sealed X-ray tubes. Due to a very small size of the focal spot, ranging from tens to a hundred of microns, power requirements of these tubes are two orders of magnitude lower when compared to conventional sealed tubes. Because of this, the micro-focus tubes are air-cooled and have long lifetimes, yet they produce bril-liant X-ray beams comparable to those of rotating anode systems, see Sect. 6.2.3. These tubes find applications in diffraction of single crystals, including proteins, but their use in powder diffraction remains limited because of a small cross section of the beam.
6.2.2 Continuous and Characteristic X-Ray Spectra
The X-ray spectrum, generated in a typical X-ray tube, is shown schematically in Fig. 6.5. It consists of several intense peaks, the so-called characteristic spectral lines, superimposed over a continuous background, known as the “white” radiation. The continuous part of the spectrum is generated by electrons decelerating rapidly and unpredictably – some instantaneously, other gradually – and the distribution of the wavelengths depends on the accelerating voltage, but not on the nature of the anode material. White radiation, also known as bremsstrahlung(German for “braking radiation”), is generally highly undesirable in X-ray diffraction analysis applications.9
While it is difficult to establish the exact distribution of the wavelengths in the white spectrum analytically, it is possible to establish the shortest wavelength that will appear in the continuous spectrum as a function of the accelerating voltage. Photons with the highest energy (i.e., rays with the shortest wavelength) are emitted
8The projection of the cathode on the anode surface is wider, 1–2 mm, see Fig. 11.7.
9One exception is the so-called Laue technique, in which white radiation is employed to produce
114 6 Properties, Sources, and Detection of Radiation
Wavelength, λ
Intens
it
y
Kα1
Kα2
Kβ λSW
Fig. 6.5 The schematic of a typical X-ray emission spectrum, for clarity indicating only the pres-ence of continuous background and three characteristic wavelengths: Kα1, Kα2, and Kβ, which
have high intensities. The relative intensities of the three characteristic spectral lines are approx-imately to scale, however, the intensity of the continuous spectrum and the separation of the Kα1/Kα2doublet are exaggerated. Fine structure of the Kβspectral line is not shown for clarity.
Thevertical arrowindicates the shortest possible wavelength of white radiation,λSW, as
deter-mined by (6.4).
by the electrons, which are stopped instantaneously by the target. In this case, the electron may transfer all of its kinetic energy
mν2
2 =eV (6.2)
to a photon with the energy
hν=hc
λ (6.3)
wheremis the rest mass,vis the velocity, andeis the charge of the electron (1.602×
10−19C),V is the accelerating voltage,cis the speed of light in vacuum (2.998×
108m/s),his Planck’s constant (6.626×10⁻³⁴J s),νis the frequency andλis the wavelength of the wave associated with the energy of the photon.
After combining the right-hand parts of (6.2) and (6.3), and solving with respect toλ, it is easy to obtain the equation relating the shortest possible wavelength (λSW
in ˚A) and the accelerating voltage (in V).
λSW =
1.240×10⁴
V A˚ (6.4)
element-6.2 Production of X-Rays 115
Table 6.1 Characteristic wavelengths of five common anode materials and the K absorption edges of suitableβ-filter materials.10
Anode Wavelength ( ˚A) βfilter K absorption
material edge ( ˚A)
Kαa Kα
1 Kα2 Kβ
Cr 2.29105 2.28975(3) 2.293652(2) 2.08491(3) V 2.26921(2) Fe 1.93739 1.93608(1) 1.94002(1) 1.75664(3) Mn 1.896459(6) Co 1.79030 1.78900(1) 1.79289(1) 1.62082(3) Fe 1.743617(5) Cu 1.54187 1.5405929(5) 1.54441(2) 1.39225(1) Ni 1.488140(4) Nb 0.653134(1) Mo 0.71075 0.7093171(4) 0.71361(1) 0.63230(1) Zr 0.688959(3)
aThe weighted average value, calculated asλ
average= (2λKα1+λKα2)/3.
specific and therefore, each chemical element emits X-rays with a constant, that is, characteristic, distribution of wavelengths that appear due to excitations of core electrons by high energy electrons bombarding the target, see Table 6.1. Obviously, before core electrons can be excited from their lower energy levels, the bombard-ing electrons must have energy, which is equal to, or exceeds that of the energy difference between the two nearest lying levels of the target material.
The transitions from L and M shells to the K shell, that is, L→K and M→ K are designated as Kα and Kβ radiation,11 respectively. Here K corresponds to the shell with principal quantum number n=1, L to n=2, and M to n = 3. The Kαcomponent consists of two characteristic wavelengths designated as Kα1and Kα2, which correspond to 2p1/2→1s1/2and 2p3/2→1s1/2transitions, respectively, where s and p refer to the corresponding orbitals. The subscripts1/2 and3/2are equal to the total angular momentum quantum number, j.12The Kβcomponent also consists of several discrete spectral lines, the strongest being Kβ1and Kβ3, which are so close to one another that they are practically indistinguishable in the X-ray spectra of many anode materials. There are more characteristic lines in the emission spectrum (e.g., Lα−γand Mα−ξ); however, their intensities are much lower, and their wavelengths are greater that those of Kαand Kβ. Therefore, they are not used in X-ray diffraction analysis and are not considered here.13
10The wavelengths are taken from the International Tables for Crystallography, vol. C, Second
edi-tion, A.J.C. Wilson and E. Prince, Eds., Kluwer Academic Publishers, Boston/Dordrecht/London (1999). For details on absorption and filtering, see Sects. 8.6.5 and 11.2.2.
11According to IUPAC [R. Jenkins, R. Manne, J. Robin, C. Cenemaud, Nomenclature, symbols,
units and their usage in spectrochemical analysis. VIII Nomenclature system for X-ray energy and polarization, Pure Appl. Chem.63, 735 (1991)] the old notations, e.g., Cu Kα1and Cu Kβshould
be substituted by the initial and final levels separated by a hyphen, e.g., Cu K−L3and Cu K−M3,
respectively. However, since the old notations remain in common use, they are retained throughout this book.
12 j=ℓs whenℓ >0 and j=1/2whenℓ=0, whereℓis the orbital, and s is the spin quantum
numbers. Sinceℓadopts values 0, 1, 2, . . . , n-1, which correspond tos, p,d, . . . orbitals and s=±1/2, j is equal to1/2forsorbitals,1/2or3/
2forporbitals, and so on.
13Except for one experimental artifact shown later in Fig. 6.10, where two components present in
116 6 Properties, Sources, and Detection of Radiation
In addition to their wavelengths, the strongest characteristic spectral lines have different intensities: the intensity of Kα1exceeds that of Kα2by a factor of about two, and the intensity of Kα1,2is approximately five times that of the intensity of the strongest Kβline, although the latter ratio varies considerably with the atomic number. Spectral purity, that is, the availability of a single intense wavelength, is critical in most diffraction applications and therefore, various monochromatization methods (see Sect. 11.2.2) are used to eliminate multiple wavelengths. Although the continuous X-ray emission spectrum does not result in distinct diffraction peaks from polycrystals, its presence increases the background noise, and therefore, white radiation must be minimized.
Typical anode materials that are used in X-ray tubes (Table 6.1) produce char-acteristic wavelengths between∼0.5 and∼2.3 ˚A. However, only two of them are used most commonly. These are Cu in powder and Mo in single-crystal diffractom-etry. Other anode materials can be used in special applications, for example, Ag anode (λKα1=0.5594218 ˚A) can be used to increase the resolution of the atomic structure since using shorter wavelength broadens the range of sinθ/λ over which diffracted intensity can be measured. Bragg peaks, however, are observed closer to each other, and the resolution of the diffraction pattern may deteriorate. On the other hand, Cr, Fe, or Co anodes may be used instead of a Cu anode in powder diffraction (or Cu anode instead of Mo anode in single crystal diffractometry) to increase the resolution of the diffraction pattern (Bragg peaks are observed further apart), but the resolution of the atomic structure decreases.
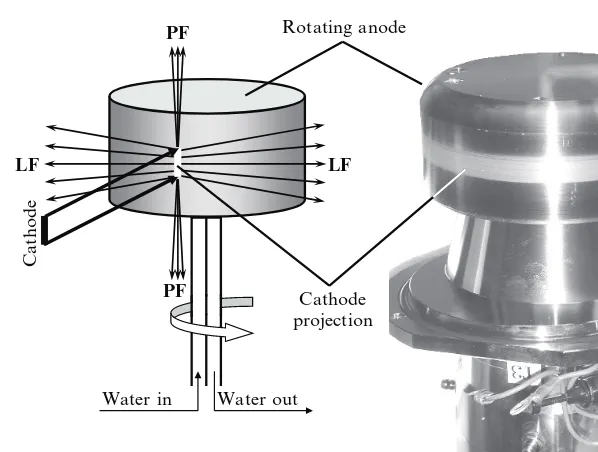
6.2.3 Rotating Anode X-Ray Sources
The low thermal efficiency of the sealed X-ray tube can be substantially improved by using a rotating anode X-ray source,14which is shown in Fig. 6.6. In this design, a massive disk-shaped anode is continuously rotated at a high speed while being cooled by a stream of chilled water. Both factors, that is, the anode mass (and there-fore, the total area bombarded by high energy electrons) and anode rotation, which constantly brings chilled metal into the impact zone, enable a routine increase of the X-ray tube input power to∼15−18 kW and in some reported instances to 50–60 kW, that is, up to 20 times greater when compared to a standard sealed X-ray tube.
The resultant brightness of the X-ray beam increases proportionally to the in-put power; however, the lifetime of seals and bearings that operate in high vacuum is limited.15The considerable improvement in the incident beam brightness yields
X-ray tube) are clearly recognizable in the diffraction pattern collected from the oriented single crystalline silicon wafer.
14 For more details on rotating anode X-ray sources see W.C. Phillips, X-ray sources, Methods
Enzymol.114, 300 (1985) and references therein.
15In the laboratory of one of the authors (VKP) the direct drive rotating anode source manufactured
6.2 Production of X-Rays 117
Rotating anode
Cathode
Water in Water out Cathode projection
LF LF
PF
PF
Fig. 6.6 The schematic (left) and the photograph (right) of the direct drive rotating anode assembly employed in a Rigaku TTRAX powder diffractometer.PFis point focus andLFis line focus. The trace seen on the anode surface on the right is surface damage caused by high-energy electrons bombarding the target and a thin layer deposit of the filament material (W), which occurred during anode operation.
much better diffraction patterns, especially when diffraction data are collected in conditions other than the ambient air (e.g., high or low temperature, high pressure, and others), which require additional shielding and windows for the X-rays to pass through, thus resulting in added intensity losses.
6.2.4 Synchrotron Radiation Sources
Synchrotron radiation sources were developed and successfully brought on line, beginning in the 1960s. They are the most powerful X-ray radiation sources today. Both the brilliance of the beam and the coherence of the generated electromagnetic waves are exceptionally high. The synchrotron output power exceeds that of the conventional X-ray tube by many orders of magnitude. Tremendous energies are stored in synchrotron rings (Fig. 6.7, left), where beams of accelerated electrons or positrons are moving in a circular orbit, controlled by a magnetic field, at relativistic velocities.
118 6 Properties, Sources, and Detection of Radiation
X-ray beam
Electron beam Bending
magnet
Storage ring Injectionpoint
Wavelength, λ
Intensity
Fig. 6.7 Schematic diagram of a synchrotron illustrating X-ray radiation output from bending magnets. Electrons must be periodically injected into the ring to replenish losses that occur dur-ing normal operation. Unlike in conventional X-ray sources, where both the long- and short-term stability of the incident photon beam are controlled by the stability of the power supply, the X-ray photon flux in a synchrotron changes with time: it decreases gradually due to electron losses, and then periodically and sharply increases when electrons are injected into the ring.
Electromagnetic radiation ranging from radiofrequency to short-wavelength X-ray region (Fig. 6.7, right) is produced due to the acceleration of charged particles toward the center of the ring. The X-ray beam is emitted in the direction, tangential to the electron/positron orbit.
Since there is no target to cool, the brilliance of the X-ray beam that can be achieved in synchrotrons is four (first generation synchrotrons) to twelve (third generation synchrotrons) orders of magnitude higher than that from a conventional X-ray source. Moreover, given the size of the storage ring (hundreds of meters in diameter), the average synchrotron beam consists of weakly divergent beams that may be considered nearly parallel at distances typically used in powder diffraction (generally less than 1 m). This feature presents an additional advantage in powder diffraction applications since the instrumental resolution is also increased.
Another important advantage of the synchrotron radiation sources, in addition to the extremely high brilliance of the X-ray beam, is in the distribution of the beam intensity as a function of wavelength (Fig. 6.7, right). The high intensity, observed in a broad range of photon energies, allows for easy selection of nearly any desired wavelength. Further, the wavelength may be changed when needed, and energy dis-persive experiments, in which the diffraction angle remains constant but the wave-length varies, can be conducted.
Thus, synchrotron radiation finds more and more use today, although its avail-ability is restricted to the existing synchrotron sites.16However, some synchrotron sites are equipped with high-throughput automated powder diffractometers that are
16Room-size synchrotron is under development by Lyncean Technologies, Inc. using laser beam
6.3 Other Types of Radiation 119
made available to a broad scientific community. For example, beamline 11-BM, designed by Brian Toby at the APS, is equipped with a 12-channel analyzer system and 100+ samples robotic changer, and is available for rapid access using mail-in service.17 Some of the well-known sites are the ALS – Advanced Light Source at Berkeley Lab, APS – Advanced Photon Source at Argonne National Laboratory, NSLS – National Synchrotron Light Source at Brookhaven National Laboratory, SRS – Synchrotron Radiation Source at Daresbury Laboratory, ESRF – European Synchrotron Radiation Facility in Grenoble, and others.18
6.3 Other Types of Radiation
Other types of radiation that are commonly used in diffraction analysis are neutrons and electrons. The properties of both are compared with those of X-rays in Table 6.2. Neutrons are usually produced in nuclear reactors; they have variable energy and therefore, a white spectrum. Maximum flux of neutrons is usually obtained in an angstrom range of wavelengths. The main differences when compared to X-rays are as follows: (i) neutrons are scattered by nuclei, which are much smaller than electron clouds, and the scattering occurs on points; (ii) scattering factors of elements remain constant over the whole range of Bragg angles; (iii) scattering functions are not proportional to the atomic number, and they are different for different isotopes of the same chemical element. Furthermore, since neutrons have spins, they interact with the unpaired electron spins (magnetic moments) and thus neutron diffraction data are commonly used to determine ordered magnetic structures. Other differences between neutrons and X-rays are nonessential in the general diffraction theory.
One of the biggest disadvantages of the conventional (reactor-generated) neutron sources is relatively low neutron flux at useful energies and weak interactions of neutrons with matter. Hence, a typical neutron experiment calls for 1 to 5 cm3of a material.19 This problem is addressed in the new generation of highly intense pulsed (spallation) neutron sources.20 In a spallation neutron source, bunches of protons are accelerated to high energies, and then released, bombarding a heavy metal target in short but extremely potent pulses. The collision of each proton with a heavy metal nucleus results in many expelled (spalled or knocked out) neutrons at various energies. The resultant highly intense (∼102times higher flux than in any
17See http://11bm.xor.aps.anl.gov/.
18Web links to worldwide synchrotron and neutron facilities can be found at http://www.iucr.org/
cww-top/rad.index.html.
19 This volume is a few orders of magnitude greater than needed for an X-ray diffraction
ex-periment. Some of the third generation, high-flux neutron sources allow measurements of much smaller amounts, e.g., as little as 1 mm3, but acceptable levels of the scattered intensity are
gener-ally achieved by sacrificing resolution.
20The most powerful operational pulsed neutron source is SNS – the Spallation Neutron Source –
120 6 Properties, Sources, and Detection of Radiation
Table 6.2 Comparison of three types of radiation used in powder diffraction.
X-rays (conv./synch.) Neutrons Electrons
Nature Wave Particle Particle
Medium Atmosphere Atmosphere High vacuum Scattering by Electron density Nuclei and
magnetic spins of Wavelength selection Fixed,cKα,β/variable Variablec
bIf unknown, electron scattering factorfe(s)may be derived from X-ray scattering factorfx(s)as
fe(s) =k[Z−fx(s)]/s2, wherekis constant.21
cAccording to Moseley’s22law, X-ray characteristic frequency isν=c/λ=C(Z−σ)2, while for
neutrons and electronsλ=h/mv=h(2mE)−1/2, whereCandσare constants,mis mass,vis
velocity, andEis kinetic energy of a particle.
conventional reactor) neutron beams have a nearly continuous energy spectrum, and they can be used in a variety of diffraction studies, mostly in the so-called time-of-flight (TOF) experiments. In the latter, the energy (and the wavelength) of the neutron that reaches the detector is calculated from the time it takes for a neutron to fly from the source, to and from the specimen to the detector.
In addition to the direct imaging of crystal lattices (e.g., in a high-resolution transmission electron microscope), electrons may be used in diffraction analysis. Despite the ease of the production of electrons by heating a filament in vacuum, electron diffraction is not as broadly used as X-ray diffraction. First, the experiments should be conducted in a high vacuum, which is inconvenient and may result in decomposition of some materials. Second, electrons strongly interact with materials. In addition to extremely thin samples, this requires the use of the dynamical theory of diffraction, thus making structure determination and refinement quite complex. Finally, the complexity and the cost of a high-resolution electron microscope usually considerably exceed those of a high-resolution powder diffractometer.
Neutron diffraction examples are discussed when deemed necessary, even though in this book we have no intention of covering the diffraction of neutrons (and
elec-21Electron diffraction techniques, Vol. 1, J. M. Cowley, Ed., Oxford University Press, NY (1992).
22 Henry Gwyn Jeffreys Moseley (1887–1915). British physicist, who studied X-ray spectra of
6.4 Detection of X-Rays 121
trons) at any significant depth. Interested readers can find more information on electron and neutron diffraction in some of the references provided at the end of this chapter.
6.4 Detection of X-Rays
The detector is an integral part of any diffraction analysis system, and its major role is to measure the intensity and, sometimes, the direction of the scattered beam. The detection is based on the ability of X-rays to interact with matter and to produce cer-tain effects or signals, for example, to generate particles, waves, electrical current, etc., which can be easily registered. In other words, each photon entering the detec-tor generates a specific event, better yet, a series of events that can be recognized, and from which the total photon count (intensity) can be determined. Obviously, the detector must be sensitive to X-rays (or in general to the radiation being detected), and should have an extended dynamic range and low background noise.23
6.4.1 Detector Efficiency, Linearity, Proportionality and Resolution
An important characteristic of any detector is how efficiently it collects X-ray pho-tons and then converts them into a measurable signal. Detector efficiency is deter-mined by first, a fraction of X-ray photons that pass through the detector window (the higher, the better) and second, a fraction of photons that are absorbed by the detector and thus result in a series of detectable events (again, the higher, the bet-ter). The product of the two fractions, which is known as the absorption or quantum efficiency, should usually be between 0.5 and 1.
The efficiency of modern detectors is quite high, in contrast to the X-ray film, which requires multiple photons to activate a single grain of photon-sensitive silver halide. It is important to keep in mind that the efficiency depends on the type of the detector and it normally varies with the wavelength for the same type of the detector. The need for high efficiency is difficult to overestimate since every missed (i.e., not absorbed by the detector) photon is simply a lost photon. It is nearly impossible to account for the lost photons by any amplification method, no matter how far the amplification algorithm has been advanced.
The linearity of the detector is critical in obtaining correct intensity measure-ments (photon count). The detector is considered linear when there is a linear depen-dence between the photon flux (the number of photons entering through the detector window in one second) and the rate of signals generated by the detector (usually the
23For the purpose of this consideration, the dynamic range is the ability of the detector to count
122 6 Properties, Sources, and Detection of Radiation
number of voltage pulses) per second. In any detector, it takes some time to absorb a photon, convert it into a voltage pulse, register the pulse, and reset the detector to the initial state, that is, make it ready for the next operation. This time is usually known as the dead time of the detector – the time during which the detector remains inactive after it has just registered a photon.
The presence of the dead time always decreases the registered intensity. This effect, however, becomes substantial only at high photon fluxes. When the detector is incapable of counting every photon due to the dead time, some of them could be absorbed by the detector but remain unaccounted, that is, become lost photons. It is said that the detector becomes nonlinear under these conditions. Thus the linearity of the detector can be expressed as: (i) the maximum flux in photons per second that can be reliably counted (the higher the better); (ii) the dead time (the shorter, the better), or (iii) the percentage of the loss of linearity at certain high photon flux (the lower percentage, the better). The latter is compared for several different types of detectors in Table 6.3 along with other characteristics.
The proportionality of the detector determines how the size of the generated volt-age pulse is related to the energy of the X-ray photon. Since X-ray photons produce a certain amount of events (ion pairs, photons of visible light, etc.), and each event requires certain energy, the number of events is generally proportional to the energy of the X-ray photon and therefore, to the inverse of its wavelength. The amplitude of the generated signal is normally proportional to the number of these events and thus, it is proportional to the X-ray photon energy, which could be used in pulse-height discrimination. Usually, the high proportionality of the detector enables one to achieve additional monochromatization of the X-ray beam in a straightforward fashion: during the registration, the signals that are too high or too low and thus cor-respond to photons with exceedingly high or exceedingly low energies, respectively, are simply not counted.
Finally, the resolution of the detector characterizes its ability to resolve X-ray photons of different energy and wavelength. The resolution (R) is defined as follows:
R(%) =
√
δV
V 100% (6.5)
Table 6.3 Selected characteristics of the most common detectors using Cu Kαradiation. Property/
Scintillation <1% Very good 45% 350 23 Proportional <5% Good, but fails at high
photon flux
14% 26 310
Solid state Up to 50% Pileup in mid-range 2% 3.7 2,200
acps – counts per second.
bApproximate number of ion pairs or visible light photons resulting from a single X-ray photon
6.4 Detection of X-Rays 123
whereV is the average height of the voltage pulse andδV is the spread of voltage pulses. The latter is also defined as the full width at half-maximum of the pulse height distribution in Volts. The resolution for Cu Kαradiation for the main types of detectors is listed in Table 6.3. Thus, the resolution is a function of both the num-ber of the events generated by a single photon and the energy required to generate the event, and it is critically dependent on how small is the spread in the number of events generated by different photons with identical energy. In other words, high resolution is only viable when every photon is absorbed completely, which is dif-ficult to achieve when the absorbing medium is gaseous, but is nearly ideal in the solid state simply due to the difference in their densities (see Sect. 8.6.5).
6.4.2 Classification of Detectors
Historically, the photographic film is the first and the oldest detector of X-rays, which was in use for many decades. Just as the visible light, the X-ray photons excite fine particles of silver halide when the film is exposed to X-rays. During the development, the exposed halide particles are converted into black metallic silver grains. Only the activated silver halide particles, that is, those that absorbed several X-ray photons (usually at least 3–5 photons), turn into metallic silver.
This type of detector is simple but is no longer in common use due to its low proportionality range, and limited spatial and energy resolution. Moreover, the film-development process introduces certain inconveniences and is time consuming. Finally, the information stored on the developed photographic film is difficult to digitize.
In modern detectors the signal, which is usually an electric current, is easily dig-itized and transferred to a computer for further processing and analysis. In general, detectors could be broadly divided into two categories: ratemeters and true counters. In a ratemeter, the readout is performed after hardware integration, which results, for example, in the electrical current or a voltage signal that is proportional to the flux of photons entering the detector. True counters, on the other hand, count in-dividual photons entering through the detector window and being absorbed by the detector.
Hence, the photographic film vaguely resembles a ratemeter, because the inten-sity is extracted from the degree of darkening of the spots found on the film – the darker the spot, the higher the corresponding intensity as a larger number of pho-tons have been absorbed by the spot on the film surface. The three most commonly utilized types of X-ray detectors today are gas proportional, scintillation, and solid-state detectors, all of which are true counters.
124 6 Properties, Sources, and Detection of Radiation
f(2θ)
f(2θ)
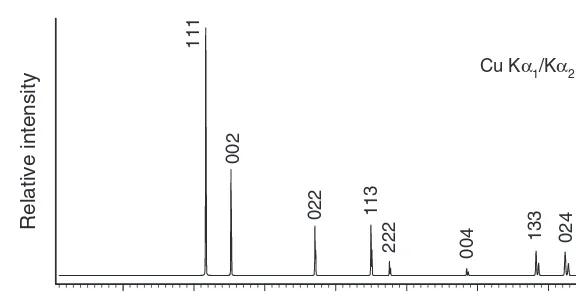
Fig. 6.8 The schematic explaining the difference between point (the set ofdiscrete dots), line (solid rectangle), and area (the entire picture) detectors, which are used in modern powder diffractometry. The light trace extended from the center of the image to the upper-left corner is the shade from the primary beam trap. The Bragg angle is zero at the center of the image and it increases along any line that extends from the center of the image as shown by thetwo arrows(also see Fig. 8.4).
spatial resolution and therefore, they are also known as point detectors. A point detector registers only the intensity of the diffracted beam, one point at a time. In other words, the readout of the detector corresponds to a specific value of the Bragg angle as determined by the position of the detector relatively to both the sample and the incident beam. This is illustrated as the series of dots in Fig. 6.8, each dot corresponding to a single position of the detector and a single-point measurement of the intensity. Thus, to examine the distribution of the diffracted intensity as a function of Bragg angle using a point detector, it is necessary to perform multiple-point measurements at varying Bragg angles.
6.4 Detection of X-Rays 125
6.4.3 Point Detectors
A typicalgas-proportional counterdetector usually consists of a cylindrical body filled with a mixture of gases (Xe mixed with some quench gas, usually CO2, CH4, or a halogen, to limit the discharge) and a central wire anode as shown schematically in Fig. 6.9 (left). High voltage is maintained between the cathode (the body of the counter) and the anode. When the X-ray photon enters through the window and is absorbed by the gas, it ionizes Xe atoms producing positively charged ions and elec-trons, that is, ion pairs (see Table 6.3). The resulting electrical current is measured and the number of current pulses is proportional to the number of photons absorbed by the mixture of gases. The second window is usually added to enable the exit of the nonabsorbed photons, thus limiting the X-ray fluorescence, which may occur at the walls of the counter. In some cases, the cylinder can be filled by a mixture of gases under pressure exceeding the ambient to improve photon absorption and, therefore, photon detection by the detector.
Gas-proportional counters have relatively good resolution, so the heights of cur-rent pulses can be analyzed and discriminated to eliminate pulses that appear due to Kβphotons and due to low and high energy white radiation photons. The pulse height discrimination is often used in combination with a β-filter to improve the elimination of the Kβand white background photons.
The lifetime of a proportional detector is limited to about two years because a fraction of the gas, filling the detector, escapes through the windows, which are usually made from a thin and low-absorbing organic film to improve quantum ef-ficiency. Another disadvantage of this type of the detector is its low effectiveness at high photon fluxes and with short wave (high energy) X-rays, such as Mo (the mass absorption coefficients of Xe are 299 and 38.2 cm2/g for Cu Kαand Mo Kα radiation, respectively).
A typicalscintillation detectoremploys a different principle for the detection of X-rays. It is constructed from a crystal scintillator coupled with a photomultiplier tube as shown in Fig. 6.9 (right). The X-ray photons, which are absorbed by the crystal, generate photons of blue light. After exiting the crystal, blue light photons
X-rays
Crystal scintillator
Photomultiplier
Window
X-rays Window
Anode
Xe+ CO2 or CH4
126 6 Properties, Sources, and Detection of Radiation
are converted into electrons in a photomultiplier and amplified, and the resultant voltage pulses are registered as photon counts.
The crystal scintillator is usually made from cleaved, optically clear sodium io-dide (NaI) activated with∼1% of Tl. The crystals are hydroscopic and thus, they are usually sealed in a vacuum tight enclosure with a thin Be window in the front (X-rays entry window) and high quality optical glass in the back (blue light photons exit window). The crystal is usually mounted on the photomultiplier tube using a viscous fluid that minimizes the refraction of blue light on the interface between the crystal and the photomultiplier.
Unfortunately, due to the relatively high energy of blue light photons, the X-ray wavelength resolution of the scintillation detector is quite low. Although, the ex-tremely short wavelengths (e.g., cosmic rays) can be discriminated and eliminated, the Kβphotons cannot be recognized and filtered out by the detector. Despite their low energy resolution, scintillation detectors are highly stable and effective; espe-cially at high photon fluxes (see Table 6.3). They have very short dead time and therefore, extended linear range. Because of this, scintillation detectors are by far the most commonly used detectors in the modern laboratory X-ray powder diffrac-tometry.
Yet another physical phenomenon is used insolid-state detectors, which are man-ufactured from high quality silicon or germanium single crystals doped with lithium and commonly known as Si(Li) or Ge(Li) solid-state detectors. The interaction of the X-ray photon with the crystal (detector) produces electron–hole pairs in quanti-ties proportional to the energy of the photon divided by the energy needed to gen-erate a single pair. The latter is quite low and amounts to approximately 3.7 eV for a Si-based detector. The electric potential difference applied across the crystal re-sults in the photon-induced electric current, which is amplified and measured. The current is indeed proportional to the number of the generated electron–hole pairs.
In order to minimize noise and Li migration, the solid-state detector should be cooled, usually to∼80 K. This can be done using liquid nitrogen, but it is quite inconvenient to have a cryogenic container mounted on the detector arm, especially since the container needs to be refilled every few days. Thus, solid-state detectors coupled with thermoelectric coolers have been developed and commercialized, and successfully used in powder diffraction.
6.4 Detection of X-Rays 127
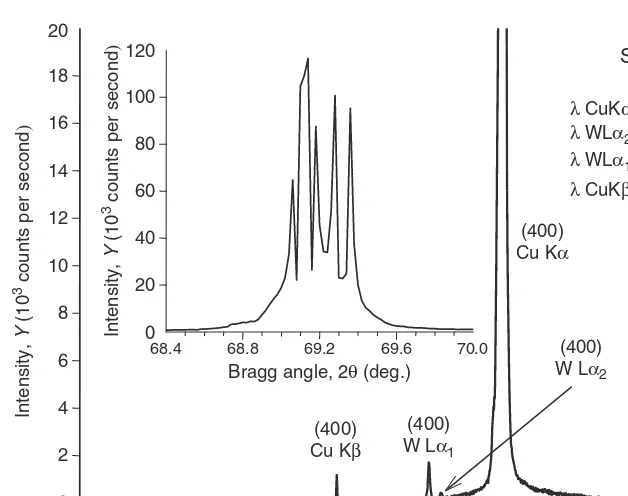
Fig. 6.10 The X-ray diffraction pattern collected from a single crystalline Si-wafer in the reflect-ing position with the [100] direction perpendicular to its surface usreflect-ing a powder diffractometer equipped with the thermoelectric cooled Si(Li) solid-state detector. The inset shows multiple ran-dom spikes for the (400) Cu Kαpeak when photon flux exceeds∼20,000 cps due to the nonlinear-ity of the detector. The additional Bragg peaks are marked with the corresponding characteristic wavelengths (experimental data courtesy of Dr. J.E. Snyder).
The major drawback of this type of detector, not counting the need for continuous cooling, is its relatively low linear range – only up to about 8×10⁴ counts per second. This may result in experimental artifacts when measuring extremely strong Bragg peaks, similar to those shown in Fig. 6.10.
The inset of this figure shows sharp and random spikes peaking at∼1.2×10⁵ counts instead of a smooth Bragg peak, due to the highly nonlinear response of the detector when photon flux exceeds 2−5×10⁴counts per second. Further, the pho-ton energy resolution-based electronic monochromatization also fails. In addition to the (400) Bragg peak centered at 2θ∼=69.2◦, which is expected for this orienta-tion of the single crystalline silicon wafer, three addiorienta-tional Bragg peaks are clearly recognizable in the measured diffraction pattern at 2θ∼=61.6◦,65.9◦and 66.3◦.
A simple analysis, based on the Braggs’ equation, leads to the conclusion that these three peaks are all due to the reflections from the (400) crystallographic planes of Si, each representing a different wavelength in a characteristic spectrum of this particular X-ray tube. The first satellite Bragg peak (2θ∼=61.6◦) corresponds to
128 6 Properties, Sources, and Detection of Radiation
peak from the nearly perfect single crystalline specimen. The two remaining Bragg peaks (2θ∼=65.9◦and 66.3◦) are due to the presence of a W impurity deposited on the surface of the anode (see Fig. 6.4) during the long-time operation of the X-ray tube,24 and they correspond to the reflections caused by W Lα1 and Lα2 characteristic lines. Another unusual feature of this diffraction pattern is the fact that the intensity corresponding to the very weak W Lα1peak is higher than that of the much stronger Cu Kβpeak. Indeed, this happens because the energy of the former is closer to the energy of Cu Kαphotons. Since the detector is tuned to register Cu Kαphotons, discriminating other photons with nearly the same energy is difficult to achieve. It is worth noting that if the same data would be collected using a brand new Cu-anode X-ray tube (which has no deposit from the W filament on the surface of the anode), only two characteristic Cu Bragg peaks would be visible.
6.4.4 Line and Area Detectors
A position sensitive detector (PSD) employs the principle of a gas proportional counter, with an added capability to detect the location of a photon absorption event. Hence, unlike the conventional gas proportional counter, the PSD is a line detector that can measure the intensity of the diffracted beam in multiple (usually thousands) points simultaneously. As a result, a powder diffraction experiment becomes much faster, while its quality generally remains nearly identical to that obtained using a standard gas proportional counter.25
The basic principle of sensing the position of the photon absorption event by the PSD is based on the following property of the proportional counter. The elec-trons (born by the X-ray photon absorption and creation of Xe ion – electron pairs) accelerate along a minimum resistance (i.e., linear) path toward the wire anode, where they are discharged, thus producing the electrical current pulse in the anode circuit. In the point detector, the amplitude of this pulse is measured on one end of the wire. Given the high speed of modern electronics, it is possible to measure the same signal on both ends of the wire anode. Thus, the time difference between the two measurements of the same discharge pulse is used to determine the place where the discharge occurred, provided the length of the wire anode is known, as illustrated schematically in Fig. 6.11.
The spatial resolution of the PSDs is not as high as that attainable with the precise positioning of point detectors. Nevertheless, it remains satisfactory (approaching about 0.01◦) to conduct good-quality experiments. Yet, a minor loss of the resolu-tion is a small price to pay for the ability to collect powder diffracresolu-tion data in a wide range of Bragg angles, simultaneously, which obviously and substantially decreases
24This particular X-ray tube was in service for more than a year and the total number of hours of
operation was approaching 2000. The tube was regularly operated at∼75% of rated power.
25A significant deterioration of the quality of X-ray powder diffraction data may occur when the
6.4 Detection of X-Rays 129
Fig. 6.11 The schematic comparing the conventional gas proportional detector, where the signal is collected on one side of the wire anode (left) and the position sensitive detector, where the signals are measured on both sides of the wire anode (right). The position of the electron discharge (dark dot) is determined by the counting electronics from the difference between times t1and t2it takes
for the two signals to be recorded.
the duration of the experiment. A typical improvement is from many hours when using a point detector to several minutes or less when using a position-sensitive detector.
Different models of the PSD’s may have different geometry, resolution and Bragg angle range: short linear PSD’s cover a few degrees range (from∼5 to 10◦), while long curved PSD’s may cover as much as∼120◦–140◦2θ. The biggest advantage of the long range PSD’s is the considerable experimental time reduction when com-pared to short or medium range position sensitive detectors. Their disadvantage arises from often substantial differences in the photon counting properties observed at different places along the detector, for example in the middle vs. the ends of its length. The large angular spread of long detectors also puts some restrictions on the quality of focusing of X-rays and usually results in the deterioration of the shape of Bragg peaks. Relevant discussion about the geometry of powder diffractometers equipped with PSDs is found in Sect. 11.3.2.
Comparable to PSDs, which fundamentally are gas proportional counters with an added functionality of detecting the location of photon absorption events, thereal time multiple strip detector(RTMS) , employs the principle used in a standard solid state detector (see Sect. 6.4.3). Strip detectors are typically manufactured by using a photolithographic process, during which narrow p-doped strips are deposited on an n-type Si wafer. The simplified schematic of a strip detector is shown in Fig. 6.12. The electric potential difference applied to each strip across the wafer results in the photon-induced electric current, which is amplified and measured. Since both the holes and electrons created as a result of each photon absorption event travel along the path of least resistance, the current measured individually for each strip pro-vides information about the position at which the X-ray photon was absorbed by the detector. The current remains proportional to the number of the generated electron– hole pairs, thus providing information about photon flux at a specific location of the detector.
130 6 Properties, Sources, and Detection of Radiation
n-type Si
+ −
hole electron
X-rays p-type strips
Fig. 6.12 The schematic of a strip detector.
advanced to a commercial status, and are being frequently used in modern X-ray powder diffraction analysis.
In a charge-coupled device detector, X-ray photons are converted by a phos-phor26into visible light, which is captured using a charge-coupled device (CCD). The latter is a chip similar to (or even the same as) those used in modern digital cam-eras. In order to reliably measure a large area, in some detector designs the phosphor may be made several times larger than the chip, and then the generated visible light is demagnified to the size of the chip by using fiber optics, while in other designs several chips (e.g., a 2×2 or 3×3 chip arrays) are glued together. Similar to solid-state detectors, CCD chips are cooled with thermoelectric cooling device to reduce random (thermal) noise.
In an image plate detector (IPD) X-ray photons are also captured by a phos-phor.27 The excited phosphor pixels, however, are not converted into the signals immediately. Instead, the information is stored in the phosphor grains as a latent image, in a way, similar to the activation of silver halide particles in the photo-graphic film during exposure. When the data collection is completed, the image is scanned (or “developed”) by a laser, which deactivates pixels that emit the stored energy as a blue light. Visible light photons are then registered by a photomultiplier in a conventional manner, and the plate is reactivated by another laser. Image plates are integrating detectors with high counting rates and dynamic range but they have relatively long readout times.
26 A typical CCD phosphor is Tb3+doped Gd
2O2S, which converts X-ray photons into visible
light photons.
27A typical image plate phosphor is Eu2+doped BaFBr. When exposed to X-rays, Eu2+oxidizes
to Eu3+. Thus produced electrons may either recombine with Eu3+or they become trapped by
6.6 Problems 131
Table 6.4 Qualitative comparison of the most common area detectors.
Parameter CCD IPD MWD
Active area size Small Large Small Readout time Medium Long Short Counting rate High High Low Dynamic range Medium High Medium Spatial resolution High Low Low
Another type of area detector that finds more use in powder diffraction than other area detectors is a multi-wire detector(MWD) which uses the same principle as gas proportional counters. The wire detector has two anodes made of multi-wire grids which allow detection of theX andY positions at which the photons are absorbed in addition to the total number of the absorbed photons. Table 6.4 compares three types of area detectors discussed here.
6.5 Additional Reading
1. International Tables for Crystallography, vol. A, Fifth revised edition, Theo Hahn, Ed. (2002); vol. B, Third edition, U. Shmueli, Ed. (2008); vol. C, Third Edition, E. Prince, Ed. (2004). All volumes are published jointly with the International Union of Crystallography (IUCr) by Springer. Complete set of the International Tables for Crystallography, Vol. A-G, H. Fuess, T. Hahn, H. Wondratschek, U. M¨uller, U. Shmueli, E. Prince, A. Authier, V. Kopsk´y, D.B. Litvin, M.G. Rossmann, E. Arnold, S. Hall, and B. McMahon, Eds., is available online as eReference at http://www.springeronline.com.
2. R.B. Neder and Th. Proffen, Teaching diffraction with the aid of computer simulations, J. Appl. Cryst.29, 727 (1996); also see Th. Proffen and R.B. Neder. Interactive tutorial about diffraction on the Web at http://www.lks.physik.uni-erlangen.de/diffraction/.
3. P.A. Heiney, High resolution X-ray diffraction. Physics department and laboratory for research on the structure of matter. University of Pennsylvania. http://dept.physics. upenn.edu/∼heiney/talks/hires/hires.html.
4. Electron diffraction techniques. Vol. 1, 2. J. Cowley, Ed., Oxford University Press. Oxford (1992).
5. R. Jenkins and R.L. Snyder, Introduction to X-ray powder diffractometry. Wiley, New York (1996).
6. J. Als-Nielsen and D. McMorrow, Elements of modern X-ray physics, Wiley, New York (2001).
6.6 Problems
1.A typical energy of electrons in a modern transition electron microscope is 300 keV. Calculate the corresponding wavelength of the electron beam assuming that the vacuum inside the microscope is ideal.
132 6 Properties, Sources, and Detection of Radiation
3.You are in charge of buying a new powder diffractometer for your company. The company is in business of manufacturing alumina (Al2O3) based ceramics. The powder diffractometer is to become a workhorse instrument in the quality con-trol department. Routine experiments will include collecting powder diffraction data from ceramic samples to analyze their structure and phase composition. High data collection speeds are critical because a typical daily number of samples to be ana-lyzed using the new equipment is 100+. The following options are available from different vendors:
Sealed Cu X-ray tube, scintillation detector; the lowest cost.
Sealed Cu X-ray tube, solid state detector; $10,000 more than the first option. Sealed Cu X-ray tube, curved position sensitive detector; $25,000 more than the first option.
Chapter 7
Fundamentals of Diffraction
When X-rays propagate through a substance, the occurrence of the following processes should be considered in the phenomenon of diffraction:
– Coherent scattering (Sect 7.1), which produces beams with the same wavelength as the incident (primary) beam. In other words, the energy of the photons in a coherently scattered beam remains unchanged when compared to that in the primary beam.
– Incoherent (or Compton1) scattering, in which the wavelength of the scattered beam increases due to partial loss of photon energy in collisions with core elec-trons (the Compton effect).
– Absorption of the X-rays, see Sect 8.6.5, in which some photons are dissipated in random directions due to scattering, and some photons lose their energy by ejecting electron(s) from an atom (i.e., ionization) and/or due to the photoelectric effect (i.e., X-ray fluorescence).
Incoherent scattering is not essential when the interaction of X-rays with crys-tal lattices is of concern, and it is generally neglected. When absorption becomes significant, it is usually taken into account as a separate effect. Thus, in the first ap-proximation only coherent scattering results in the diffraction from periodic lattices and is considered in this chapter.
Generally, the interaction of X-rays (or any other type of radiation with the proper wavelength) with a crystal is multifaceted and complex, and there are two different levels of approximation – kinematical and dynamical theories of diffrac-tion. In thekinematical diffraction, a beam scattered once is not allowed to be scat-tered again before it leaves the crystal. Thus, the kinematical theory of diffraction is based on the assumption that the interaction of the diffracted beam with the crystal
1Arthur Holly Compton (1897–1962). The American physicist, best known for his discovery of
the increase of wavelength of X-rays due to scattering of the incident radiation by free electrons – inelastic scattering of X-ray photons – known today as the Compton effect. With Charles Thomson Rees Wilson, Compton shared the Nobel Prize in physics in 1927 “for his discovery of the effect named after him.” See http://nobelprize.org/nobel prizes/physics/laureates/1927/compton-bio.html for more information.
V.K. Pecharsky, P.Y. Zavalij,Fundamentals of Powder Diffraction and Structural 133
Characterization of Materials,DOI: 10.1007/978-0-387-09579-0 7, c
134 7 Fundamentals of Diffraction
is negligibly small. This requires the following postulations: (1) a crystal consists of individual mosaic blocks – crystallites2– which are slightly misaligned with respect to one another; (2) the size of the crystallites is small, and (3) the misalignment of the crystallites is large enough, so that the interaction of X-rays with matter at the length scale exceeding the size of mosaic blocks is negligible.
On the contrary, the theory of thedynamical diffractionaccounts for scattering of the diffracted beam and other interactions of waves inside the crystal, and thus the mathematical apparatus of the theory is quite complex. Dynamical effects become significant and the use of the theory of dynamical diffraction is justified only when the crystals are nearly perfect, or when there is an exceptionally strong interaction of the radiation with the material. In the majority of crystalline materials, however, dynamical effects are weak and they are usually noticeable only when precise sin-gle crystal experiments are conducted. Even then, numerous dynamical effects (e.g., primary and/or secondary extinction, simultaneous diffraction, thermal diffuse scat-tering, and others) are usually applied as corrections to the kinematical diffraction model.
The kinematical approach is simple, and adequately and accurately describes the diffraction of X-rays from mosaic crystals. This is especially true for polycrystalline materials where the size of crystallites is relatively small. Hence, the kinematical theory of diffraction is used in this chapter and throughout this book.
7.1 Scattering by Electrons, Atoms and Lattices
It is well-known that when a wave interacts with and is scattered by a point object, the outcome of this interaction is a new wave, which spreads in all directions. If no energy loss occurs, the resultant wave has the same frequency as the incident (primary) wave and this process is known as elastic scattering. In three dimensions, the elastically scattered wave is spherical, with its origin in the point coinciding with the object as shown schematically in Fig. 7.1.
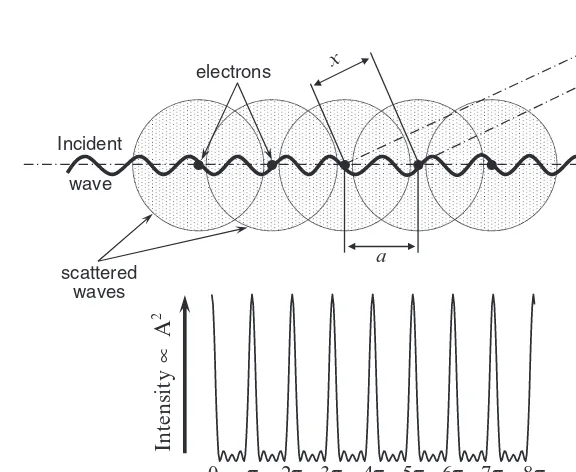
When two or more points are involved, they all produce spherical waves with the sameλ, which interfere with each other simply by adding their amplitudes. If the two scattered waves with parallel-propagation vectors are completely in-phase, the resulting wave has its amplitude doubled (Fig. 7.2 top), while the waves, which are completely out-of-phase, extinguish one another as shown in Fig. 7.2 (bottom).
The first case seen in Fig. 7.2 is called constructive interference and the second case is termed as destructive interference. Constructive interference, which occurs on periodic arrays of points, increases the resultant wave amplitude by many or-ders of magnitude and this phenomenon is one of the cornerstones in the theory of diffraction.
2Crystallite usually means a tiny single crystal (microcrystal). Each particle in a polycrystalline
7.1 Scattering by Electrons, Atoms and Lattices 135
Scattered spherical wave
Incident wave
Fig. 7.1 The illustration of a spherical wave produced as a result of elastic scattering of the incident wave by the point object (filled dotin the center of thedotted circle).
+
+
k
Fig. 7.2 The two limiting cases of the interaction between two waves with parallel propagation vectors (k): the constructive interference of two in-phase waves resulting in a new wave with double the amplitude (top), and the destructive interference of two completely out-of-phase waves in which the resultant wave has zero amplitude, i.e., the two waves extinguish one another (bottom).
Diffraction can be observed only when the wavelength is of the same order of magnitude as the repetitive distance between the scattering objects. Thus, for crys-tals, the wavelength should be in the same range as the shortest interatomic dis-tances, that is, somewhere between∼0.5 and∼2.5 ˚A. This condition is fulfilled when using electromagnetic radiation, which within the mentioned range of wave-lengths, are X-rays. It is important to note that X-rays scatter from electrons, so that the active scattering centers are not the nuclei, but the electrons, or more precisely the electron density, periodically distributed in the crystal lattice.