BACHELOR THESIS – ME 141502
CONCEPTUAL DESIGN OF MINI LNG SUPPLY CHAIN
FOR POWER PLANTS IN WEST BORNEO
ANTONNY SUHERI NRP. 4213 101 007
Supervisors :
A.A.B Dinariyana DP, S.T., MES., Ph D Dr. I Made Ariana, S.T., M.T
DOUBLE DEGREE PROGRAM OF MARINE ENGINEERING DEPARTMENT Faculty of Marine Technology
SKRIPSI – ME 141502
DESAIN KONSEP MINI RANTAI PASOK LNG UNTUK
MEMENUHI
KEBUTUHAN
PEMBANGKIT
DI
KALIMANTAN BARAT
ANTONNY SUHERI NRP. 4213 101 007
Supervisors :
A.A.B Dinariyana DP, S.T., MES., Ph D Dr. I Made Ariana, S.T., M.T
PROGRAM DOUBLE DEGREE
DEPARTEMEN TEKNIK SISTEM PERKAPALAN Fakultas Teknologi Kelautan
APPROVAL FORM
CONCEPTUAL DESIGN OF MINI LNG SUPPLY CHAIN FOR POWER PLANTS IN WEST BORNEO
BACHELOR THESIS
Submitted to Comply One of the Requirements to Obtain a Bachelor of Engineering Degree
In
Double Degree Marine Engineering (DDME) Program Department of Marine Engineering – Faculty of Marine Technology
Institut Teknologi Sepuluh Nopember Department of Maritime Studies
Hochschule Wismar, University of Applied Sciences
Submitted by:
ANTONNY SUHERI
NRP. 4213101007
Approved by Bachelor Thesis Supervisor and Co-Supervisor:
1. A.A.B Dinariyana DP, S.T., MES., Ph D ...
2. Dr. I Made Ariana, S.T., M.T. ...
APPROVAL FORM
CONCEPTUAL DESIGN OF MINI LNG SUPPLY CHAIN FOR POWER PLANTS IN WEST BORNEO
BACHELOR THESIS
Submitted to Comply One of the Requirements to Obtain a Bachelor of Engineering Degree
In
Double Degree Marine Engineering (DDME) Program Department of Marine Engineering – Faculty of Marine Technology
Institut Teknologi Sepuluh Nopember Department of Maritime Studies
Hochschule Wismar, University of Applied Sciences
Submitted by:
ANTONNY SUHERI
NRP. 4213101007
Approved by,
The Head Department of Marine Engineering
APPROVAL FORM
CONCEPTUAL DESIGN OF MINI LNG SUPPLY CHAIN FOR POWER PLANTS IN WEST BORNEO
BACHELOR THESIS
Submitted to Comply One of the Requirements to Obtain a Bachelor of Engineering Degree
In
Double Degree Marine Engineering (DDME) Program Department of Marine Engineering – Faculty of Marine Technology
Institut Teknologi Sepuluh Nopember Department of Maritime Studies
Hochschule Wismar, University of Applied Sciences
Submitted by:
ANTONNY SUHERI
NRP. 4213101007
Approved by,
The Representative of Hochschule Wismar in Indonesia
DECLARATION OF HONOUR
I hereby who signed below declare that:
This thesis has been written and developed independently without any plagiarism act. All contents and ideas drawn directly from internal and external sources are indicated such as cited sources, literature, and other professional sources.
Name : ANTONNY SUHERI
Student ID Number : 4213101038
Thesis Title : Conceptual Design of Mini LNG Supply Chain for Power Plants in West Borneo
Department : Double Degree Program of Marine Engineering
If there is plagiarism act in the future, I will be fully responsible and receive the penalty given according to the regulation applied.
Surabaya, 31 July 2017
viii
ix
CONCEPTUAL DESIGN OF MINI LNG SUPPLY CHAIN FOR POWER PLANTS IN WEST BORNEO
Student Name : Antonny Suheri
NRP : 4213101007
Department : Double Degree Program of Marine Engineering
Supervisor : A.A.B Dinariyana DP, S.T., MES., Ph D
Co-Supervisor : Dr. I Made Ariana, S.T., M.T.
ABSTRACT
Majority of power plants in Khatulistiwa system West Borneo is diesel
power plants which has 448.3 MW. Based on
Rencana Operational Tahunan PLN
Kalbar,
Total consumption power plants for HFO is 62 million liters/year and total
consumption power plants for MFO is 272 million liters/year. To decrease the
demand of MFO and HFO in Indonesia, they can be replaced by Liquefied Natural
Gas by making use of LNG source in FSRU Lampung or Arun Gas Refinery which
has cargo resource about 0.6 MTPA.
On this research, it will be conceptual designed by selecting the most
optimal location for mini LNG infrastructure by 3 alternative locations: Siantan,
Pontianak and Offshore (Mini FSRU) & four alternatives LNG vaporizer
technology using elimination and choice expressing reality (ELECTRE) method. It
designs the conceptual of mini LNG supply chain for power plants in West Borneo
and determine the conceptual design in terms of economics.
The conceptual design result for the most optimal location of mini LNG
plant is in Siantan Regency. Technology of vaporizer is using submerged
combustion vaporizer (SCV) technology. The most feasible economics of plant is
using self-propelled LNG barge capacity 7500 m
3with round trip for one-year
operation is 49 times per year and using 25 storage tank capacity 300 m
3. The
most feasible economics investment is selling LNG with margin, $3.25 per MMBtu
(selling in price $10.25 per MMBtu) by source of LNG is in FSRU Lampung. The
Value of Net Present Value (NPV) is in amount of $1.520.574, Internal rate return
(IRR) is12,33% and payback period is ten years of operation.
x
xi
CONCEPTUAL DESIGN OF MINI LNG SUPPLY CHAIN FOR POWER PLANTS IN WEST BORNEO
Nama Mahasiswa : Juda Imanuel Osvaldo Panggabean
NRP : 4213 101 038
Jurusan : Teknik Sistem Perkapalan Program Double Degree
Pembimbing 1 : A.A.B Dinariyana DP, S.T., MES., Ph D Pembimbing 2 : Dr. I Made Ariana, S.T., M.T.
ABSTRAK
Mayoritas pembangkit di sistem Khatulistiwa Kalimantan Barat adalah
pembangkit tenaga diesel. Berdasarkan Rencana Operational Tahunan PLN Kalbar,
total konsumsi HFO seluruh pembangkit di sistem khatulistiwa adalah 62 juta liter per
tahun dan total konsumsi MFO adalah 272 juta liter per tahun. Untuk mengurangi
kebutuhan MFO dan HFO di Indonesia, pembangkit gas di sistem khatulistiwa dapat
diganti dengan menggunakan LNG dengan memanfaatkan kargo LNG di Arun atau
FSRU Lampung yang memiliki cadangan kargo sebesar 0.6 MTPA.
Pada penelitian ini, akan didesain konsep rantai pasok mini LNG di
Kalimantan Barat dengan memilih tiga alternatif lokasi yang paling optimal untuk
mini LNG plant: Kabupaten Siantan, Kota Pontianak, dan Mini FSRU (Offshore) &
memilih teknologi vaporizer yang paling tepat dengan menggunakan metode
elimination and choice expressing reality (Electre). Dengan menggunakan solver,
akan dikonsep rantai pasok mini LNG yang paling optimal dan akan menentukan
keekonomian konseptual design rantai pasok.
Hasil dari konseptual design rantai pasok mini LNG berupa lokasi yang
paling optimal untuk pembangunan mini LNG plant yaitu Kabupaten Siantan
dengan teknologi submerged combustion vaporizer. Dengan menghitung
keekonomian, maka konseptual design yang paling ekonomis adalah dengan
menggunakan kapal LNG tongkang ukuran 7500 m3 dengan round trip empat
puluh sembilan kali dalam setahun. Margin yang paling optimal dalam investasi
ini adalah sebesar $3.25 per mmbtudengan mengambil sumber LNG di FSRU
Lampung. Nilai NPV yang di dapat adalah $1.520.574, nilai IRR adalah 12,33%
dan Payback period selama 10 tahun operasi.
xii
xiii PREFACE
Alhamdulillahirobbil ‘alamin. Praise is merely to the Almighty Allah SWT for the gracious mercy and tremendous blessing which enables the author to accomplish this bachelor thesis.
This thesis report entitled “Conceptual design of mini LNG supply chain for power plants in West Borneo” is submitted to fulfill one of the requirements in accomplishing the bachelor degree program at Marine Engineering Department, Faculty of Marine Technology, Institut Teknologi Sepuluh Nopember Surabaya. Conducting this research study is not possible without all helps and supports from various parties. Therefore, the author would like to thank to all people who has support the author for accomplishing this bachelor thesis, among others:
1. First, to my parents, Mr. Erizal and Mrs. Yeni Sovia who always give their support, prayers, assistances and encouragements for every single path the author chooses. 2. Department of Marine Engineering Top Management who has guided and giving
path to do the bachelor thesis till finished
3. Mr. Ir. Dwi Priyanta, MSE as Double Degree of Marine Engineering Secretary who has advised provided beneficial advisory and motivation.
4. Mr. A.A. Bagus Dinariyana Dwi P., ST., MES., Ph.D as Author’s thesis supervisor and the Head of RAMS Laboratory who has provided huge advise as long as author writes this bachelor thesis and given permission to do activities inside the RAMS Laboratory. 5. Mr. Dr. I Made Ariana ST., MT as author’s lecturer advisor and author’s thesis co
-supervisor who has provided knowledge and motivation.
6. My beloved partner of my life Mrs. Flora Asri Wardianti who has given me everything.
7. All my best friends from ‘LEPAKERS’ who always keep author reminder to do the research and giving motivation: Ridho Azhari, Angga Rizky Pratama, Rio Chandra, Segara Ihsani, Akbar Nugroho Wicaksono, and Rianda Putra.
8. The friend of beloved ‘ULTRAS ANJ’ who always be with author to do the research: Suryo Panotogomo Abi Suroso (ME13), Thariq Arafatul Akbar (ME13), Leonardo Maruli Sitinjak (ME13)
10. All my friends particularly BARAKUDA 2013 who had help, cooperate, and support the author to do the bachelor thesis until finish.
11. All member of RAMS Laboratory who has helped me, given me support, and reminder me to do the bachelor thesis
12. Substantial numbers of unmentioned friends and parties for all the care, encouragement and moral support.
The author realizes that this bachelor thesis remains far away from perfect. Therefore, every constructive suggestion and idea from all parties is highly expected by author for this bachelor thesis correction and improvement in the future. Finally, may Allah SWT bestow His grace, contentment and blessings to all of us. Hopefully, this bachelor can be advantageous for all of us particularly for the readers.
xv
Table of Contents
APPROVAL FORM ... i
APPROVAL FORM ... iii
APPROVAL FORM ... v
DECLARATION OF HONOUR ... vii
ABSTRACT ... ix
PREFACE ... xiii
LIST OF FIGURES ... xix
LIST OF TABLES ... xxi
LIST OF GRAPHIC ... xxv
CHAPTER I INTRODUCTION ... 1
1.1Background ... 1
1.2 Statement of Problems ... 3
1.3 Research Limitation ... 4
1.4 Research Objectives ... 4
1.5 Research Benefits... 5
CHAPTER II LITERATURE REVIEW ... 7
2.1 Liquefied Natural Gas (LNG) ... 7
2.2 Mini LNG Supply Chain ... 8
2.2.3 LNG Carrier ... 11
2.2.4 LNG Transfer ... 13
2.2.5 LNG Receiving Terminal & Storage Tank ... 14
2.2.6 LNG Regasification Plant ... 16
2.3 Power Plants in West Borneo ... 19
2.3.1 LNG Demand for Power Plants ... 20
2.3.2 Alternative location for LNG Regasification Plant ... 21
2.4 Multi Criteria Decision Making (MCDM) ... 23
2.4.1 Elimination & Choice Expressing Reality (ELECTRE) ... 23
2.5 Linier Programming using Excel Solver ... 26
2.6 Economic Study ... 26
2.6.1 Net Present Value ... 26
2.6.2 Internal Rate Return ... 28
2.6.3 Payback Period ... 28
CHAPTER III METHODOLOGY ... 29
3.1 Problem Identification ... 30
3.2 Literature Study ... 30
xvi
3.6 Economic Feasibility Study ... 31
3.7 Conclusion ... 32
CHAPTER IV DATA ANALYSIS ... 33
4.1 Mini LNG Plant Location Selection ... 33
4.1.1 Alternative ... 33
4.1.2 Criteria ... 37
4.1.3 ELECTRE Implementation for Selection Plant Sitting Location ... 39
4.1.3.1 Validation Test ... 39
4.1.3.2 Preference and Weight Data ... 39
4.1.3.3 Data Analysis ... 41
4.2 LNG Vaporizer Selection ... 49
4.2.1 Alternative ... 49
4.2.3 ELECTRE Implementation for Selection LNG Vaporizer ... 53
4.2.3.1 Validation Test ... 53
4.2.3.2 Preference and Weight Data ... 54
4.2.3.3 Data Analysis ... 55
4.4.1 Optimization by Solver ... 66
4.3.2 Data Identification ... 66
4.3.3 Mathematics Model ... 73
4.3.4 Mathematics Model in Optimization Voyage ... 74
4.3.5 Optimization Model in FSRU Lampung ... 76
4.3.5.1 Optimization Voyage Trip ... 85
4.3.6Optimization Model in Arun Gas Refinery ... 86
4.3.6.1 Optimization Voyage Trip ... 88
4.3Economic Feasibility Study (Source in FSRU Lampung) ... 89
4.4.1 Capital Expenditure ... 89
4.4.2 Operational Expenditure ... 91
4.4.3 Investment cost for 25 years ... 98
4.4.4 LNG Cost in FSRU Lampung ... 102
4.4.5 Depresiation Asset... 104
4.4.6 Revenue ... 105
4.4.7 Cash Flow ... 106
4.4.8 PMT (Payment) ... 110
4.4.9 Economic Feasibility Study if LNG in FSRU Lampung is $7 per mmbtu ... 111
4.4.10 Economic Feasibility Study if LNG cost $ 6 per mmbtu ... 115
4.4Economic Feasibility Study (Source in ARUN Gas Refinery) ... 119
4.5.1 Capital Expenditure ... 119
4.4.2 Operational Expenditure ... 119
4.5.3 Investment Cost... 119
4.5.4 LNG Cost ... 119
xvii
4.5.6 Revenue ... 119
4.5.7 Cash Flow ... 119
4.5.8 PMT (Payment) ... 121
4.5.9 Economic Feasibility Study Arun ... 121
4.5.10 Economic Feasibility Study (Arun) if LNG cost is $ 6 per mmbtu ... 124
4.5.10 Data Recapitulation ... 127
4.5Economic Feasibility Study Comparison ... 128
4.6.1 Different LNG Price ... 128
4.5.2 Similar LNG Price ... 131
CHAPTER V CONCLUSION & SUGGESTION ... 135
5.1 Conclusion ... 135
5.2Suggestion ... 136
REFERENCES ... 137
Attachment A Quesioner Response ... 139
Attachment B Quesioner Tools ... 153
Attachment C Validation Test Result ... 173
Attachment D Electre Implementation for Selection LNG Vaporizer &
Location Criteria Combined ... 195
xviii
xix
LIST OF FIGURES
Figure 1.1. Projection of fuel oil supply-demand in Indonesia by PT. Pertamina.. 3
Figure 2. 1 LNG Physics ... 8 Figure 2. 2 Mini LNG Supply Chain & Distribution ... 9 Figure 2.3 FSRU Lampung ... 10 Figure 2.4 Arun Gas Refinery ... 10 Figure 2.5 Anthony Veder mini LNG carrier 6500 m3 ... 11 Figure 2.6 KOMTech Self Propeled LNG Barge 7500 m3 ... 12 Figure 2.7 Shore to Ship Cargo Transfer by Loading Arm ... 13 Figure 2.8 Ship to Ship Cargo Transfer by Loading Arm ... 14 Figure 2.9 LNG Receiving Terminal and Storage Tank ... 15 Figure 2.10 Horizontal & Vertical LNG storage tank ... 15 Figure 2.11 Open Rack Vaporizer Flow Scheme ... 16 Figure 2.12 Submerged Combustion Vaporizer Flow Scheme ... 17 Figure 2.13 Ambient Air Vaporizer Flow Scheme ... 18 Figure 2.14 Glycol-water Intermediate Fluid Vaporizer – Glycol Water ... 19 Figure 2.15 PLTG Siantan ... 20 Figure 2.16 PLTG MPP Jungkat 100 MW ... 21 Figure 2.17 Alternative location 1 (Regency of Siantan) ... 21 Figure 2.18 Alternative location 2 (Pontianak City) ... 22 Figure 2.19 Alternative location 3 (Offshore with Mini FSRU)... 23 Figure 2. 20 NPV Profile ... 27
Figure.3.1 Flowchart Methodology ... 29 Figure.3.2 Flow Chart Methodology Continue ... 30
xx
xxi LIST OF TABLES
Table 1.1 Projection of Khatulistiwa System in West Borneo ... 1 Table 1.2 Projection of Power Plants HFO and MFO Consumption ... 2 Table 1.3 Projection of economic growth in west Borneo... 2
Table 2.1 Advantage & Disadvantage Mini LNG Carrier & SPB LNG ... 12 Table 2.2 LNG Demand for Power Plants ... 20
Table 4.1 Disadvantages & Advantages Location in Siantan Regency ... 33 Table 4.2 Disadvantages & Advantages of location in Pontianak City ... 35 Table 4.3 Disadvantages & Advantages location in Siantan Regency ... 36 Table 4.4 Criteria of Location Selection ... 37 Table 4.5 Value of Likert Scale in Preference... 40 Table 4.6 Value of likert Scale in Weight ... 40 Table 4.7 Preference of Criteria Value of Location Selection ... 41 Table 4. 8 Value of Normalize of Location Selection ... 42 Table 4.9 Weight Matriks Normalize Value ... 43 Table 4.10 Value of Difference Absolute ... 43 Table 4.11 Concordances and Disordances a1 to a2 ... 44
Table 4.12 Concordances and Disordances a1 to a3 ... 45
Table 4.13 Concordances and Disordances a2 to a3 ... 45
xxii
Table 4.32 Concordances and Discordances Value a1 to a3 and a3 to a1 ... 59
Table 4.33 Concordances and Discordances Value a1 to a4 and a4 to a1 ... 59
Table 4.34 Concordances and Discordances Value a2 to a3 and a3 to a3 ... 60
Table 4.35 Concordances and Discordances Value a2 to a4 and a4 to a2 ... 61
Table 4.36 Concordances and Discordances Value a3 to a4 and a4 to a3 ... 61
xxiii
xxiv
xxv LIST OF GRAPHIC
xxvi
1
CHAPTER I INTRODUCTION
1.1Background
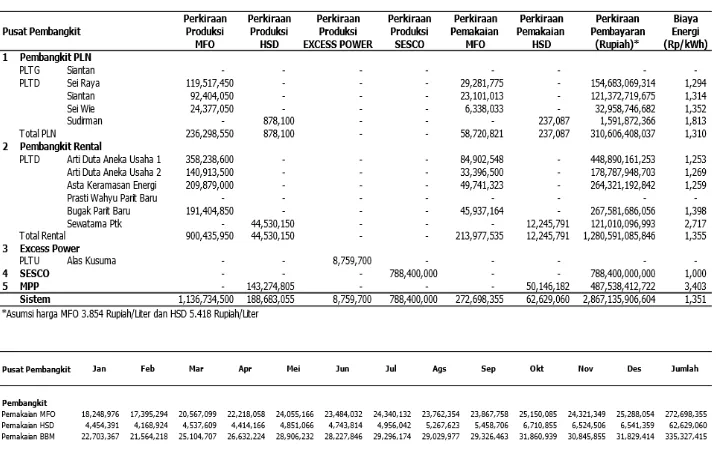
Based on Rencana Operational Tahunan (ROT) PLN Kalimantan Barat 2017, total power plants in Khatulistiwa system of West Borneo is 448.3 MW. Khatulistiwa system is power plants from Pontianak to Sambas which mostly constituted by diesel power plants and the other is gas power plants. Khatulistiwa system power plants are divided into 195.8 MW of PLN power plants, 162.5 MW in Rent Power Plant, 90 MW in SESCO and 1 MW in excess power. The power peak of Khatulistiwa system is shown in table 1.1 below, (Cahya, 2017)
Table 1.1 Projection of Khatulistiwa System in West Borneo (Cahya, 2017)
Table 1.2 Projection of Power Plants HFO and MFO Consumption (Cahya, 2017)
Mean economic growth and inhabitant growth in West Borneo until 2025 is 6.8%, meanwhile power peak growth in West Borneo is 10.9%. Based on this data, in 2025, power peak in West Borneo will increase about 1053 MW. Detail of the economic and inhabitant growth in West Borneo is shown in Table 1.3 below,
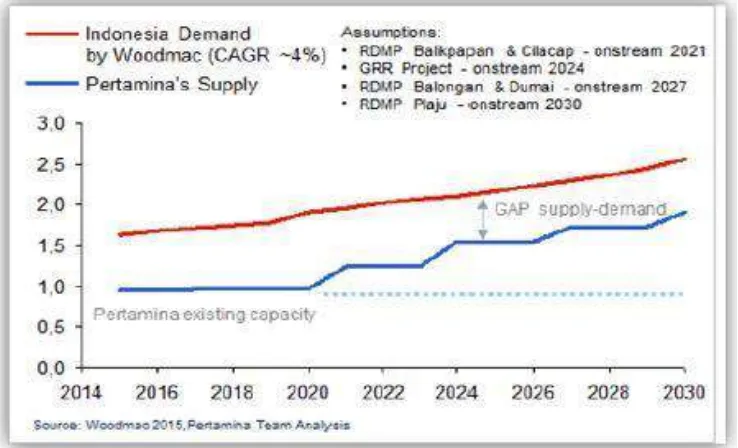
The projection of power peak growth in West Borneo will increase the gap of oil demand from PT. Pertamina as the only institution that responsible to supply & distribute diesel oil to meet the demand in the Republic of Indonesia. It will impact PT. Pertamina import of fuel oil from foreign country. The gap of diesel oil (Figure 1.1) supply-demand of PT. Pertamina (Persero) will be shown below.
Figure 1.1. Projection of fuel oil supply-demand in Indonesia by PT. Pertamina . (Pertamina, 2015)
The projection of fuel oil supply-demand by PT. Pertamina (Persero) still having a gap in supply-demand until 2030. This fact is supported by the RUPTL PLN program to develop gas power plant than diesel power plant. From 2016 to 2025, power plants development in Indonesia will be focused on developing gas power plant (PLTG) and Gas Steam Power Plants (PLTGU) to replace diesel power plants using HSD and MFO. The total amount of power plant development until 2025 is 3016 MW for PLTG and 4092 for PLTGU, while there are no developments for diesel power plant until 2025 (Anon., 2016). In this research, conceptual design of mini LNG supply chain for Gas Power Plants in West Borneo (PLTG Siantan and MPP Jungkat) to replace HSD become LNG as a source of energy is offered.
Regarding to background of research, several points of problem statements are identified as follows,
1. How to determine the location of receiving terminal & technology selection of LNG Vaporizer?
2. How to design the concept of mini LNG supply chain in West Borneo with three alternatives of Self Propelled Barge (SPB) LNG capacity?
3. How is the conceptual design in terms of economic?
1.3 Research Limitation
Research Limitations of this study are explained as follows,
1. Design of LNG Receiving Terminal and LNG plant are assumed by three alternative locations in West Borneo: Pontianak City, Siantan regency, and Offshore (mini FSRU).
2. LNG resource is Arun Gas Refinery and FSRU Lampung only. 3. LNG carrier capacity are 7500 m3, 10000 m3, and 12000 m3.
4. LNG regasification technology Selection alternatives are Ambient Air Vaporizer (AAV), Submerged combustion Vaporizer (SCV), Intermediate Fluid Vaporizer (IFV), and Open Rack Vaporizer (ORV).
1.4 Research Objectives
Several objectives of this research are:
1. To select the most optimum location of LNG Receiving Terminal & LNG regasification plant.
2. To design mini LNG supply chain concept in West Borneo by three alternatives of LNG carrier capacity and support components of LNG supply chain components.
1.5 Research Benefits
Several benefits of this research are:
1. To give the concept of ELECTRE method implementation for decision-making progress on the most optimal location of receiving terminal & mini LNG regasification plant technology in West Borneo, Indonesia. 2. To give optimum conceptual design of mini LNG supply chain for power
plants in West Borneo Indonesia and support components of mini LNG supply chain.
7
CHAPTER II LITERATURE REVIEW
2.1 Liquefied Natural Gas (LNG)
Liquefied natural gas is one of the clean and efficient energy which has lower emmission than fuel oil. Compare to fuel oil, LNG has lower emmission of 25% carbon dioxide emissions, 90% nitrogen emissions and 100% reduction in Sulphur. The volume of natural gas in the gas form compare to Liquefied Natural Gas is 1:600. So, in LNG supply chain from natural gas reserve to power plants, natural gas has different cargo handling because natural gas must be liquefied into -162o celcius for maximum volume in the cargo.
Otherwise for power plants, natural gas is consumed in the gas form.
In the physical condition, LNG is colorless, odorless, toxic, and non-corrosive. It can be flammable if it evaporates and contact with ignition source when the amount of gas in the air is between 5% to 15%. If vapor cloud does ignite, the flame speed is slow, namely 3-4 m/s. It means in open space, LNG doesn’t explode. LNG is also doesn’t pollute soil or groundwater. In open spaces LNG evaporates pretty quick without leaving any residue on water or soil. The density of LNG is 450 kg/m3. The maximum transport
pressure is 4 psi or 25 kPa. Natural gas dominantly consists of methane (CH4), the simplest hydrocarbon compound. Typically, LNG is 85 to 95-plus percent methane, along with little amount of ethane, even less propane and butane, and trace amounts of nitrogen (Figure 2. 1) (Laboratory, 2005)
Figure 2. 1 LNG Physics (Laboratory, 2005)
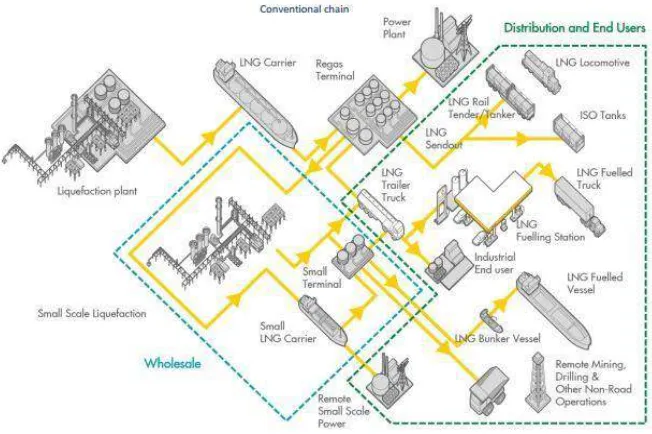
2.2 Mini LNG Supply Chain
Figure 2. 2 Mini LNG Supply Chain & Distribution (Union, 2015)
2.2.1FSRU Lampung
Figure 2.3 FSRU Lampung (Tatit, 2014)
2.2.2Arun Gas Refinery
Arun Gas Refinery is 800 nm from Pontianak with 6 LNG Plant, total capacity of 12.5 MTPA with 5 LNG Storage Tank, total capacity of 636000 m3 and 2 LNG
Jetty 80000 DWT. Arun LNG plant covers an area of 271 ha, located in Blang Lancang-Lhokseumawe and 30 km from Arun gas field in Lhoksukon. Natural gas resource contained in reservoir is estimated at 18 trillion ft3, Natural gas will be
processed or distributed in six natural gas liquefaction trains, but with the content of natural gas now dwindling, PT. Arun only operating four LNG trains with area of 92.5 km2.
2.2.3LNG Carrier
2.2.3.1 Mini LNG Carrier
LNG carrier installs cargo handling system which has function to chill LNG to become liquid in the temperature of -160o celcius. On propulsion system, LNG
carrier installing gas turbine as a primary mover. LNG in cryogenic tank will release boil off gas (BOG) because temperature is increasing in the tank. The total of boil off gas release is 0.15% per day. So, gas turbine is installed as a prime mover because gas turbine can use boil off gas as additional energy and efficient energy. On LNG containment system, LNG carrier is divided based on IGC code into two: independent tank and integrated tank. Independent tank is LNG tank which is separated from hull structure of LNG carrier while Integrated tank is combined with hull structure. Independent tank is IHI-SPB tank and Moss Spherical Tank, while integrated tank is GTT tank. Mini LNG carrier cargo capacity today is divided into: Shinju Maru (2500 m3), Anthony Veder (6500 m3), Coral
Methane (7500 m3) Norgas (10000 m3), etc.
Figure 2.5 Anthony Veder mini LNG carrier 6500 m3 (Shipbuilding, 2013)
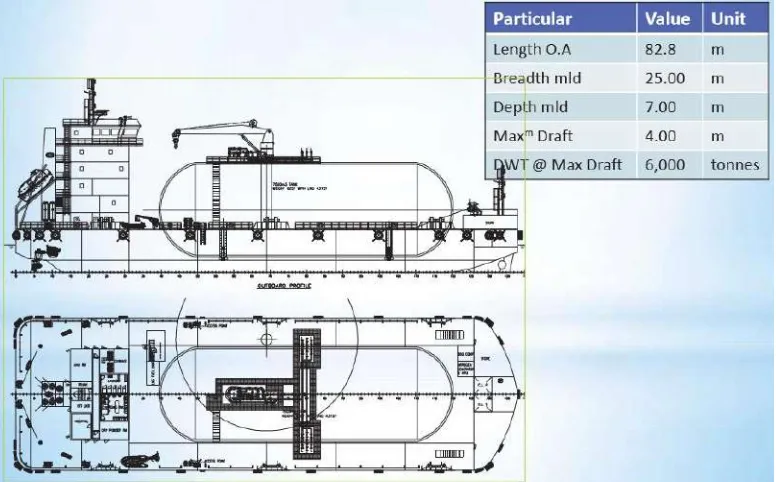
2.2.3.2 SPB LNG Barge
Figure 2.6 KOMTech Self Propeled LNG Barge 7500 m3 (Bashar, 2014)
2.2.2.3 Mini LNG carrier & SPB LNG Comparison
Mini LNG carrier and SPB LNG barge have several advantages and disadvantages as LNG carrier. Mini LNG carrier has deeper draft than SPB LNG which make Mini LNG carrier cannot sail in shallow water. While Mini LNG carrier has offloading system for ship-to-ship cargo transfer. SPB LNG barge has no boil off gas systtem release. SPB LNG uses skid tank separated from LNG carrier hull which means that SPB LNG has to install unloading system for ship-to-ship cargo transfer. Table 2.1 shows advantages and disadvantages of Mini LNG carrier & SPB LNG.
Table 2.1 Advantage & Disadvantage Mini LNG Carrier & SPB LNG (Satria, 2015)
Mini LNG Carrier Self Propelled LNG Barge Support BOG Release Doesnt Support BOG Release Support Unloading System Doesnt Support Unloding System Draft for Deep Water Draft for Shallow Water
Higher cost Investment Lower cost Investment
2.2.4LNG Transfer
LNG transfer is an activity of loading and unloading LNG by ship. LNG transfer is divided into two, namely ship-to-ship cargo transfer and loading arm.
1. Shore to Ship Cargo Transfer
Shore to ship cargo transfer uses mooring system for berthing in terminal. When ship is in receiving terminal, LNG carrier will receive cargo from onshore through loading arm. Loading arm is using a system which will connect to connecting shore. After connecting, then LNG can be flowed to LNG carrier. Loading arm is equipped with penumatic & hydraulic system as a fluid mover thus loading arm can be moved automatically. Safety system on loading arm is using Emergency Shutdown (ESD) system. This system is used when there is any movement of loading arm & connecting shore which will potentially create a leakage.
Figure 2.7 Shore to Ship Cargo Transfer by Loading Arm (KlawLNG, 2017)
2. Ship to Ship Cargo transfer
Figure 2.8 Ship to Ship Cargo Transfer by Loading Arm (KlawLNG, 2017)
The latest flexible hose technology is created from dyneema fiber. This technology claims as the strongest fiber in the world, where fifteen times stronger than iron and has lower weight than water. This flexible hose can be used in extreme area or weather while conducting ship-to-ship cargo transfer between ships. This technology has also higer reliability than flexible hose. This flexible hose is completed by leakage monitoring system, quick connect/disconnect structure, and has higher time efficiency in LNG transfer operational. (Satria, 2015)
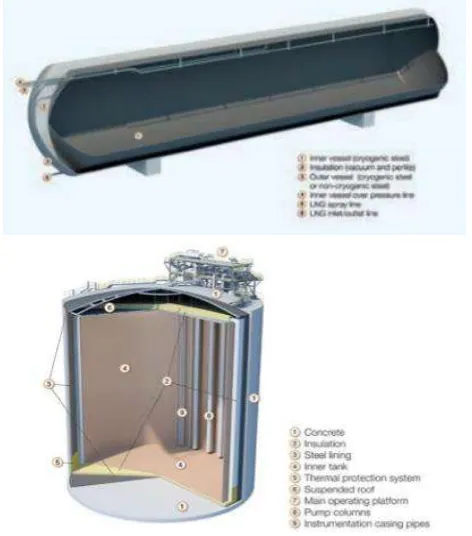
2.2.5 LNG Receiving Terminal & Storage Tank
LNG receiving terminal (Figure 2.9) is a facility which functions to receive and store LNG and have facility to send out rate to end user. Location of receiving terminal must be safe, secure, have access to the sea, and enough space for ship to berth in terminal. If it is not enough for ship berthing because of the draft, then receiving terminal should install trestle or catwalk in the terminal to keep the draft sufficient for ship. Local terminal has a storage tank size of 100–20000 m3, and located by the sea shore or river. The storage is built
Figure 2.9 LNG Receiving Terminal and Storage Tank (Wartsila, 2016)
Based on wartsila LNG solutions 2016, LNG storage tank is made from cryogenic material which can maintain the temperature (-160o celcius) of LNG.
LNG storage tank is divided into vertical and horizontal tank. Vertical tank (Figure 2.14) has characteristics of small footprint, heavy foundations, and size up to approximately 300 m3 in wartsila project guide. While horizontal tank
(Figure 2.15) has characteristics of large footprint and light foundations and approximately has 1200 m3 in wartsila project guide. (Wartsila, 2016)
2.2.6 LNG Regasification Plant
There are four types of regasification classified according to the media.
2.2.6.1 Open Rack Vaporizer (ORV)
Open Rack Vaporizer (ORV) is a heat exchanger which uses seawater as source of heat. The proper seawater temperature for ORV operation is above 5° Celsius. ORV units are generally constructed of aluminum alloy for mechanical strength suitable to operate at cryogenic temperature. The material has high thermal conductivity which is effective for heat transfer equipment. The tubes are arranged in panels, connected through the LNG inlet and the re-gasified product outlet piping manifolds and hung from a rack (Figure 2.11). For large regasification terminals where significant amounts of water are required, in-depth evaluation and assessment of the seawater system must be performed. Often, late design changes are very difficult and costly to be implemented, thereby, the key issues and design parameter must be established early in the project, such as seawater quality for operating an ORV system, seawater containing significant amounts of another particle (Metal, Sand, etc), proper seawater intake filtration system must be designed to prevent silts, sands and sea life from reaching the seawater pumps and exchangers. (Patel, 2013)
Figure 2.11 Open Rack Vaporizer Flow Scheme (Patel, 2013)
2.2.6.2 Submerged Combustion Vaporizers (SCV)
always maintained at a constant temperature and has high thermal capacity, the system copes very well with sudden load changes and can be quickly started and stopped. The bath water is acidic as the combustion gas products (CO2) are
condensed in the water. Caustic chemical such as sodium carbonate and sodium bicarbonate can be added to the bath water to control the pH value and to protect the tubes against corrosion. The excessive combustion water must be neutralized before being discharged to the open water.
To minimize NOx emissions, low NOx burners can be used to meet the 40 ppm NOx limit. NOx level can be further reduced by using Selective Catalytic Reduction (SCR) system to meet the 5-ppm specification if more stringent emission requirements is needed, at a significant cost impact. SCV unit is a trusted equipment and is very reliable with very good safety records. Leakage of gas can be quickly detected by hydrocarbon detectors which will result in a plant shutdown. There is no danger of explosion, since the temperature of the water bath always stays below the ignition point of natural gas. The controls for the submerged combustion vaporizers are more complex compare to the open rack vaporizers (ORV). SCV has more instruments, such as the air blow, sparking piping and burner management system which must be maintained. SCVs are compact and do not require much plot area compare to the other vaporizer options. (Patel, 2013)
Figure 2.12 Submerged Combustion Vaporizer Flow Scheme (Patel, 2013)
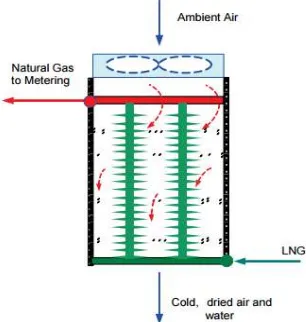
2.2.6.3 Ambient Ai Vaporizer (AAV)
vertical heat exchange tubes that facilitate downward air draft. This is due to the warmer, less dense air at the top being lighter than the cold, denser air at the bottom. Ambient air vaporizers utilize air in a natural or forced draft vertical arrangement. Water condensation and melting ice can also be collected and used as a source of service/potable water. To avoid dense ice buildup on the surface of the heat exchanger tubes, deicing or defrosting with a 4-8-hour cycle is typically required. Long operating cycles lead to dense ice on the exchanger tubes, requiring longer defrosting time. Defrosting requires the exchanger to be placed on standby mode, and can be completed by natural draft convection or force draft air fans. The use of force draft fans can reduce the defrosting time but would require additional fan horsepower. The reduction in defrosting time is typically insignificant as the heat transfer is limited by the ice layers which act as an insulator.
Fog around the vaporizer areas can pose visibility problem, which is generated by condensation of the moist air outside. The extent of fog formation depends on many factors, such as the separated distances among units, wind conditions, relative humidity and ambient temperatures. The performance of ambient air vaporizers depends on the LNG inlet and outlet conditions and more importantly, site conditions and environment factors, such ambient temperature, relative humidity, altitude, wind, solar radiation, and proximity to adjacent structures. Ambient air heater is advantageous in hot climate equatorial regions where ambient temperature is high all round. (Patel, 2013)
Figure 2.13 Ambient Air Vaporizer Flow Scheme (Patel, 2013)
2.2.6.4 Intermediate Fluid Vaporizer – Glycol Water (IFV)
utilized for LNG vaporization is Glycol-Water. This system typically uses glycol-water as an intermediate heat transfer fluid (Figure 2.14). Heat transfer for LNG vaporization occurs
in a shell and tube exchanger. Warm glycol-water flows through the intermediate fluid vaporizers where it rejects heat to vaporize LNG. These glycol-water IFVs are very compact exchangers (vertical shell and tube design) due to the high heat transfer coefficients and large temperature approach. Some of the operating plants utilize air heater and reverse cooling tower as the source of heat. There are several options to warm the glycol-water solution prior to recycling it back into the shell and tube LNG vaporizers, such as air heater, reverse cooling tower, seawater heater and waste heat recovery system or fired heater.
Using air for heating will generate water condensate, especially in the equatorial regions. The water condensate is rain water quality which can be collected and purified for in-plant water usage and/or exported as fresh raw water. With the use of intermediate fluid such as glycol-water, the glycol temperature can be controlled at above water freezing temperature, hence avoiding the icing problems. Similarly, reverse cooling tower design, which extracts ambient heat by direct contact with cooling water via sensible heat and water condensation, will require an intermediate fluid. The heat of the cooling water can be transferred to the intermediate fluid by a heat exchange coil. Seawater may also be used. However, the use of seawater is more prone to exchanger fouling, and the exchanger (plate and frame type) need to be cleansed periodically. The plate and frame exchangers are very compact and low in cost. Typically, spare seawater exchangers are provided for this option. (Patel, 2013)
Figure 2.14 Glycol-water Intermediate Fluid Vaporizer – Glycol Water (Patel, 2013)
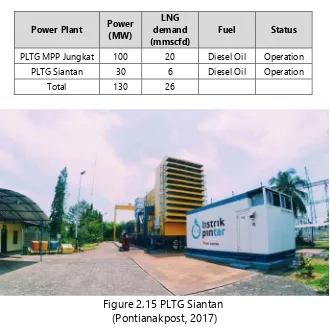
2.3 Power Plants in West Borneo
convert from consume diesel oil to become LNG. The total power of power plant is 130 MW while the amount of LNG demand is 16 mmscfd. So, total of LNG demand to supply 130 MW power plants is 0.180 MTPA per year.
2.3.1 LNG Demand for Power Plants
Gas power plants in Khatulistiwa System as follows still consume diesel oil as source of energy that will be changed with LNG in amount of 26 mmscfd. Power plants which will be supplied is PLTG Siantan in amount of 30 mw, and MPP Jungkat Parit Baru for 100 MW. West Kalimantan population growth of 6.8% per year make the government start to convert plants into fuel gas. In addition, the government program to build gas-fired power generation and steam power in anticipation of peak loads increasing from year to year.
Table 2.2 LNG Demand for Power Plants (Cahya, 2017)
Power Plant Power (MW)
LNG demand (mmscfd)
Fuel Status
PLTG MPP Jungkat 100 20 Diesel Oil Operation
PLTG Siantan 30 6 Diesel Oil Operation Total 130 26
Figure 2.16 PLTG MPP Jungkat 100 MW (Pontianakpost, 2017)
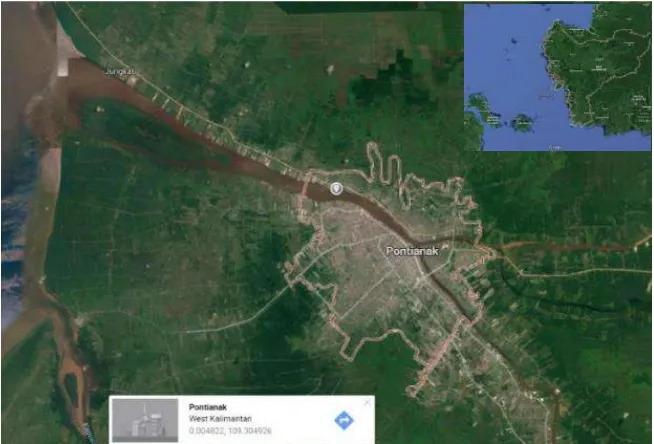
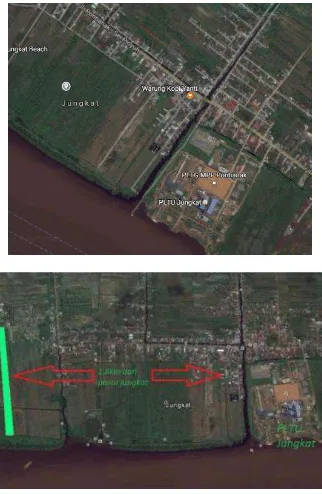
2.3.2Alternative location for LNG Regasification Plant
2.3.2.1 Regency of Siantan
First Alternative location for LNG regasification Plant is Siantan. Siantan is located in the coordinate of 0.0548460 S, 109.204387o E, located in north of
Pontianak city. This city is passed by Kapuas river and the location of Pontianak city is shown in Figure 2.17.
Figure 2.17
2.3.2.2 City of Pontianak
Second Alternative location for LNG regasification Plant is Pontianak. Pontianak is located in the coordinate of 0.0048220 S, 109.304926o E which has
area of 107,82 km2. This city also passed by Kapuas river and location of Pontianak
city is shown in Figure 2.18.
Figure 2.18 Alternative location 2 (Pontianak City)
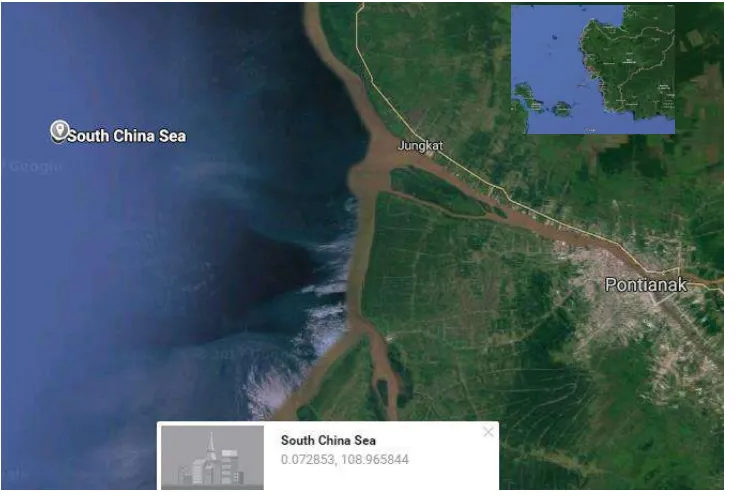
2.3.2.3 Offshore (Mini FSRU)
Figure 2.19 Alternative location 3 (Offshore with Mini FSRU)
2.4 Multi Criteria Decision Making (MCDM)
Multicriteria decision-making is a decision-making method to establish the best alternative from several alternatives based on certain criteria. Criteria are usually in the form of measures, rules or standards used in decision making. Based on its aim, multicriteria decision-making can be divided into two models, namely multi attribute decision-making and multi objective decision-making. Multi attribute decision-making is used to solve problems in discrete space. Therefore, these models are typically used to conduct the assessment or selection of some alternatives in limited quantities. While the multi objective decision-making is used to solve problems in continuous space. In this case, multi criteria decision-making method is Elimination and Choice Expressing Reality (Electre). (Syeril Aksheraeri, 2016)
2.4.1Elimination & Choice Expressing Reality (ELECTRE)
alternative is said to dominate the other alternatives if one or more criterias exceed (compared to the other alternative criteria) and same with the other remaining criteria. The steps undertaken in problem solving using ELECTRE method is as follows:
1. Normalized decision matrix
In this procedure, each attribute is converted into comparable value. Any normalization of the values xij can be done by formula
𝑥𝑖𝑗
√∑𝑚 𝑥𝑖𝑗2 𝑖=1
for i = 1,2,3,.... m and j = 1,2,3... n (2.1)
so, the normalized results obtained matrix R,
R =
𝑟11 𝑟12 𝑟1𝑛
𝑟21 𝑟22 𝑟2𝑛
𝑟𝑚1 𝑟𝑚2 𝑟𝑟𝑚𝑛
(2.2)
R is a matrix that has been normalized, where m stated alternatives, n is the stated criteria and rij is the normalized measurement of the alternative choices to-i in conjunction with the criteria for all j.
2. Weighted normalized matrix
Once normalized, each column of the matrix R is multiplied by the weights (wj) determined by the decision maker. Thus, the weighted normalized matrix is V = W.R written as:
V = R x W 𝑣11 𝑣12 𝑣1𝑛
𝑣21 𝑣22 𝑣2𝑛 𝑣𝑚1 𝑣𝑚2 𝑣𝑚𝑛 =
𝑤1𝑟11 𝑤2𝑟12 𝑤𝑛𝑟1𝑛 𝑤1𝑟21 𝑤2𝑟22 𝑤𝑛𝑟2𝑛 𝑤1𝑟𝑚1 𝑤2𝑟𝑚2 𝑤𝑛𝑟𝑚𝑛
(2.3)
where W is
w =
𝑤1 0 0
0 𝑤2 0
0 0 𝑤𝑛
(2.4)
3. Determine the set of concordances and discordances index
For each pair of alternatives k and l (k, l = 1,2,3, ..., m and k ≠ l) A set of criteria is divided into two subsets, namely concordance and discordance. Alternative criteria is included in concordance if: Ckl = { j, vkj >= vij}. Instead, complementary
subsets of concordance is set discordance, namely when Dkl = { j, vkj < vij}.
a. Calculating the matrix concordance
To determine the value of the elements in the matrix concordance is by adding weights included in the set of concordances, in mathematical is as follows:
Ckl = ∑ 𝐶𝑘𝑙𝑗𝑒 (2.5)
b. Calculating the matrix discordances
To determine the value of the elements in the matrix discordances is by dividing the maximum difference of criteria that included into subsets discordances with a maximum difference of the value of all the criteria, it mathematically written as follows:
dkl = max{|𝑣𝑘𝑗 − 𝑣𝑖𝑗|}
max{|𝑣𝑘𝑗− 𝑣𝑖𝑗 |} (2.6)
5. Determine the dominant matrix of concordance and discordances
a. Calculating the dominant matrix concordance
The matrix F as the dominant matrix concordance can be built with the help of threshold value, by comparing the value of each matrix element concordance with the threshold value.
c = ∑𝑚𝑘=1∑𝑚𝑖=1𝑐𝑘𝑙
𝑚 (𝑚−1 ) (2.7)
so, that the elements of matrix F are determined as follow:
fkl = {0,𝑖𝑓 𝑐1,𝑖𝑓 𝑐𝑘𝑙≥𝑐
𝑘𝑙<𝑐 (2.8)
b. Calculating the dominant matrix concordance
Matrix G as the dominant matrix can be built with the help discordance threshold value:
d = ∑𝑚𝑘=1∑𝑚𝑖=1𝑑𝑘𝑙
𝑚 (𝑚−1) (2.9)
and elements of matrix G is determined as follows:
gkl = {1,𝑖𝑓 𝑑0,𝑖𝑓 𝑑𝑘𝑙≥𝑐
𝑘𝑙<𝑐 (2.10)
6. Determine aggregate dominance matrix
Matrix E as aggregate dominance matrix is a matrix which each element is the multiplication between matrix element F with the corresponding elements of matrix G, mathematically expressed as:
Ekl = fkl x gkl (2.11)
Matrix E gives the preferred order of each alternative, if the alternative Ak is the better alternative than Al. Thus, the line in matrix E which has the least number can be eliminated. Thus, the best alternative is an alternative that dominates other alternatives. (Syeril Aksheraeri, 2016)
2.5 Linier Programming using Excel Solver
Solver is provided by MS Excel as a tool to find the optimal value in a formula in an Excel worksheet cell (or so-called target cells). The expected value can be the maximum value, minimum value or a specific value. Microsoft Excel application program has multiple devices (add-in) that can be used for data analysis process. They are add-ins that are used to solve simple to complex cases in a Microsoft Excel worksheet. Solver can calculate the value needed to achieve the results set forth in other cells. In other words, the solver can handle problems involving many variables cells and to help find a combination of variables to minimize or maximize the value of the target cell. Mathematical modeling in solver consists of input, decision variables, constraints and objectives. These factors will then be processed in the set of equations. Solver is part of a sequence of commands that are interconnected directly or indirectly in a group of the formula in a target cell.
Solver program will produce three reports: answer, sensitive and limit. Answer report presents answers on issues that are processed, including objective function, constraints and decision variables. Limits report tells how much the values of cells variables can be raised or lowered without exceeding the specified limits. For each variable, the report defines the optimal value also the lowest and highest value that can be used without violating the restrictions that have been determined. Sensitivity report contains information on the target cell sensitivity or sensitivity to change in the approved limits. Sensitivity analysis is conducted to determine the effect of data changing, which is based on the limits to get the expected values.
2.6 Economic Study
Economics Study is done to measure investment value that will give us the rate of financial profit or loss. The parameters used in measuring profit/loss in this research include Net Present Value (NPV), Internal Rate of Return (IRR), and Payback Period (PP).
2.6.1 Net Present Value
criterion for selecting projects consistent with the financial objective of maximizing the shareholders’ wealth. When using NPV criterion for evaluating project, we need to pay attention to the following aspects:
• All relevant and related cash flows of a project should be included in the computation of its NPV
• The project’s NPV reflects its contribution to the present value • The NPV of a project is inversely related to its discount rate
• The required of rate return used to discount a project’s cash flows should reflect the project’s cost capital and risk
Net Present Value of a project can be expressed as:
NPV = ∑ 𝑏𝑡−𝑐𝑡 (1+𝑖)2
𝑛
𝑡=0 (2.12)
where:
• NPV = Net Present Value of the project • Bt = benefit to be received in period t
• Ct = (After Tax) Cash Flow to be received in period t
• n = The number of total periods for discounting life of project • 1/(1+i) = The discount rate (i.e required rate of return)
• t = The number of period during which the discounting occurs
NPV of project is inversely related to the discount rate or the required rate of return on investment. A sketch of relationship associated with a project based on different discount rates is referred to as project’s NPV profile, shown in Figure 2.20. (Dewangga, 2016)
2.6.2 Internal Rate Return
Intenal Rate Return (IRR) criterion is an evaluation approach which is very similar with NPV method discussed in the previous section. It also discounts the cash inflows and cash outflows of the project.
The main difference between NPV and IRR approaches is that the latter discounts project’s cash flows at a rate so as to equate the present value of cash inflows to the present value of the cash outflows, that is IRR approach sets a precondition so when the project’s NPV equals zero, the discount rate used to discount the project’s cash flows is equal to its internal rate of return. A project is feasible economically if IRR is higher than the capital cost plus risk premium of the project plus benefit; as shown in the formula:
IRR = i1 + 𝑛𝑝𝑣1
𝑛𝑝𝑣1− 𝑛𝑝𝑣2 (i1 - i2) (2.13)
where,
IRR = Internal Rate Return of the project i1 = Discount rate to produce positive NPV
i2 = Discount rate to produce negative NPV
NPV1 = NPV Positive
NPV2 = NPV mg
2.6.3 Payback Period
Payback Period criterion is an evaluation approach to compare the initial cash outlay with the subsequent annual cash inflows of the project in order to determine the number of years needed to recover the initial investment. Under this approach the shorter the payback period, the more attractive the project. The decision criterion is to accept a project if its payback period is not longer than the maximum tolerable period, which is arbitrarily decided by the firm.
PP = (n - x) + (-b/c) (2.14)
where:
PP = Payback period
n = year where cash flow couldnt complete the first investment x = time to build the ship (year).
29
CHAPTER III METHODOLOGY
Figure.3.2 Flow Chart Methodology Continue
This research is done by structural process which is implemented as in the process flowchart. The sequence in this research is shown by topic conceptual design of mini LNG supply chain for power plants in West Borneo.
3.1 Problem Identification
The problem is identified by observation study in the Rencana Operasional Tahunan (ROT) PLN Kalimantan Barat 2017, finding information from journal & e-books in the internet, and reading statistics report from RUPTL PLN 2016 - 2025. In this research, the problem that will be analyzed is how to design the most optimal mini LNG supply chain and determine the conceptual design in terms of economic.
Literature Study is conducted to learn the material related to this research. On this sequence, related literature on the research topic include internet, books, journal, paper, report and project guide. Thus, literature study provides information data to solve the problem. In this research, literature study is related to Mini LNG supply chain components, Elimination and Choice Expressing Reality (Electre), LNG Technology, Linier Programming by using excel solver, and economic feasibilitythis research, the study literatures are related to the Mini LNG supply chain components, Elimination and choice expressing reality (Electre), LNG Technology, Linier Programming by using excel solver, and economic feasibility study.
3.3 Data Collection
Data collection is used as the object to analyze. In this research, there are several necessary data such as geographic data of location selection in Siantan, Pontianak. LNG Vaporizer technology, mini LNG supply chain components project guide. The data are collected from survey activity on the location for quality results or in the journal, books, paper, and internet for quantity results.
3.4 Plant Sitting Location & LNG Vaporizer Selection
Plant sitting sitting are located in West Borneo specifically at three location: Siantan Regency, Pontianak City, and Offshore (Mini FSRU). While LNG Vaporizer technology alternatives include Ambient Air Vaporizer (AAV), Open Rack Vaporizer (ORV), Intermediate Fluid Vaporizer (IFV), and Submerged Combustion Vaporizer (SCV). Data analysis will be conducted by Multi Criteria Decision Making (MCDM) using Electre Method. The process of decision making is to process the plant sitting location and LNG Vaporizer paralelly.
3.5 Optimization Self Propelled LNG Barge & LNG Storage Tank
Self-propelled LNG barge capacity alternatives are SPB LNG 7500 m3, SPB
LNG 10000 m3, and SPB LNg 12000 m3. While the storage tank alternatives are
using LNG storage tank capacity of 100 m3, 150 m3, and 300 m3. Data analysis is
conducted by using linier programming (solver) to get output of capacity & number of asset and minimum investment.
3.6 Economic Feasibility Study
3.7 Conclusion
33
CHAPTER IV DATA ANALYSIS
This chapter provides the analyzed data based on problem statement in chapter I. In summary, there are three points that will be analyzed in this chapter, namely: 1. Selection of location for mini LNG plant in West Borneo and LNG Vaporizer
technology by ELECTRE method.
2. Design Conceptual of mini LNG supply chain components by determining three Self Propelled LNG Barge to optimize capacity of LNG Storage tank, LNG vaporizer, LNG Pump, and other support components.
3. To analyze conceptual design in terms of economic feasibility study.
Regarding to the points, the sequence of data analyze is conducted as below:
4.1 Mini LNG Plant Location Selection
4.1.1Alternative
Three alternatives of LNG location selection that will be evaluated include Siantan Recency, Pontianak City, Offshore (Mini FSRU). Table 4.2 below explains the subjective judgement to the attribute preferences accoding to the survey discussion, information, literature and engineering judgement explained below.
1. Alternative 1 – Siantan Regency
Kabupaten Siantan is located in coordinate 0.0548460 S, 109.204387o which is located in north of Pontianak city. This regency consists of six villages and passed by Kapuas river with 6 meter depth.
Table 4.1 Disadvantages & Advantages Location in Siantan Regency
Siantan Regency
Advantages Disadvantages Land and Preparation Cost Future Business Development
Safety & Security Berthing Facility
Dredging Cost is cheaper Ease access for Material
Figure 4.1 Siantan Regency location plan
2. Alternative 2 – Pontianak City
Table 4.2 Disadvantages & Advantages of location in Pontianak City
Figure 4.2 Pontianak City Location Plan Pontianak City
Advantages Disadvantages Future Business Development Land and Preparation Cost
Berthing Facility Dredging Cost
Ease access for Material Permission Cost
3. Alternative 3 – Mini FSRU (Offshore)
Offshore facility for mini FSRU located in coordinate 0.072853 S, 108.965844o E in the china south sea and 18 km from PLTG MPP jungkat, Siantan.
Table 4.3 Disadvantages & Advantages location in Siantan Regency
Offshore (Mini FSRU)
Advantages Disadvantages Future Business Development Capital Cost
Safety & Security Operational Cost
Permission Cost Equipment Complexity
Period of Construction Distance to Power Plants
Figure 4.4 Layout of Alternative location selection
4.1.2 Criteria
Criteria of plant sitting location selection is shown in table 4.4 below.
Table 4.4 Criteria of Location Selection
Mini LNG Plant Location Selection
Economical Environment Technical Land &
Preparation Cost Safety and Security Period of Construction
Dredging Cost Ease of Crew Access
Future Business Development Berthing Facility Ease of Material Access Distance to Power Plant
Permission Cost Equipment Complexity Operational Cost
Capital Cost
Based on this table, it can be concluded that there are 13 criteria of mini LNG location selection which will be explain below:
1. Economical
Land and preparation cost is the expenditure cost used to buy land in West Borneo for plant sitting. Every location in Pontianak and Siantan have different cost and different land availability.
b. Dredging Cost
Dredging cost is the expenditure cost used to dredge the land in the location. For building infrastucture of mini LNG plant and receiving terminal, it needs land with good structure, so land dredging and land dredging cost are needed.
c. Berthing Facility Cost
When LNG is unloaded by Self Propelled LNG barge, it needs berthing facility for operation, if a location has no berthing facility then it needs to be build and expenditure cost is required.
d. Permission Cost
If we build an infrastucture in Indonesia, it needs permission and accomodation cost, so permission cost is considered.
e. Capital Cost
Capital cost is only for Mini FSRU because if we need to build mini FSRU, it needs more materials.
f. Operational Cost
If infrastructure is operating in a location such as mini FSRU, then it needs operation cost for crew and tools as fuel oil, lubrication oil, operational for bunkering, etc.
2. Environmental a. Safety and Security
Safety and security aspect is how good level of safety & security in a location, by comparing the three locations: Siantan Regency, Pontianak city and Offshore (Mini FSRU).
b. Ease of Crew Access
Ease of crew acces is how easy the crew or employee to access the mini LNG Infrastucture
c. Ease of Material Access
3. Technical
a. Period of Construction
Period of Costruction is how good is the level of construction in a location is needed, faster period construction of a location is better for a location to build mini LNG Plant Infrastructure.
b. Future Business Development
Future business develoment is how good is the level of business development in a location in the future, better business development, then better investment in a location.
c. Distance to Power Plant
Distance to Power Plant is how near the mini LNG Infrastructure to power plants. If mini LNG Infrastructure is close, then it can reduce cost for piping facility.
d. Equipment Complexity
Equipment Complexity is how good equipment is installed in a location. Different equipment complexity occurs between offshore and onshore.
4.1.3 ELECTRE Implementation for Selection Plant Sitting Location 4.1.3.1 Validation Test
1. Validation Test
Validation test has a function to determine if the questionnaire given to respondents is valid or not. By this formula
The number of respondents must be 30 people. If r calculation > r number then the result is valid (Ho), if r calculation is lower than r number than the
result is not valid (Ha). r tabeln with n = 30, the number of r number is 0,361.
In this validation process, all the questionnaire responds are valid. (See Attachment C).
4.1.3.2 Preference and Weight Data
(Table 4.5) for preference value is scaled from 1 to 5. The higher value indicates very good quality in that criteria
Table 4.5 Value of Likert Scale in Preference
Likert Scale Value
1 Very Bad
2 Bad
3 Normal
4 Good
5 Very Good
While for weighting value is also using likert scale (Table 4.6) which value given is higher then weighter the weight in that criteria.
Table 4.6 Value of likert Scale in Weight
Likert Scale Value
1 Less important
3 Medium important
5 Important
7 Very Important
9 Absolutely Important 2,4,6,8 Middle Value from each likert scale
Table 4.7 Preference of Criteria Value of Location Selection
Criteria
Alternative
Weight Siantan
Regency
Pontianak City
Offshore (Mini FSRU)
Land and Preparation cost 4,00 2,00 5,00 7
Dredging Cost 3,00 3,00 5,00 7 Operational Cost 4,00 3,00 5,00 9 Capital Cost 4,00 4,00 2,00 7 Berthing Facility 4,00 3,00 5,00 7 Permission Cost 3,00 4,00 4,00 7
Safety and Security 4,00 3,00 5,00 9
Access for Distribution 4,00 4,00 4,00 9 Access for crew 3,00 4,00 3,00 7 Future business development 4,00 5,00 4,00 9
Periode of Construction 4,00 4,00 3,00 7
Distance to Power Plant 4,00 3,00 3,00 7
Equipment complexity 4,00 4,00 2,00 5
4.1.3.3 Data Analysis
1. Step 1: Normalize
In Electre Method, Normalize has function to generalize all criteria to become same value. In case, if the criteria is put the price of capital cost or distance, it could be generalized with the same value with quality criterias.
𝑥𝑖𝑗
√∑𝑚 𝑥𝑖𝑗2 𝑖=1
for i = 1,2,3,.... m and j = 1,2,3... n
Table 4. 8 Value of Normalize of Location Selection
Criteria
Alternative
Siantan Regency
Pontianak City
Offshore (Mini FSRU)
Land and Preparation cost 0,59628 0,29814 0,74536
Dredging Cost 0,44721 0,44721 0,74536
Operational Cost 0,59628 0,44721 0,74536
Capital Cost 0,596284 0,59628 0,29814
Berthing Facility 0,59628 0,44721 0,74536
Permission Cost 0,44721 0,59628 0,59628
Safety and Security 0,59628 0,44721 0,74536
Access for Distribution 0,59628 0,59628 0,59628
Access for crew 0,44721 0,59628 0,44721 Future Business
Development 0,59628 0,74536 0,59628
Period of Construction 0,59628 0,59628 0,44721
Distance to Power Plant 0,59628 0,44721 0,44721
Equipment complexity 0,59628 0,59628 0,29814
2. Step 2: Weighting Matriks Normalize
Once normalized, each column of the matrix R multiplied by the weights (wj). Thus, the weighted normalized matrix is V = W.R written as:
V = R x W 𝑣11 𝑣12 𝑣1𝑛
𝑣21 𝑣22 𝑣2𝑛 𝑣𝑚1 𝑣𝑚2 𝑣𝑚𝑛
=
𝑤1𝑟11 𝑤2𝑟12 𝑤𝑛𝑟1𝑛 𝑤1𝑟21 𝑤2𝑟22 𝑤𝑛𝑟2𝑛 𝑤1𝑟𝑚1 𝑤2𝑟𝑚2 𝑤𝑛𝑟𝑚𝑛
Table 4.9 Weight Matriks Normalize Value Criteria Alternative Siantan Regency Pontianak City Offshore (Mini FSRU)
Land and Preparation cost 4,17399 2,08700 5,21749
Dredging Cost 3,13050 3,13050 5,21749
Operational Cost 5,36656 4,02492 6,70820
Capital Cost 4,17399 4,17399 2,08700
Berthing Facility 4,17399 3,13050 5,21749
Permission Cost 3,13050 4,17399 4,17399
Safety and Security 5,36656 4,02492 6,70820 Access for Distribution 5,36656 5,36656 5,36656
Access for crew 3,13050 4,17399 3,13050
Future business development 5,36656 6,70820 5,36656
Periode of Construction 4,17399 4,17399 3,13050
Distance to Power Plant 4,17399 3,13050 3,13050
Equipment complexity 2,98142 2,98142 1,49071
Based on this value we can calculate the value of difference absolute which is shown in the table 4.10 below.
Table 4.10 Value of Difference Absolute
Criteria
Absolute Difference
Siantan – Pontianak
Pontianak City
Siantan – Pontianak
Land and Preparation cost 2,08700 1,04350 3,13050
Dredging Cost 0,00000 2,08700 2,08700
Operational Cost 1,34164 1,34164 2,68328
Capital Cost 0,00000 2,08700 2,08700 Berthing Facility 1,04350 1,04350 2,08700
Permission Cost 1,04350 1,04350 0,00000
Safety and Security 1,34164 1,34164 2,68328
Access for crew 1,04350 0,00000 1,04350
Future business development 1,34164 0,00000 1,34164
Periode of Construction 0,00000 1,04350 1,04350
Distance to Power Plant 1,04350 1,04350 0,00000
Equipment complexity 0,00000 1,49071 1,49071
3. Step 3: Set of Concordances and Discordances
For each pair of alternatives k and l (k, l = 1,2,3, ..., m and k ≠ l) A set of criteria is divided into two subsets, namely concordance and discordance. Alternative criteria is included as concordance if Ckl ={j, vkl >= vij } for j = 1,2,3,...n.Instead,
complementary subsets of concordance are set discordance, namely when Dkl ={j,
vkl < vij } for j = 1,2,3,...n. By Using this formula, it the value of concordances and
discordances can be summarized in Table 4.10 below.
Table 4.11 Concordances and Disordances a1 to a2
Criteria
a1 to a2 a2 to a1 Concor dances Discor dances Concor dances Discor dances Land and Preparation
cost 7,00 0,00 0,00 2,08
Dredging Cost 7,00 0,00 7,00 0,00
Operational Cost 9,00 0,00 0,00 1,34
Capital Cost 7,00 0,00 7,00 0,00
Berthing Facility 7,00 0,00 0,00 1,04
Permission Cost 0,00 1,04 7,00 0,00
Safety and Security 9,00 0,00 0,00 1,34
Access for Distribution 9,00 0,00 9,00 0,00
Access for crew 0,00 1,04 7,00 0,00 Future business
development 0,00 1,34 9,00 0,00 Periode of Construction 7,00 0,00 7,00 0,00
Distance to Power Plant 7,00 0,00 0,00 1,04
Table 4.12 below shows value of concordances and discordances value of a1 to a3
and a3 to a1.
Table 4.12 Concordances and Disordances a1 to a3
Criteria
a1 to a3 a3 to a1 Concor dances Discor dances Concor dances Discor dances
Land and Preparation Cost 0,00 1,04 7,00 0,00
Dredging Cost 0,00 2,09 7,00 0,00
Operational Cost 0,00 1,34 9,00 0,00
Capital Cost 7,00 0,00 0,00 2,09
Berthing Facility 0,00 1,04 7,00 0,00
Permission Cost 0,00 1,04 7,00 0,00
Safety and Security 0,00 1,34 9,00 0,00
Access for Distribution 9,00 0,00 9,00 0,00
Access for crew 7,00 0,00 7,00 0,00
Future business development 9,00 0,00 9,00 0,00
Periode of Construction 7,00 0,00 0,00 1,04
Distance to Power Plant 7,00 0,00 0,00 1,04
Equipment Complexity 5,00 0,00 0,00 1,49
Table 4.12 below shows value of concordances and discordances value of a1 to a3
and a3 to a1.
Table 4.13 Concordances and Disordances a2 to a3
Criteria
a2 to a3 a3 to a2 Concor dances Discor dances Concor dances Discor dances Land and Preparation cost 0,00 3,13 7,00 0,00
Operational Cost 0,00 2,68 9,00 0,00
Capital Cost 7,00 0,00 0,00 2,09
Berthing Facility 0,00 2,09 7,00 0,00
Permission Cost 7,00 0,00 7,00 0,00
Safety and Security 0,00 2,68 9,00 0,00
Access for Distribution 9,00 0,00 9,00 0,00
Access for crew 7,00 0,00 0,00 1,04
Future business development 9,00 0,00 0,00 1,34
Periode of Construction 7,00 0,00 0,00 1,04
Distance to Power Plant 7,00 0,00 7,00 0,00
Equipment Complexity 5,00 0,00 0,00 1,49
4. Step 4: Calculate Matriks Concordances and Discordances
a. Calculating the matrix concordance
To determine the value of the elements in the matrix concordance is by adding weights included in the set of concordances, written in mathematical formula as follows:
Ckl = ∑ 𝐶𝑘𝑙𝑗𝑒
By using this formula, it all matrix in corcordance can be summarized, so the result is shown in Table 4.13 below.
Table 4.14 Matriks Concordance Calculate
Matriks Concordances Calculate
Alt 1 Alt 2 Alt 3
Alt 1 0,000 58,000 71,000
Alt 2 74,000 0,000 62,000
Alt 3 51,000 58,000 0,000
b. Calculating the matrix discordances
To determine the value of elements in matrix discordances is by dividing the maximum difference of criteria that included into subsets discordances with a maximum difference of the value of all the criteria; mathematically written as follows:
dkl = max{|𝑣𝑘𝑗 − 𝑣𝑖𝑗|}
max{|𝑣𝑘𝑗− 𝑣𝑖𝑗 |}
Table 4.15 Matriks Discordances Calculate
Matriks Discordances Calculate
Alt 1 Alt 2 Alt 3
Alt 1 0,000 1,000 1,000
Alt 2 0,643 0,000 0,667
Alt 3 1,000 1,000 0,000
5. Step 5: Determine Dominant Matriks Concordances and Discordances
a. Calculating the dominant matrix concordance
Matrix F as the dominant matrix concordance can be built with the help of threshold value, by comparing the value of each matrix element concordance with the threshold value.
Ckl >= C
with a threshold value (c) are:
c =
∑𝑚𝑘=1∑𝑚𝑖=1𝑐𝑘𝑙 𝑚 (𝑚−1 )