STRENGTH, SHRINKAGE AND CREEP OF CONCRETE IN
TENSION AND COMPRESSION
S A Kristiawan
Department of Civil Engineering, University of Sebelas Maret Email: [email protected]
ABSTRACT
Strength, shrinkage and creep of concrete in tension and compression have been determined and the relationship between those properties was studied. Direct tensile tests were applied to measure those properties in tension. The relationship of creep in tension and compression was determined based on the measurement of creep at similar stress and similar stress/strength ratio. It is found that concrete deforms more in tension than in compression. Except for concrete with a higher water/cement ratio, the use of pulverised fuel ash, ground granulated blast furnace slag, superplasticizer and shrinkage reducing admixture has no effect on strength. However, they affect creep and shrinkage of concrete.
Keywords: direct tensile, tensile strength, tensile creep, compressive creep, shrinkage.
INTRODUCTION
The presence of cracks in concrete indicates a potential problem in the structure. Although concrete may still be capable to serve as load-bearing function in the structure, the presence of cracks could facilitate the ingress of aggressive agents leading to deterioration and ultimately failure of concrete. There are several sources of cracking in concrete. One of them is due to development of tensile stress in the restrained shrinkage condition. This type of cracking can propagate continuously on the condition that concrete still shows shrinkage. However, there is other factor that should be considered and has beneficial effect in reducing the possibility of cracking to occur and propagate i.e. creep. While shrinkage generates tensile stress, creep will relieve it and may prevent cracking. The competition between shrinkage and creep deter-mines the magnitude of development of tensile stress. Whether cracking is likely to occur or not depends on this magnitude of development of tensile stress in comparison with the tensile capacity of concrete [1].
The data of tensile properties are necessary to enable prediction of the cracking behaviour of restrained shrinkage in concrete. Tensile strength may be used as a key parameter to determine the limit of stress at which concrete is considered to crack. Tensile strength is affected by the method of test application [2]. To choose the best method suitable for evaluating the cracking of concrete under restrained shrinkage
Note: Discussion is expected before November, 1st 2006. The proper discussion will be published in “Dimensi Teknik Sipil” volume 9, number 1, March 2007.
condition, one should understand the nature of tensile stress developed in such condition. In a structure where the ends of concrete elements are fixed in such a way to form external restraint, tensile stress due to restrained shrinkage may be regarded similar to that occurring in direct tensile test i.e. the stress is distributed across the area of concrete element. For concrete element subjected to tensile stress due to differential shrinkage between new and old structure in concrete overlays, the flexural strength may be more appropriate. From practical point of view, any methods of test may be used regardless the possible differences in the nature of stress, if the relationship between tensile strength determined from various test methods and between tensile and compressive strength could be esta-blished.
The role of creep to reduce induced tensile stress in restrained shrinkage has been recognised and included in methods to predict shrinkage cracking. Predictions based on the Effective Modulus Method, Trost-Bazant Method, Rate of Creep Method and Improved Dischinger Method as described in [3] may be adopted for the calculation of induced tensile stress in the restrained shrinkage of concrete. However, the proposed methods are originally derived from the compressive creep data. Tensile creep is assumed to have similar behaviour to compressive creep. This assumption, although inaccurate, is understandable due to the lack of data and models for tensile creep.
compressive ones. The relationships between tensile and compressive creep were determined on the basis of application of load at similar stress and similar stress/strength ratio. The influences of water/cement ratio, pulverised fuel ash (pfa), ground granulated blast furnace slag (ggbs), superplasticizer and shrinkage reducing admixture on strength, creep and shrinkage were investigated. All laboratory tests were done at the School of Civil Engineering, Leeds University, UK.
EXPERIMENTAL INVESTIGATION
Materials and Mixes
Six mixes have been used in the research. Details of the mixes are given in Table 1. The first, acting as control concrete, referred as c1dry, was in the mass proportion of 1:2:3 (cement: fine aggregate: coarse aggregate) with water/cement ratio of 0.47. The c2dry had the same proportion as above but the water cement/ratio was increased to 0.52. The pfa30dry and ggbs30dry were made by replacing 30% cement (by weight) of the c1 with pulverised fuel ash and ground granulated blast furnace slag, respectively. Finally, 0.6% volume of superplasticizer and 1.5% of shrinkage reducing admixture by weight of cement were added into the c1 to make up the sp06dry and sra15dry.
Table 1. Proportion of the mixes.
No Mix Proportion w/c Admixture 1 c1dry 1 : 2 : 3 0.47 N/A
2 c2dry 1 : 2 : 3 0.52 N/A
3 pfa30dry 1 : 2 : 3 0.47 30% of opc replaced with pfa
4 sp06dry 1 : 2 : 3 0.47 0.6% volume of superplasticizer by weight of cement
5 sra15dry 1 : 2 : 3 0.47 1.5% of shrinkage reducing admixture by weight of cement
6 ggbs30dry 1 : 2 : 3 0.47 30% of opc replaced with ggbs
Specimens
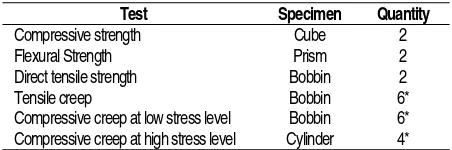
For compressive strength and flexural strength tests two cubes of 100 mm and prismatic of 100 x 100 x 500 mm specimens complying with BS 1881: Part 116: 1983 [4] and BS 1881: Part 118: 1983 [5], respectively, were used for every mix. The bobbin-shaped specimens as developed earlier by Brooks et al [6] were adopted for testing of direct tensile strength, creep in tension and creep in compression at low stress. It is a cylinder with diameter of 76 mm and length of 265 mm and with the ends of specimen has wider diameter to form truncated cones. Figure 1 gives an example of the bobbin-shaped specimen. For testing of compressive creep at high stress level, cylinders with diameter of 76 mm and length of 265 mm were used. Specimens for measuring shrinkage were similar to those used for creep tests. Table 2 presents the type and number of specimens required for every set of test in every mix.
Figure 1. An example of bobbin shaped specimen where it was cast in the bobbin-shaped mould (left) and after concrete hardened the middle sections of the mould were removed leaving the specimen with end caps (second from right).
Table 2. The number of specimens required for
every set of experiment in every mix.
Test Specimen Quantity
Compressive strength Cube 2
Flexural Strength Prism 2
Direct tensile strength Bobbin 2
Tensile creep Bobbin 6*
Compressive creep at low stress level Bobbin 6*
Compressive creep at high stress level Cylinder 4*
* including those for measuring the concurrence shrinkage.
Strength tests
The cube compressive strength and prismatic flexural strength tests were carried out in accor-dance with the requirements of the relevant British standards. For direct tensile strength test, the Instron machine was used and a stress rate of 0.06 MPa/sec was applied. This stress rate was equal to that applied for measuring flexural strength. All specimens were tested at the age of 14 days after undergoing curing at 20oC and 100% RH. The required strength for the assessment of shrinkage cracking of concrete was determined at the age corresponding to the time when shrinkage was started. It is common in practice to stop curing of concrete (and so concrete start to shrink) after 14 days of age. Other investigator [1] considered 7 days in addition to 14 days for such purpose.
Tensile and compressive creep tests at low stress level
Figure 2. Compressive Creep Test Frame
Figure 3. Tensile Creep Test Frame
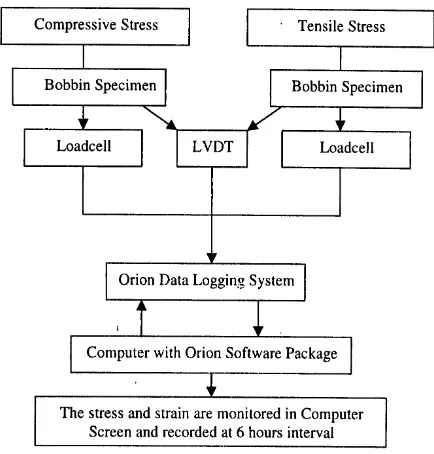
The load was measured using load cells made of hollow tubes of aluminium alloy of an external diameter of 42 mm and wall thickness of 2 mm with the flange of external diameter of 75 mm at the ends. The deformation of specimens was measured by Linear Variable Displacement Transducer (LVDT). Two LVDTs were installed on every test specimen. A special pair of ring clamps were used to fix the LVDTs at a gauge length of 100 mm. The arrange-ment of LVDTs on the specimen is shown in Figure 4. Data acquisition system was used to record loads and strains continuously every 6 hours. The test was ended when failure of concrete occurred in the concurrence restrained shrinkage test as described elsewhere [7]. The system is illustrated in Figure 5.
Figure 4. Arrangement of LVDTs on The Specimen
Figure 5. The Scheme of Data Acquisition System
Compressive creep test at high stress level
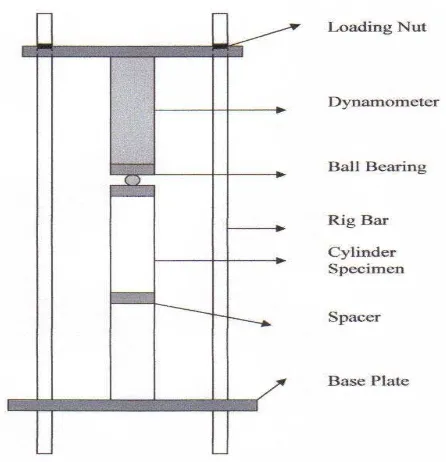
Figure 6. Compressive Creep Loading Frame (High Stress
Figure 7. Example of The Result of Dynamometer Calibration.
The load for this creep test was equal to a stress at 30% of the compressive strength of the specimen. This level of stress was applied due to the following reasons: firstly, at this level of stress concrete is considered still at elastic state and secondly, at elastic state creep is proportional to the stress. In turn, specific creep, i.e. creep per unit of stress obtained would represent true creep consistently. The load was converted to a targeted loading strain of the dynamometer using the calibration graph. During the creep test two companion specimens for the control load-free strains (shrinkage) were also measured. Deformations of concrete (both creep and shrinkage) were monitored by Demec gauge at a gauge length of 200 mm. Demec readings were taken every 12 hours for the first day, and after that period they were taken continuously every 24 hours. The test was stopped at the same time as that of tensile creep test.
TEST RESULTS AND DISCUSSION
Strength
The 14-day compressive, direct tensile and flexural strengths for all the mixes are tabulated in Table 3. The results show that, for all types of tensile test, concrete with the higher w/c ratio has a lower tensile strength. The addition of cement replacement mate-rials or chemical admixtures slightly reduces the flexural strength, but hardly affects the direct tensile strength.
Table 3. Strength in Compression, Direct Tension and Flexure.
Table 4. Relationship Between Compressive, Direct Tensile and Flexural Strength.
Ratio (x100 %)
The relation of compressive, direct tensile and flexural strength is listed in Table 4. The relations established in this table were calculated from the values of various strengths given in Table 3. Gene-rally concrete with lower compressive strength tends to have higher ratio of direct tensile to compressive strength, but the relation is not consistent for the ratio of flexural to compressive strength. The direct tensile and flexural strength are about 5.9%-8.1% and 9.9%-11.2%, respectively, of compressive strength. The values are similar to that observed by other investigator [8].
curve near failure. To account for the non-linearity of stress-strain relationship in the calculation of measured flexural strength, he replaced the curvili-near tensile stress-strain diagram by a simple rectangular stress diagram with the same dimensio-nal constraints proposed by Whitney. In this way, he showed that the flexural strength was about 75% of that calculated from equation derived from elastic theory. His finding implies that tensile strength measured from flexural test is 25% higher than that measured from direct tensile test.
Tensile Creep
The total tensile creep determined on the drying specimens is presented in Figure 8. Concrete having water/cement ratio of 0.47 with no addition of mineral or chemical admixtures is referred as a control concrete (c1). The effects of water/cement ratio, addition of pfa, ggbs, superplasticizer and shrinkage reducing admixture are analysed by comparing the total tensile creep of c1 concrete with that of c2, pfa30, ggbs30, sp06 and sra15 concrete, respectively. From the figure it is seen that shrinkage reducing admixture has no effect on the total tensile creep. This result confirms what pre-viously has been shown by Jiang [1]. The additions of pfa, ggbs, and superplasticizer increase the total tensile creep, with the superplasticizer giving the most significant effect in increasing total tensile creep. Increasing water/cement ratio also causes an increase in the total tensile creep.
0
Time since loading (days)
S
Figure 8. Total Tensile Creep of Concrete Determined on Drying Specimens
Time since loading (days)
Sp
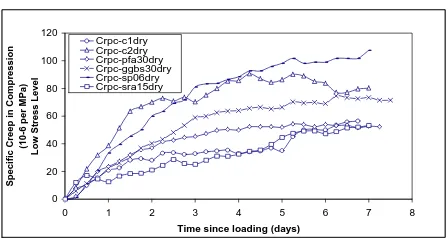
Figure 9. Total Compressive Creep (Low Stress) of Concrete Determined on Drying Specimens.
0
Time since loading (days)
S
Figure 10. Total Compressive Creep (High Stress) Deter-mined on Drying Specimens
The effect of superplasticizer on the increase in tensile creep may not be due to the effect of chemical composition of the material, but due to the consequence of using superplasticizer for enhancing workability. As superplasticizer is used in the mix without changing the water/cement ratio, it makes the fresh concrete flow. At this stage the water content in the mix tends to move upward during compaction while the aggregates settle in the bottom. Some of the water may be trapped causing flaw in the concrete. Ward and Cook [13] suggested that mechanism of tensile creep is related to the opening of microcracks. Under tensile stress the weakest part of the concrete i.e. the flaw, will propagate. As a result concrete extends at direction of the tensile stress and it measures up the strain (creep) of concrete. The opening of microcracks may also explain the higher tensile creep of concrete with higher water/cement ratio.
Compressive Creep
The total compressive creep observed on the drying specimens under low level of sustained stress is given in Figure 9. Except for concrete with shrinkage reducing admixture the increase in water/cement ratio, the use of pfa, ggbs and superplasticizer increase the total compressive creep. This obser-vation is similar to that for total tensile creep and in fact, those mixes tend to behave in similar way also. For example, at later time concrete with the superplasticizer shows the highest magnitude of compressive creep.
The total compressive creep determined under high level of sustained stress is presented in Figure 10. As for tensile creep and compressive creep under low stress level, water/cement ratio shows significant effect in increasing the total compressive creep while the use of pfa slightly increases the total compressive creep. The other mixes seem to have little effect.
Relationship Between Tensile and Compres-sive Creep
always in agreement. In 1939 Glanville and Thomas [14] observed a similarity between total tensile and compressive creep. However, two years earlier Davis et al [15] showed that tensile creep is higher than compressive creep. Later other investigators [9,16] confirmed the finding of Davis et al. Most recently, Li et al [17] pointed out that tensile creep could be four times higher than compressive creep. The relation between tensile and compressive creep based on the same applied stress as observed in the current research is presented in Figure 11. The relationship is:
ccl = 0.5 ct (1)
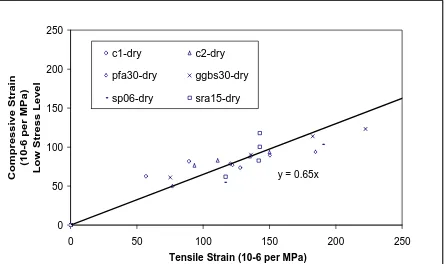
where ccl and ct are the specific creep in compression (low stress) and in tension respectively. The relation-ship is only a tentative suggestion due to the limited data of the current research. It is convenient to include instantaneous strain in the relation since the instantaneous strain due to application of load and the subsequent creep could not easily be separated from one another. The relationship between creep function i.e. elastic-plus-creep per unit stress in tension and compression shown in Figure 12 is:
Фcl = 0.65Фt (2)
where Фcl and Фt are the respective tensile and compressive creep function.
y = 0.50x
Specific Creep in Tension (10-6 per MPa)
S
Figure 11. Relationship Between Specific Creep in Tension and Compression Based on Equal Applied Stress.
y = 0.65x
Tensile Strain (10-6 per MPa)
Co
Figure 12. Relationship Between Creep Function in Tension and Compression Based on Equal Applied Stress.
y = 6.97x
Specific Creep in Compression (10-6
per MPa)
Figure 13. Relationship Between Specific Creep in Tension and Compression Based on Equal Applied Stress/Strength Ratio.
When the relation is based on the similar stress/ strength ratio, the tensile creep is much bigger compared to the compressive creep as shown in Figure 13. On average tensile creep is about six times of the compressive creep. The relationship is:
ct = 6.97cch (3)
where cch is the specific compressive creep due to a high stress level. When the elastic strain is included in the relation as given in Figure 14, the equations become:
Фt = 3.68Фch (4)
where Фch is the compressive creep function (high stress)
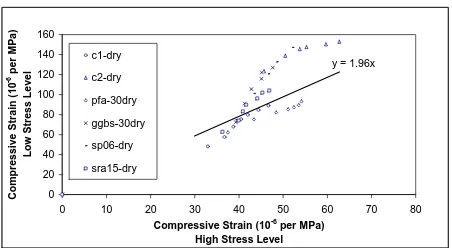
It is clear that the relation between tensile and compressive creep must take into account the stress level at which the creep is determined. It is due to the fact that the magnitude of compressive creep determined under low stress level is different than that determined under high stress level. Figures 15 and 16 correlate the two creeps in the following equations:
ccl = 3.11cch (5)
Фcl = 1.96Фch (6)
y = 3.68x
Figure 14. Relationship Between Creep Function in Tension and Compression Based on Equal Applied Stress/Strength Ratio.
Specific Creep in Compression (10-6 per MPa)
High Stress Level
Figure 15. Relationship Between Specific Creep in Tension Determined From Low Applied Stress and High Applied Stress Level.
y = 1.96x
Compressive Strain (10-6 per MPa)
High Stress Level
Figure 16. Relationship Between Creep Function in Tension Determined From Low Applied Stress and High Applied Stress Level.
Drying Shrinkage
The deformation of concrete measured on the unloaded specimens under drying condition is given in Figure 17. The figure demonstrates that water/ cement ratio has a considerable effect on the drying shrinkage. Concrete with the highest water/cement ratio shows the highest shrinkage; it is almost twice that of the drying shrinkage of the control concrete. The inclusion of pfa, ggbs and superplasticizer without changing the water/cement ratio does not affect the drying shrinkage. This finding is similar to
that noted by Fattuhi and Al-Khaiat [19] and Brooks [20]. On the other hand Chern and Chan [21] pointed out that there is an increase in the drying shrinkage of concrete due to the addition of ggbs. The use of the shrinkage reducing admixture in the concrete effectively reduces the drying shrinkage; concrete with the shrinkage reducing admixture only shrinks at a magnitude of 35 microstrains after 4.5 days while the corresponding control concrete c1 shrinks at about 108 microstrains. The reduction of the drying shrinkage in concrete containing shrin-kage reducing admixture is caused by the ability of the admixture to chemically reduce the capillary tension in the pores water which develops within concrete as it dries.
0
Figure 17. Drying Shrinkage of All Mixes Observed in The Current Research
SUMMARY AND CONCLUSIONS
The main conclusions deducted from the current experimental work are as follows:
a. Tensile strength determined from direct tensile test is lower than that of flexural strength and this finding is in agreement with the finding of previous investigators [2,9,10,11]. Addition of concrete with pfa, ggbs, superplasticizer and shrinkage reducing admixture will not affect (either increase or decrease) the tensile strength as long as the water/binder ratio is kept constant. b. Tensile creep may be related with the compres-sive creep based on the measurement of creep at equal stress or stress/strength ratio. On the basis of equal stress, tensile creep seems to behave similarly with that of compressive creep as can be seen in the trends of the two creeps. However, if they are compared in term of their magnitude of creep, it is found that tensile creep is about twice that of the compressive creep. If comparison is based on a similar stress/strength ratio tensile creep is about seven times of the compressive creep.
REFERENCES
1. Jiang, X, The Effect of Creep in Tension on
Cracking Resistance of Concrete, Dissertation,
Submitted for degree of M.Sc., Dept of Civil Engineering, Leeds University, 1997.
2. Torrent, RJ, The Effect of Specimen Geometry
and Stress Distribution on The TensileStrength
of Concrete, PhD Thesis, Leeds University,
August 1983.
3. Neville, AM, Dilger, WH. and Brooks, JJ., Creep
of Plain and Structural Concrete, Longman
Group Limited, Essex, England.
4. British Standard 1881: Part 116: 1983, Method for Determination of Compressive of Concrete Cube.
5. British Standard 1881: Part 118: 1983, Method for Determination of Flexural Strength.
6. Brooks, JJ. and Neville, AM, “A Comparison of Creep, Elasticity and Strength of Concrete in Tension and in Compression”, Magazine of
Concrete Research, Vol. 29 No. 100, Sept 1977,
pp 131-141.
7. Kristiawan, SA, Development of Tensile Strength
Due to Restrained Drying Shrinkage, Proceeding
of International Conference on Quality in Research, the University of Indonesia, Jakarta, August 2005.
8. Wee, TH, Lu, HR. and Swaddiwudhipong, S., “Tensile Strain Capacity of Concrete Under Various States of Stress”, Magazine of Concrete
Research, Vol. 52 No. 3, June 2000, pp 185-193.
9. Brooks, JJ, Wainwright, P and Al-Kaisi, AF., "Compressive and Tensile Creep of Heat-Cured Ordinary Portland and Slag Cement Concrete",
Magazine of Concrete Research, Vol. 43, No. 154,
March 1991, pp 1-12.
10. Kadlecek, V and Spetla, Z., “Effect of Size and Shape of Test Specimens on The Direct Tensile Strength of Concrete",RILEM Bulletin, No. 36, Sept 1967, New Series, pp 175-184.
11. Wright, PJF., "The Effect of Method of Test on The Flexural Strength of Concrete", Magazine of Concrete Research, Vol. 4, No. 11, pp 67-76
12. Raphael, JM., ”Tensile Strength of Concrete”,
ACI Journal, March-April 1984, pp 158-165.
13. Ward, MA and Cook, DJ., "The Mechanism of Tensile Creep in Concrete", Magazine of
Con-crete Research, Vol. 21 No.68 Sept 1969, pp
151-158.
14. Glanville, WH and Thomas, FG, Studies in Reinforced Concrete IV. Further Investigation on
Creep or Flow of Concrete Under Load, Building
Research Technical Paper No. 21, London, 1939.
15. Davis, RE, Davis, HE and Brown, EH., Plastic
Flow and Volume Changes of Concrete,
Proceeding ASTM, 37, Part 2, 1937, pp. 317-330.
16. Illston, JM, “The Creep of Concrete Under Unia-xial Tension”, Magazine of Concrete Research, Vol. 17 No.51 June 1965, pp 77-84.
17. Li, H, Wee, TH, Wong, SF., “Early-Age Creep and Shrinkage of Blended Cement Concrete”,
ACI Materials Journal, Jan-Feb 2002, pp 3-10.
18. Powers, TC, Mechanism of Shrinkage and Reversible Creep of Hardened Portland Cement
Paste, Proceeding of International Conference
On the Structure of Concrete, Cement and Concrete Association, London, England, 1968 pp 319-344.
19. Fattuhi, NI and Al-Khaiat, H, ”Shrinkage of Concrete Exposed to Hot and Arid Climate”,
Journal of Materials in Civil Engineering, Feb
1999, pp 66-75.
20. Brooks, JJ, ”How Admixtures Affect Shrinkage
and Creep”, Concrete International, April 1999,
pp 35-38.
21. Chern, JC and Chan, YW, “Deformations of Concrete Made With Blast Furnace Slag Cement and Ordinary Portland Cement", ACI
Materials Journal, Vol. 86 No. 4, July-August