1
Application of Distributed Generation to Enhance Loadability
of Distribution System, A Case Study
1Abraham Lomi2, Nguyen Cong Hien3, Mithulananthan N.4 e-mail: [email protected]
Abstract
There has been a great interest in integration of distributed generation (DG) units at distribution level in the recent years. DGs can provide cost-effective, environmentally friendly, higher power quality and more reliable energy solutions than conventional generation. Understanding the wide variety of DG options available along with their technical benefits in today’s changing electric market environment can be daunting. Technical benefits of DGs can range from loss reduction to reduction in feeder loading. Loadability enhancement is another benefit that DG can add to distribution system, if properly placed and appropriately sized. This paper presents a simple methodology for placing a distributed generation with the view of increasing loadability and voltage stability of distribution system. Effectiveness of the proposed placement technique is demonstrated in a practical distribution system of Pujon in Malang, Indonesia.
Keywords: Distributed generation, loading margin, loadability, weakest bus, voltage stability.
1. Introduction
In the past, due to the “economy of scale” power generating stations were often large and their capacities in range of 150-1000 MW, even larger in some cases. Clearly, such type of big power stations required large facilities, including land and personnel needed to operate and high capital investment. Moreover, since these big power stations cannot be constructed close to load center for some obvious reasons, there is a need for long Extra High Voltage (EHV) or Ultra High Voltage (UHV) transmission lines, including transmission substations. Similar to power stations, these transmission lines and substations need ample amount of money and resources for design, constructions, operation and maintenance.
Moreover, the lengthy structure of these transmission lines makes those lines are vulnerable to natural hazards, such as heavy wind, snowstorms and lightning strikes. ____________
1)
This project is sponsored by DGHE, Department of National Education.
2)
Department of EE Institut Teknologi Nasional, Malang.
3)
Energy Program, Asian Institute of Technology, Bangkok.
4)
School of Information Technology, The university of Queensland, St Lucia Campus, Brisbane, Qld 4072.
These natural hazards, in some cases, become the major reason for partial or full blackout of the power system triggered by some line outages.
Given these conditions added with economical and environmental pressure due to green house gas (GHG) emission and consequent climate change in the recent past been changing way of generation approaches of electric power utility. By considering above issues one of the best alternatives for change in traditional way of generation and delivery arrangement is to introduce distributed generation based on renewable energy resources. Given the sizes of these plants they can be conveniently located closed to load centers.
2
network performance. A number of DGs can be organized to form a Micro Grid (MG) which can either run parallel to the grid or stand alone. Many other applications of DG exist.
The current trend of regulated electricity market, where competition is introduced in generation, transmission and distribution, prospect for distributed generation (DG) is high. People with an interest of having their own power plant can do so and the rest of power after their consumption can be sold out for the benefit of all. This would release the government burden in investing huge amount of money for generation sector and could result in reduce electricity price and better quality of supply.
A number of advantages and “climate” of current electricity business, strongly favor the application of DGs. However, there many issues need to be considered before allowing the distributed generation to operate in power systems. Given the choices, where should the DG be placed in the system to enjoy maximum technical benefits, such as low losses, higher reliability, increase loadability and better voltage profile etc. In this paper, DG placement in practical distribution system is investigated to study its impact on loadability of the system.
Rest of the paper is organized as follows: the next section describes the distributed generation in general and their benefits. The placement technique is then discussed in detail including the proposed approach. How DG influences on various technical benefits consider in this paper is also briefly discussed. Details of distribution test system and the analytical tool used in this paper is presented, before the results and discussion. Finally, the major contributions of the paper are highlighted.
2. Distributed Generation
The term “distributed generation”, or DG, refers to the small scale generation of electric power by a unit located close to load
being served. DG technologies range in size from 5 kW to 10 MW, and include both fully commercial systems, such as reciprocating engines, and others that are primarily in the laboratory, such as fuel cells. DG technologies can meet the needs of a wide range of users, with applications in the residential, commercial, and industrial sectors. Decision makers at all levels need to be aware of the potential benefits DG can offer. In some instances, DG technologies can be more cost effective than conventional solutions. Among other things, DG can be used by utilities to both enhance existing systems and to delay the purchase of transmission and distribution equipment.
In addition, DG units can help meet the changing demands of end users for premium, reliable or “green” power. Production of electric energy is one of the vital parts in power system operation. Production of electrical energy often referred to as “generation” which can come from various sources and variety technologies. Traditionally, electric energy is produce from Hydro, Gas, Diesel and Nuclear power stations.
In general, the term “distributed generation” includes all use of small electric power generation whether placed on the utility system or at an isolated location, which is not yet connected to the central grid. On the other hand, “dispersed generation” is, basically, a subset of distribution generation that is located at customer facilities or off the utility system. Usually, the generation facilities in very small range, 10 to 250 kW are classified as dispersed generation.
3
high speed. Based on the technology used for electricity generation DG can be classified into different types by considering its terminal characteristics i.e. whether it absorb or deliver real and/or reactive power. Some of customer applications of DG: 1. Standby or emergency power.
2. Improving the quality of supply and increase reliability (high electric efficiency).
3. Uninterrupted own electricity generation with or without grid backup.
4. Serving niche applications, such as “Green Power” or “Remote Power” (low emissions, high efficiency, and low variable maintenance costs).
5. Permitting customers to generate electricity while serving their thermal and cooling loads.
6. Meeting continuous power, premium power or cogeneration needs of the residential market.
7. Sell excess generation back onto the grid, when there is a surplus of power, especially during the peak hours.
However, in order to use DGs for various applications in technically feasible and economically viable manner, given the choice, they have to be placed in “suitable location”. A brief discussion on some DG placement methods, including a new technique for increasing the loadability of the feeder is presented in the next section.
3. Placement Methods and Loadability
DGs can be placed in Distribution feeder for minimizing real power losses2,5. Loss sensitivity factors or artificial intelligent techniques such as genetic algorithm or traditional optimization techniques can be used to identify the best location. Improper selection of size could increase losses. Another interesting application of DG could be loadability enhancement. By enhancing loading margin distribution companies or
power utilities can optimize resources and maximize profit.
In practice, loadability of distribution system is limited by voltage drop as most of distribution feeders are long and operating at low voltage level. In other words at maximum loading point, buses or loading nodes would experience a severe voltage drop. The node which would experience maximum rate of change of voltage with respect to load increase is called the “Weakest Node” of the system4. The weakest node will have the highest voltage gradient. By identifying this node and controlling the voltage at this node by DG will increase loadability of the system. There are many ways to identify the weakest bus in a power system2,7,10.
Finding the weakest bus
The weakest bus of a network, transmission or distribution, is based on Static Voltage Stability criteria. For stability, the index Lj2 must not be violated for any of nodes j. An L-index assumes a value between 1 and 0. An L-index of zero indicates a strong bus in term of voltage stability. The higher values for L-indices are indicative of most critical buses and thus maximum L-indices (Lmax) are an indicator of proximity of the system to voltage collapse, and also an indicator of the most critical bus. Also, summation of all L -indices or (6L2) gives a relative indication of over-all voltage stability of the system for various operating conditions. The indicator L is a quantitative measure for estimation of the distance of the actual state of system to stability limit. The local indicators Lj permit the determination of those nodes from which a collapse may originate.
Using the load flow results the L -index is computed as
¦
i gi
j i ji
j F V V
L
1
) / (
4
where j = g+1, …, n and all the terms within the sigma on the RHS of Eq. (1) are complex quantities. The values Fji are obtained from the Y bus matrix as follows
» and voltages at the generator nodes and load nodes. Rearranging Eq.(2) we get
» technique. The L-indices for a given load condition are computed for all load buses. Solving for vector,
> @
ZLj =>
Zg1,j ...Zjj,...Znj@
(4)correspondingjth load bus, from the solution
» the product of matrix,
>
@
therefore be written as¦
Maximum loading point or loadability
The maximum loading point in transmission and distribution system can be associated with saddle-node bifurcations4,7. At this bifurcation point, a real eigenvalue of the load flow Jacobian becomes zero, i.e. the Jacobian becomes singular.
Direct and continuation techniques are typically used to identify the location of saddle-node bifurcations in nonlinear system models. Direct methods find the bifurcation point directly from a known operating condition by modified Newton-Raphson iterations. Continuation methods5, on the other hand, find the bifurcation point of the nonlinear system as the system parameter changes, yielding an adequate approximation of the location of the bifurcation point by using predictor and corrector steps. Another benefit of the continuation method is that gives the information about the weakest bus. Right eigenvector or tangent vector at the maximum loading point can be also be used to identify the weakest bus.
5
DGs Influence
DG can be used to keep voltage magnitude of a bus closer to 1 p.u. or nominal value. As a direct impact of DG voltage profile of nodes in the vicinity of DG would significantly improve if it is capable of delivering reactive power. If DG is capable of delivering real power only, voltage improvement may not be significant. This can be verified using power flow solutions. As a result of better voltage profile, the voltage gradient will drop resulting better voltage regulation and reduction in power loss. However, in order to support voltage DG should be capable of dispatching reactive power as well. Some DG units as such wind turbine runs based on induction machines principal are not suitable for this purpose. Placing DG which is capable delivering reactive power and also real power at the weakest bus would allow the system to be loaded to the maximum point, as most of the distribution system feeders are voltage limited. This can be studies with the help of multiple power flow studies or continuation power flow technique7.
Since DGs are capable of dispatching both real and reactive power, they can decrease the total current drawn by the main feeder from the substation. This will keep the feeder under it’s the thermal limit and also would contribute to better voltage regulation, reduction in losses and increase loadability. However, in this paper two DG types, i.e. DG capable or delivering real power only and DG capable of deliver both power, are investigated for loadability enhancement in primary distribution feeder. The details of improvement in different phenomenon due to DG installation will be presented in the result and discussion section.
4. Results and Discussion
Pujon Test System
The proposed methodology was tested in a practical distribution system in Malang area in Indonesia. The system consists of
101 buses and 5 branches with a total load of 64.6 MW. There are resources in the area for potential of DG application, especially in Sengkaling branch, the branch consider for the study. There scenarios were considered here. First Scenario is the base case, i.e. the study of Pujon system without any DG. A DG type that inject only real power is considered in the second scenario, while in the third scenario a DG type capable of delivering both real and reactive power is considered.
DG Location
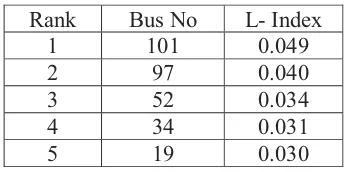
Table 1 shows the first five weak buses of Pujon distribution system with their L-index values. Form the results it is clear that bus 101 is the weakest bus and any DG capable of delivering reactive power should be placed at that location to maximize loading margin.
Table 1: Ranking of Buses
Rank Bus No L- Index
1 101 0.049 2 97 0.040 3 52 0.034 4 34 0.031 5 19 0.030
Loading Margin
6
0 1 2 3 4 5 6 7
0 2 4 6 8 10 12 14 16 18 20
L.F. [p.u.]
Vo
lt
a
g
e
kV
Bus 94
kV
Bus 95
kV
Bus 96
kV Bus 97
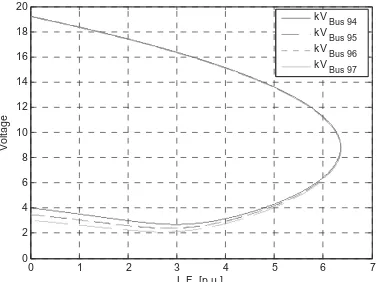
Figure 1: PV curve or nose curve at few buses for the base case.
In the second scenario, DG capable of injecting a real power of 5 MW is considered at bus 101. Figure 2 shows PV curve or nose curve at few bused for the second scenario. As can be seen from the results the loading margin has been improved to 7.9371 p.u.
0 1 2 3 4 5 6 7 8
0 5 10 15 20 25
L.F. [p.u.]
Vo
lt
a
g
e
kV
Bus 94
kV Bus 95 kV Bus 96 kV
Bus 97
Figure 2: PV curve or nose curve at few buses for the second scenario.
In the third scenario, DG capable of delivering a real and reactive power of 5 MW and 2.5 MVar, respectively is considered at bus 101. For the reactive power capability of DG is considered to be 50% of the real capability. Figure 3 shows the loading factor of the system for third scenario. Notice that the loading margin has increased to 8.8752 p.u. compared to the based case loading margin of 6.3551 pu.
0 1 2 3 4 5 6 7 8 9
0 2 4 6 8 10 12 14 16 18 20 22
L.F. [p.u.]
Vo
lt
a
g
e
kV
Bus 94
kV
Bus 95
kV Bus 96 kV Bus 97
Figure 3: PV curve or nose curve at few buses for the third scenario.
Table 2 compares loading margins for the three scenarios.
Table 2: Comparison of Loading Margins
Scenario Loading Margin
(p.u.)
Percentage Increase (%)
First (Base Case)
6.3551
Second 7.9371 24.89
Third 8.8752 39.65
5. Conclusions
7
6. References 7.
1. H. L. Willis and W. G. Scott,
“Distributed Power Generation:
Planning and Evaluation”, Marcel
Dekker Inc. New York, 2000.
2. Lomi, Abraham, “Selection of Static VAR Compensator Location and Size for
System Voltage Stability Improvement”,
International Journal of Electric Power System Research, Elsevier, May 2000. 3. T. Griffin, K. Tomosovic, D. Secrest
and A. Low, “Placement of Dispersed Generations Systems for Reduced
Losses”, In Proc. Of the 33rd Hawai
Inter., 2000.
4. C. A. Canizares, A. C. Z. de Souza, and V. H. Quintana, “Comparison of Performance Indices for Detection of
Proximity to Voltage Collapse”, IEEE
Transactions on Power Systems, 11(3), August 1996, pp. 1441-1450.
5. P. Kundur, “Power System Stability and
Control”, McGraw-Hill, New York,
1993.
6. Abraham Lomi, “Reactive Power Optimization for Voltage Stability
Improvement”, Science Engineering
Journal, Universidade Federal de Uberlandia, Brazil, 2000, pp. 16-21.
7. A. Canizares, et. al, “UWPFLOW: Continuation and Direct Methods to Locate Fold Bifurcations in
AC/DC/FACTS Power Systems”,
University of Waterloo, Nov. 1999. 8. N. Mithulananthan, C. A. Canizares, and
J. Reeve, “Hopf Bifurcation Control in Power Systems Using Power System Stabilizers and Static Var
Compensators”, Proceedings of The
North American Power Symposium (NAPS), San Luis Obispo, CA, Oct. 1999, pp. 155-162.
9. Edwin HAESEN, et al, “Optimal placement and sizing of Distributed Generation units using Genetic
Optimization Algorithms”, Electrical
Power Quality and Utilization Journal, Vol. XI, No.1, 2005, pp. 97-104.
10. Naresh Acharya, Pukar Mahat, and N. Mithulananthan, “An analytical approach for DG allocation in primary
distribution network”, Electrical Power
and Energy Systems 28(2006), 669-678. 11. Durga Gautam, N. Mithulananthan,
“Optimal DG placement in deregulated
electricity market”, Electric Power