DECADES Tool to Make Comparative Assessment of Electricity Generation
in Indonesia
1Abubakar Lubis Agus Sugiyono
Agency for the Assessment and Application of Technology (BPPT) Indonesia
1. Introduction
This report is a result from experience in using the DECADES tool in Argonne National Laboratory, USA from 2 December 1996 to 12 December 1996. DECADES tool has been developed by International Atomic Energy Agency (IAEA). Indonesia is one of the participant that using DECADES tool to make planning on electricity generation. Indonesia has cooperation with IAEA and being carried out study with title: Comparative Assessment of Electricity Supply Strategies in Indonesia. The objective of the study is design an optimal strategies for the national electricity supply in Indonesia for the long term (1996-2021). Taking into account economic and environmental aspect, and to analyze the impacts of alternative strategies.
The study scope is :
- to complement data already collected on existing and future electricity generation chains in Indonesia.
- to establish an Indonesia Country Specific Data Base (CSDB) using the RTDB computer structure.
- to design a reference scenario for energy demand and supply including the electricity system and alternative strategies for electricity supply using the MARKAL model.
- to analyze and compare the economic and environmental aspects of different strategies for electricity system expansion.
2. Issue for Energy Development
One of the Indonesian government policies in energy sector is reduced consumption of oil fuel. To promote this policy, the oil fuel that used in electric power plant must be substitute with other energy resources such as coal, geothermal and natural gas. The other policy is : - Promote CNG and LPG for public car.
- Produce and promote unlead gasoline.
- Promote photovoltaic electrification for remote area with 50 MW rural electrification programme conducted by BPPT.
Indonesia also introduced a new energy technology and has been developed new energy resources.
- Low-rank coal liquefaction
The estimation of the indigenous coal reserves reaching 36.3 billion tons is mainly in the form of low-rank coal (85.2 %). The unfavorable quantity of low-rank coal such as high moisture content (>35 %) and low calorific value (<4000 kcal/kg) makes it difficult to be
1
exported. The utilization of this coal is still limited for the mine-mouth electric power generation. One alternative to achieve the diversified energy strategy for the transportation sector is the utilization of low-rank coal through the coal liquefaction technology. For this purpose BPPT has initiated a joint research with NEDO (New Energy Industrial and Technology Development Organization) of Japan to utilize the Indonesian low-rank coal. Research and development is being conducted based on the experience of BCL (Brown Coal Liquefaction) process.
- Natural gas resources in Natuna Island
The natural gas reservoir in Natuna Island estimate about 210 x 1012 SCF. The resource development needs high investment due to high CO2 content (91 %) in these resources. On
of the technique to handle CO2 is injected this gas into offshore aquifer.
- Mamberamo hydroelectric power
The 650 km long Mamberamo River in Irian Jaya (Eastern of Indonesia) has potential to produce between 15-20 GW of electricity. This abundant supply of electricity does not have demand therefore need to build industrial estate in Irian Jaya and can also produce hydrogen, the environmental friendly source of sustainable energy for the future. This hydrogen produced from electrolysis of water can be further processed to produce petrochemical, such as methanol, methane, and ethane by combining with CO2 which available in huge
amount from natural gas field in Natuna Island.
- Jawa-Sumatra electricity interconnection
Jawa Island and Sumatra Island are the most rapid growing islands in Indonesia. Each of these islands has own electricity interconnection. In Jawa Island, the power plant interconnected with 150 kV and 500 kV using High Voltage alternating current. In Sumatera Island, the power plant is only interconnected with 150 kV. In the near future the two islands with about 40 km distance could be interconnect with submarine cable of electricity using HVDC to improve the reliability of electricity system in Indonesia.
- Integrated gas pipeline
Because Indonesia has enough natural gas resources, the integrated pipeline is needed. The pipeline link from resource in Aceh (Sumatra Island), Bontang (Kalimantan Island) and Natuna Island to the end-used in Jawa Island and for the export destination should be built soon.
3. Current Situation and Projection
According to the 1990 census the population has reached 179.3 million, which is the third largest group in Asia after People's Republic of China and India. The population growth rate has declined from 2.2 % per annum in the early eighties to 1.8 % at present due to the success with the family planning program.
The domestic primary energy supply in 1995 was accounted around 4594 PJ and was dominated by crude oil with 41 % and by biomass, as a traditional form of energy, which contributed 31 %. Natural gas supplied 18 % of the domestic energy consumption. The remainder was shared by coal (6 %) and hydropower together with geothermal energy (4 %).
capacity. Another often-cited reason, low domestic prices of diesel, is a consequence of this shortcoming. Faced with the dilemma that industries need electricity and that PLN cannot meet the industrial demand, the government of Indonesia set the diesel price at low level in order to enable industries to generate electricity at a competitive price.
Table 1. Social, Economic and Energy Indicator
Unit 1990 1991 1992 1993 1994 1995
Population 106 179 182 184 186 192 195 GDP/capita US $ 1983 642 676 712 753 776 821 Primary Energy Demand PJ 2485 2524 2463 2999 4317 4594 Electricity Supply TWh 35 39 42 47 52 59 Electricity/capita kWh 195 213 228 251 268 304
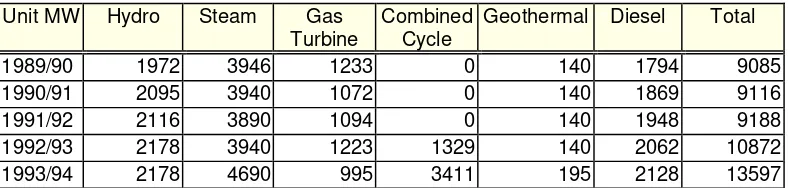
Table 2. PLN Installed Capacity
1989/90 1972 3946 1233 0 140 1794 9085 1990/91 2095 3940 1072 0 140 1869 9116 1991/92 2116 3890 1094 0 140 1948 9188 1992/93 2178 3940 1223 1329 140 2062 10872 1993/94 2178 4690 995 3411 195 2128 13597
Table 3 summarizes the energy resource compared to utilization in 1990. The situation of the fossil energy reserves is characterized by limited oil reserves, sufficient gas reserves and abundant coal reserves. The oil reserves were estimated to be 10.731 billion barrels. The proven and potential gas reserves are estimate at about 101.8 x 10¹² scf. Unfortunately, the most of the reserves have a 70 % CO2 content that need large investments to develop the field,
to process the gas, and to dispose CO2 into the reservoir. Coal is found predominantly in east
and south Kalimantan and central and south Sumatera. The total resources are estimated in 1992 at 34.305 billion tonnes. More than 65 % of Indonesian coal is lignite most is found in south Sumatera. Most of coal reserves have characteristic a low ash, low sulphur and high volatile matter content.
Table 3. Energy Resource and Production
Oil
Jawa 1.325 12.4 0.061 4.2 7.80
Sumatera 8.324 64.1 24.776 15.6 4.90
Kalimantan 1.002 24.4 9.361 21.6
-Other Islands 0.080 0.9 0.107 33.6 3.40
Total Reserves 10.731 101.8 34.305 75.0 16.10
Production in 1990 0.470 2.1 0.011 -
Indonesia has a large hydropower potential of 75 GW. Until 1990, only 2.2 GW was used for electricity generation. The total geothermal has been estimated to be 16.1 GW. Jawa and Bali have nearly half of the reserves. Intensive exploration must be carried out in order to develop geothermal reserves. A constraint is also geothermal steam pricing. Therefore, in 1991 only 140 MW has been used in Kamojang and 220 MW are under development.
The population forecasts continue to decline because family planning policy is attempting to further reduce this rate. The population growth rate decline to 0.87 % per annum by the year 2023. Meanwhile the GDP grows on average 6 % per annum in the future. Because of the still increasing population the GDP per capita grows at a rate of 4.6 % per annum. It will increase from US $ 630 per capita in the year 1991 up to about US $ 2,430 per capita in the year 2021 (in 1991 prices). The major assumptions behind the economic scenario are:
- Non-oil exports continue to grow at a sound though markedly lower rate than in the past. Excluding LNG exports, growth in non-oil exports will average 7.1 % per annum until the year 2023.
- Imports of goods and services other than related to oil or oil industries will decline slightly in relative terms.
- By the end of 1990, Indonesia's oil reserves (proven and potential) amounted to 1.46 billion tonnes (10.7 billion barrels).
- Oil exports will decline and end in the year 2008. Oil imports will grow fast after the year 2001.
- The real oil price on the world market has been assumed not to significantly up to and including the year 1995, increasing thereafter by about 2.0 % per annum on average.
- LNG exports reach 29 million tonnes in the year 2000 and remain level until the year 2011. Then they will decline due to the lack of exportable gas. LPG exports are expected to reach a maximum of 3 million tonnes after the year 2004.
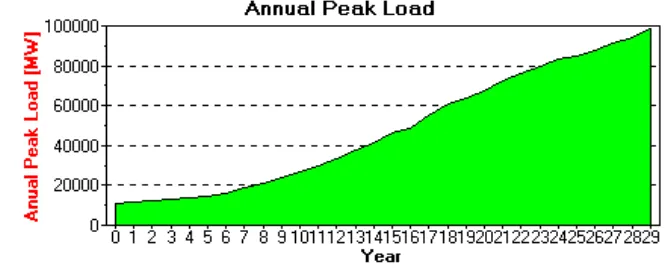
Population growth and GDP growth are the main factor for the electricity demand. The electricity demand grows by 8.2 % per annum from about 52 TWh in 1991 to 556 TWh in the year 2021. About 70 % are consumed in the industrial sector, which has an average growth rate in electricity consumption of 8.5 % annually. Regarding households, the growth potential is highest in rural areas. While 75 % of urban households were electrified at the end of the year 1989, this applied to only 25 % of rural households. Electricity consumption by electrified households is much lower in rural areas. Figure 1 shows the annual peak load that used in this study.
4. Case Study and System Configuration
In this study, 1991 is used as based year. The projection period of the study is 30 years; from 1991 to 2020; each year period have 2 period, i.e. dry season and wet season. Discount that used in the study is 10 %. The DECADES tools are used to make comparative assessment in this study. Table 4 shows the fuel groups, i.e. domestic coal, imported coal, natural gas, fuel oil and geothermal.
Table 4. Fuel Groups
The power plant is divided into two groups, i.e. fixed system and variable system. The fixed system power plant is the power plants from existing, under construction, and under planning power plants. While, the variable system power plant is only the chosen power plants that have possibility to be developed in the future. Fixed system include Asahan and Saguling hydropower 600 MW, Suralaya coal fired power plant 400 MW, geothermal power plant 55 MW, oil fired power plant 250 MW, gas turbine power plant 100 MW, and gas combined cycle power plant 225 MW. The variable system is Paiton coal fired power plant 600 MW, geothermal power plant 55 MW, gas combined cycle power plant 250 MW and AP 600 nuclear power plant.
5. Study Result
The DECADES tools design to make comparative assessment framework for electricity generation. This framework covers activities such as establishment of inventories (technologies, fuels, materials), assessment of economics performances, human health and environmental impacts at power plant, full energy chain and electricity generation system levels, valuation and internalization of external costs associated with generating electricity, macro economic impact analysis and decision making. Comparative assessment is a multidisciplinary activity requiring expertise in energy and electricity planning, life cycle assessment, risk analysis, health and environmental impact analysis and decision theory. The current DECADES tools are still developed and could not handle all of the frameworks for comparative assessment.
Some of result from using DECADE tools has described in this section. In this case the model only running for screening process. The optimization process is not taken into account due to limitation of time and running model using optimization process is too slow.
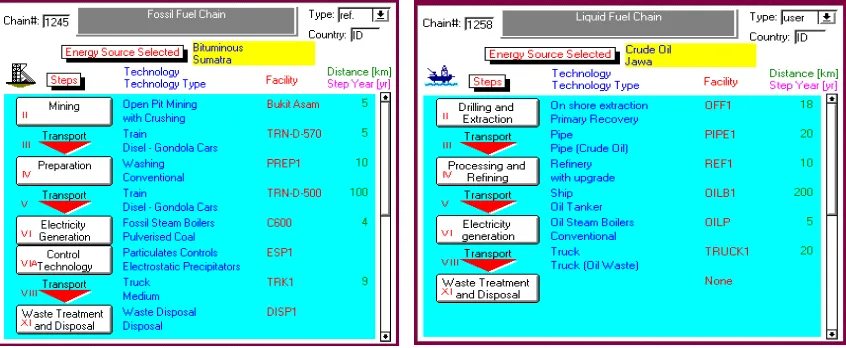
Figure 2. Solid Fuel and Liquid Fuel Energy Chain
Only thermal system could display the electricity generation capacity graph as shown in Figure 3. In the year 2020, coal power plants capacity will gain a share of some 80 per cent, accompanied by gas turbines (10 per cent) for meeting the demands. The nuclear power plant is not economic in this study.
Figure 3. Electricity Generation Capacity (Thermal System)
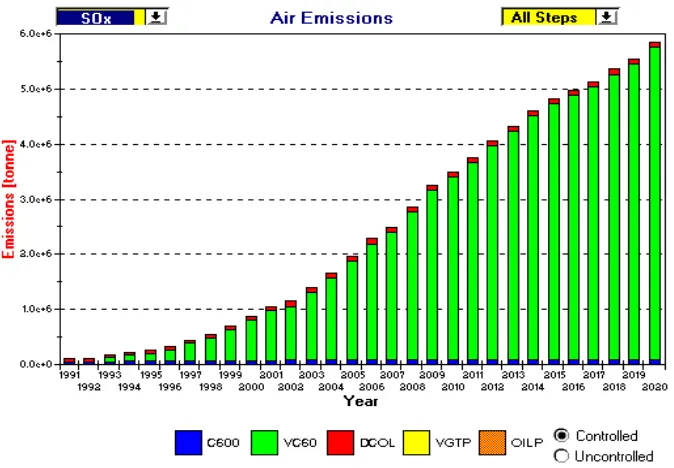
Figure 4. Capacity Added
Figure 4 show the SOx emission from power plant. The coal-fired power plants have biggest share for this emission. In this study there are no abatement technology for SOx emission. In the future some abatement technology like De-SOx and using IGCC technology should be taken into account.
6. Conclusion and Comment for DECADES Software
6.1 Conclusion
- Abundant coal reserves (34 x 109 ton) made coal attractive as the major fuel for power plant in Indonesia.
- The environmental impact of coal supply will be fast growing due to coal-fired power plant development.
- The electricity capacity added in 2006 and 2009 is about 8000 MW. It is difficult to be realized.
6.2 Comment for DECADES software
The DECADES software is under development. There are some errors in this software and need to be fixed soon. The disadvantage of using this software is very slow if work using network, therefore need to improve using high speed processing or using new version of Paradox.
Reference
1. International Energy Agency (1993), The IEA Energy Balance and Statistics Database, on diskette.