http://dx.doi.org/10.17503/Agrivita-2012-34-1-p075-083
STABILITY OF WHEAT GENOTYPES ADAPTED
IN TROPICAL MEDIUM AND LOWLAND
Sumeru Ashari1*), Budi Waluyo1), Izmi Yulianah1), Niken Kendarini1) and Mohammad Jusuf2) 1)
Department of Agronomy Faculty of Agriculture, University of Brawijaya Jl. Veteran Malang 65145 East Java Indonesia
2)
Indonesian Legumes and Tuber Crops Research Institute (ILETRI) Jl. Raya Kendalpayak km 8, PO Box 66 Malang 65101 East Java Indonesia
*) Corresponding author Phone: +62-341-551611 E-mail: [email protected]
Received: January 12, 2011/ Accepted: March 10, 2012
ABSTRACT
The research objective was to select wheat genotypes that can adapt on the medium and low plains. Twenty-seven genotypes and three varieties of wheat were grown in four locations in the medium and low plains since June-October 2009. The experiments were arranged using a randomized complete block design repeated three times. Analysis of variance performed at each location followed by a test of homogeneity of error range, the combined analysis of variance and yields stability analysis. Genotype x environment interaction significantly affecting yield. Stable genotypes and widely adaptable across locations were G-1 (1.94 t.ha-1), G-20 (1.24 t.ha-1), H-14 (1.85 t.ha-1), H-19 (1.59 t.ha-1), H-20 (1.69 t.ha-1), H-21 (1.48 t.ha-1), 162 (1.62 t.ha-1), 80 (1.63 t.ha-1), 82 (1.78 t.ha-1), 91 (1.49 t.ha-1), and 142 (1.45 t.ha-1). Genotypes adapted in productive environment were G-18 (1.23 t.ha-1), G-19 (1.63 t.ha-1), 185 (1.30 t.ha-1), 40 (1.33 t.ha-1) and 42 (1.52 t.ha-1). Genotypes adapted in marginal environments were 28 (2,22 t.ha-1), H-1 (1.61 t.ha -1
), H-8 (1.65 t.ha-1) and H-16 (1.68 t.ha-1). Genotype was selected as an improvement material in the wheat breeding in medium and lowland of tropical regions.
Keywords: wheat selection, tropical, yield stabi-lity and adaptabistabi-lity
INTRODUCTION
Wheat is one of the important food crops in Indonesia. Increasing demands of wheat as raw material are used for noodles, cakes, bread and other food industries, so that wheat is almost a staple food after rice in Indonesia. FAO data
(2007) showed that consumption of wheat in Indonesia in 1990 only 9.14 kg/capita/year, and in 2005 increased to 20 kg/capita/year. The availability of wheat in Indonesia is still met from imports, so it is vulnerable to the fluctuation of raw material shortages and price that can threaten the stability of the national economy. Therefore, the fulfillment of domestic wheat can be done with the planting of wheat in Indonesia.
The spread of wheat in the world located in areas with an average temperature of 15-25oC. Wheat can grow and produce well at temperatures 20-25oC and optimal growth is achieved at a temperature of 4-31 ° C. Wheat cultivation in the tropics is strongly influenced by physical factors, especially climate because of incompatibility may cause failure of the harvest season (Azwar et al., 1988). Climatic factors that determine the growth and production including rainfall, temperature and humidity (Azwar, 1987; Bahar et al. 1988 and Ismal, 1984). High rainfall resulted in higher intensity of disease caused by the fungi Fusarium and Helminthosporium, attacking each panicle and leaves (Azwar et al., 1988). High temperatures reduce harvest day plant and yield components such as the amount of leaves, plant height, productive tiller and number of flowers (Rawson, 1987).
Constraints faced in wheat cultivation in Indonesia is still limited to wheat growing environments on high plains with a relatively low temperature and low humidity. While the potential area of wheat cultivation in the medium and lowland plains. Wheat varieties released in Indonesia i.e. cv. Timor, Nias, Selayar, and Dewata are encouraged to be planted in the highlands, with the yield average 2.98 t.ha-1. Several studies demonstrate the potential yield of wheat in the highlands of Malino (1350 m asl)
can achieve 3-5 t.ha-1 (Hamdani et al, 2002), in the Urut Sewu, Boyolali (675 m asl) ranged between 0.71-2.34 t.ha-1 (Dahlan et al, 2003), and in Tosari (1850 m) potential yield reached 6.5 t.ha-1 (Pabendon et al., 2010). Saunders (1988), argued that with irrigation, fertilization and maintenance of appropriate wheat yields could reach 5 t.ha-1and will decrease on a lower altitude. Aggarwal and Penning de Vries (1989) demonstrated the potential of wheat with good irrigation ranged from 3-5 t.ha-1, and yields will higher at altitudes between 500–2000 m asl.
Varieties of wheat for the tropics should have a resistance to environmental variability, particularly heat stress, drought and marginal land, in addition to resistance to major pests and diseases as well as seed germination before harvest (Villareal et al.,1984). Wheat genetic manipulation is an appropriate way in order to obtain potential genotypes that adapt in plain medium and lowland tropical areas. Evaluation of the introduction and selection of wheat lines from segregating populations have been conducted (Kusmana and Subandi, 1985; Dasmal et al., 1992; Supriyanta et al., 2007).
Wheat crops grown at several locations with different altitudes showed different yield results (Bahar et al., 1988). Genotype x environment interaction is limiting factor that can cause the expression of plant is not optimal so making it difficult for breeders to select high yielding genotypes. Genotype and environment interactions is a form of process plants adapt to the environment so that these plants can survive and breed in different environmental conditions (Nor and Cady, 1979). This is because the environment always affects the genetic potential of plants to express and plants will hold a different response to the complexity of different environmental (Gardner et al., 1985), and this phenomenon causes plants infrequent express the maximum potential yield (Kramer , 1980). Nor and Cady (1979) argue that the seeds yield are very important criteria in evaluating the adaptability and yield stability of a genotype. Measurement of the relative stability of the appearance of a genotype or population of plants in a broad range of areas is crucial to determine the efficiency of plant breeding program (Liang et al., 1966).
Planting wheat in several locations, including medium and lowland plains is one way to obtain an adaptive genetic material in
accordance with the desired target environment. Development of wheat cultivar can be customized for a variety of different environments or in specific environment is the ultimate goal for breeding programs. Adaptation to varying environments can be known from the level of interaction with different environments. Genotypes considered to be more adaptive or stable if it has an average high yield but have low fluctuations if planted in a very diverse environments. According to Becker and Leon (1988) success in develop a new variety must show superior yield and other important agronomic characters. They need a reliable advantage on a variety of environmental conditions. Plant breeders generally agree on the importance of yield stability.
Selection of wheat genotypes based on response to environmental changes expected will determine the potential for widespread genetic yield results will be passed to offspring. If a potentially unstable genotype which means adapting to a specific area or to adapt the environment so these genotypes have adapted these genes. According to Allard and Bradshaw (1964), stability is needed in dealing with unpredictable environments. Allard (1999) put forward a character would be if there is a gene expression control and to be in the right environment, and some characters will not express themselves even in the right environment if the genes controlling these characters do not exist.
regression is zero than if the value of regression coefficient (b) equal to one then has the appearance of a stable genotype in the whole environment that has a wide adaptability. If b> 1 indicates stability below average, genotypes having the appearance of which is sensitive to environmental changes and can only adapt in a productive environment. If the value b <1 then the stability of the genotypes have above average but were not sensitive to environmental changes, and these genotypes adapted to the environment that is not productive. Based on the analysis of stability and this adaptation is expected to be selected wheat genotype genotype-environment adaptable to medium and low tropical plains.
MATERIALS AND METHODS
Research were conducted at four locations that include lowland (300 m asl) namely Ngajum (Malang) and Muneng (Probolinggo), and medium plain (600 m asl) namely Tumpang (Malang), and Dau ( Batu). The experiment was conducted from June to October 2009. Thirty genotypes of wheat were used, which consists of 27 lines and three varieties as checks, which are Dewata, Nias, and Selayar, Urea 100 kg.ha-1, SP36-100 kg.ha-1, and KCl 100 kg.ha-1.The instrument used is a set of wheat cultivation tools, measuring tools, labels, and stationery.
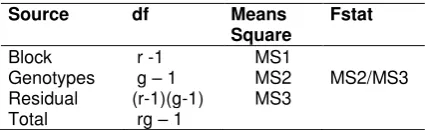
Experiments at each location were based on the experimental method using a randomized block design (RBD). Thirty genotypes of wheat were used as treatment was repeated three times. Each genotype was planted in plots of size bed 1.2mx 5m. Each plot consisted of 12 rows. Analysis of variance performed at each location to investigate the diversity of genotypes at each location (Table 1).
Prior to conducting combined analysis, the error variance at each location tested based on Bartlett (LeClerg, 1962; Petersen, 1994):
location, a = location numbers. If ratio value M/C is smaller than the value table of Chi-square20.05;
, then the error variances are not hetero-geneous, so it can be combined variance analysis based on Singh and Chaudhary (1979) and Mclntosh (1983) to assess the effect of genotype x environment interaction (Table 2).The difference of genotype means yield were tested with the method of Scott-Knott grouping analysis (Gasperz, 1992). Stability of the yields were analyzed using a linear model of Eberhart and Russell (1966):
ij genotypes on environmental index indicating genotypes response to environmental variation,
the j-th environment, v = number of genotypes, n = number of environments.A genotype is stable if it has the appearance
of the regression coefficient
significantly different from the zero.
Table 1. Analysis of variance for randomized block design in a location
Source df Means
Table 2. Combined analysis of variance for randomized block design across location
Source Degree of Freedom
(df)
Means Square (MS)
Fstat
Locations l-1 MS1 MS1/MS2
Replication (Locations) L(r-1) MS2
Genotypes g-1 MS3 MS3/MS4
Genotypes x Locations (g-1) (l-1) MS4 MS4/MS5
Residual l(r-1) (g-1) MS5
Total Rlg-1
Adaptation of genotypes determined by Finlay and Wilkinson (1963). If deviation of a genotype is zero and has a value of b> 1, then the genotype is responsive to the productive environment so that these genotypes adapted to a productive environment. If a genotype has a value of b <1, then the genotype is less responsive to environmental changes so that these genotypes adapted to the environment less productive. Analysis of variance using the software DAASTAT (Onofri, 2006), different test of Scott-Knott clustered using SASM-Agri (Althaus et al., 2001), and the adaptation and yield stability analysis using CropStat 2.7 for Windows (Crop Research Informatics Laboratory, 2007).
RESULT AND DISCUSSION
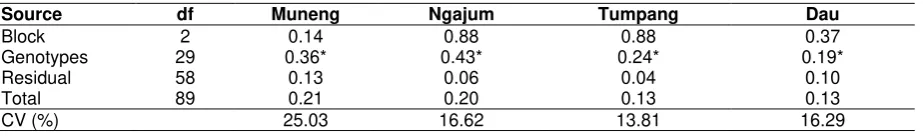
Analysis of variance at each location showed the differences in genotypes performance grown in the all locations (Table 3). It was showed
that yield differences by environmental difference. Differences in respon-se shown by the difference of the grain at each site and there were differences in genetic potential possessed by the genotype of wheat.
Bartlett test of homogeneity showed the error variance in the four locations are not heterogeneous (Table 4) so combined analysis of variance conducting to predict the effect of genotype x environment interaction.
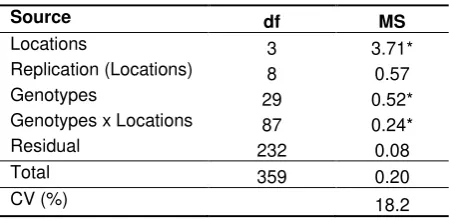
Combined analysis of variance showed that there was genotype x environment interaction effect on the performance of wheat (Table 5). This means that wheat genotypes requires a suitable environment so that there is an appearance of wheat genotypes is not consistent in different environments and rank performance genotypes tested were changed at each location. In addition, location and genotype also contributed to the differences in yields.
Table 3. Means square wheat yields (t per ha) in each location
Source df Muneng Ngajum Tumpang Dau
Block 2 0.14 0.88 0.88 0.37
Genotypes 29 0.36* 0.43* 0.24* 0.19*
Residual 58 0.13 0.06 0.04 0.10
Total 89 0.21 0.20 0.13 0.13
CV (%) 25.03 16.62 13.81 16.29
Table 4. Analysis of error variance homogeneity according to bartlett’s test
Locations s2 ln(s2)
Muneng 0.13 -2.04
Ngajum 0.06 -2.81
Tumpang 0.04 -3.22
Dau 0.1 -2.30
Sum 0.33 -10.38
M 22.93
C 1.01
M/C 22.76ns
20.05;58
76.78Remarks: s2 = residual variance, ns = non significant
Table 5. Means square combined analysis of variance wheat yield (t per ha)
Source df MS
Locations 3 3.71*
Replication (Locations) 8 0.57
Genotypes 29 0.52*
Genotypes x Locations 87 0.24*
Residual 232 0.08
Total 359 0.20
CV (%) 18.2
Remarks: df = degree of freedom, MS = means squares, CV = coefficient of variation
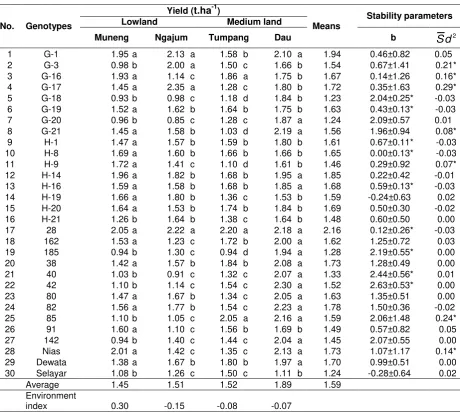
Wheat yields of each genotype at each location reflect changes in rankings as a result of environmental influences. In the lowland Muneng, appearance genotype yield are divided into two groups. Nias and the Dewata have the same appearance yields, and higher than Selayar (Table 6). There are 18 genotypes of wheat that have a similar appearance with the yields of the Dewata and Nias. In the lowland Ngajum, genotypes tested are divided into three groups. Nias and Selayar have the same yields and lower than the Dewata. In Ngajum there are four genotypes that have higher yields compared with the three
checks. In Tumpang, appearance genotypes tested spread into four groups. Nias and Selayar have the grain yield lower than the Dewata. In Tumpang there are three genotypes that have higher performance compared with the yields of the highest checks. In Dau showed that Nias and Dewata have yield that are not significantly different and both showed a higher yield compared to Selayar. Based on the trial, there are two different genotypic groups based on the trait of yield, and 15 genotypes have the appearance of which is not significantly different from Nias and Dewata.
Based on the results of trial at each different location shows that there are changes in the number of genotypes in each group at each location. This indicates there is a change in the performance ranking genotypes and the check varieties. The difference in yield between genotypes at the same location is caused by differences in genetic potential that is owned by genotypes. Changes in genotype rank at different locations due to differences in genotype response differently to the environment to avoid environmental stress. Genotypes are able to exploit environment resources optimally will have the performance of high yield.
Table 6. Yields of wheat genotypes across locations
No. Genotypes
Yield (t.ha-1)
Means
Stability parameters
Lowland Medium land
Muneng Ngajum Tumpang Dau b 2
d
S
1 G-1 1.95 a 2.13 a 1.58 b 2.10 a 1.94 0.46±0.82 0.05 2 G-3 0.98 b 2.00 a 1.50 c 1.66 b 1.54 0.67±1.41 0.21* 3 G-16 1.93 a 1.14 c 1.86 a 1.75 b 1.67 0.14±1.26 0.16* 4 G-17 1.45 a 2.35 a 1.28 c 1.80 b 1.72 0.35±1.63 0.29* 5 G-18 0.93 b 0.98 c 1.18 d 1.84 b 1.23 2.04±0.25* -0.03 6 G-19 1.52 a 1.62 b 1.64 b 1.75 b 1.63 0.43±0.13* -0.03 7 G-20 0.96 b 0.85 c 1.28 c 1.87 a 1.24 2.09±0.57 0.01 8 G-21 1.45 a 1.58 b 1.03 d 2.19 a 1.56 1.96±0.94 0.08* 9 H-1 1.47 a 1.57 b 1.59 b 1.80 b 1.61 0.67±0.11* -0.03 10 H-8 1.69 a 1.60 b 1.66 b 1.66 b 1.65 0.00±0.13* -0.03 11 H-9 1.72 a 1.41 c 1.10 d 1.61 b 1.46 0.29±0.92 0.07* 12 H-14 1.96 a 1.82 b 1.68 b 1.95 a 1.85 0.22±0.42 -0.01 13 H-16 1.59 a 1.58 b 1.68 b 1.85 a 1.68 0.59±0.13* -0.03 14 H-19 1.66 a 1.80 b 1.36 c 1.53 b 1.59 -0.24±0.63 0.02 15 H-20 1.64 a 1.53 b 1.74 b 1.84 b 1.69 0.50±0.30 -0.02 16 H-21 1.26 b 1.64 b 1.38 c 1.64 b 1.48 0.60±0.50 0.00 17 28 2.05 a 2.22 a 2.20 a 2.18 a 2.16 0.12±0.26* -0.03 18 162 1.53 a 1.23 c 1.72 b 2.00 a 1.62 1.25±0.72 0.03 19 185 0.94 b 1.30 c 0.94 d 1.94 a 1.28 2.19±0.55* 0.00 20 38 1.42 a 1.57 b 1.84 b 2.08 a 1.73 1.28±0.49 0.00 21 40 1.03 b 0.91 c 1.32 c 2.07 a 1.33 2.44±0.56* 0.01 22 42 1.10 b 1.14 c 1.54 c 2.30 a 1.52 2.63±0.53* 0.00 23 80 1.47 a 1.67 b 1.34 c 2.05 a 1.63 1.35±0.51 0.00 24 82 1.56 a 1.77 b 1.54 c 2.23 a 1.78 1.50±0.36 -0.02 25 85 1.10 b 1.05 c 2.05 a 2.16 a 1.59 2.06±1.48 0.24* 26 91 1.60 a 1.10 c 1.56 b 1.69 b 1.49 0.57±0.82 0.05 27 142 0.94 b 1.40 c 1.44 c 2.04 a 1.45 2.07±0.55 0.00 28 Nias 2.01 a 1.42 c 1.35 c 2.13 a 1.73 1.07±1.17 0.14* 29 Dewata 1.38 a 1.67 b 1.80 b 1.97 a 1.70 0.99±0.51 0.00 30 Selayar 1.08 b 1.26 c 1.50 c 1.11 b 1.24 -0.28±0.64 0.02 Average 1.45 1.51 1.52 1.89 1.59
Environment
index 0.30 -0.15 -0.08 -0.07
Remaks: Numbers followed by same letter in a column are not significantly different in Scott-Knott grouping method 5%
Analysis of stability and adaptability of wheat genotypes is needed to determine the consistency of performance ratings and yield of wheat in a large environment. The results show that there are 12 genotypes tested that have a stable performance in all locations (Table 6). Stable genotypes have a regression coefficient equal to one and deviation is zero. This shows the genotypes yields linear to environmental productivity. Stable genotypes can be used as materials to develop superior cultivars of wheat in tropical areas, medium and low alti-tude. Selected genotype is G-1 (1.94 t.ha-1),
G-20 (1.24 t. ha-1), H-14 (1.85 t. ha-1), H-19 (1.59 t per ha) , H-20 (1.69 t per ha), H-21 (1.48 t per ha), 162 (1.62 t per ha), 80 (1.63 t per ha), 82 (1.78 t per ha), 1991 (1.49 t per ha), and 142 (1.45 t per ha).
Wilkinson, 1963). Usually these genotypes respond strongly to environmental changes in the extreme. If the genotype is given a highly productive environment then these genotypes will have high yield, and if the environment becomes marginal then these genotypes will have a very low yield. To obtain a high yield the genotypes should be developed at a specific location or at the optimum environment conditioned and released as a superior site spe-cific local varieties.
In this research also acquired a potential wheat developed in marginal environments, i.e. 28 (2.22 t.ha-1), H-1 (1.61 t.ha-1), H-8 (1.65 t.ha-1) and H-16 (1.68 t.ha-1). Suitable wheat developed in marginal environments characterized by the regression coefficient values below one and the deviation is zero. Coefficient values below one indicate the genotype is less responsive to environmental changes (Finlay and Wilkinson, 1963). Genotypes are not responsive to environ-mental conditions that productive. Although genotyping is conditioned on a highly productive environment, but it will not increase yield. Genotypes was developed to appropriate specific marginal environments, or is conditioned on marginal environments, such as minimum tillage farming, intercropping or low input. The genotypes that have a deviation value is not equal to zero is a genotype that is difficult to predict the yield outcome in a broad range of environments Eberhart and Russell (1966).
Environmental productivity is one important factor that determines the performance of the crop. Basic causes of differences between genotypes in yield stability is the occurrence of genotype x environment interaction, i.e. the genotype ranking depending on certain environ-mental conditions in which it growth up. In this study, Muneng have high productivity because it has a positive environmental index value is high (Table 6), and other locations including the category of low productivity due to its lower environmental index values and negative.
CONCLUSIONS
Appearance of wheat yield in tropical lowland and medium land is influenced by genotype x environment interactions. Wheat genotypes that have a stable yield outcome and selected in all locations is the G-1 (1.94 t.ha-1), G-20 (1.24 t.ha-1), H-14 (1.85 t.ha-1), H-19 ( 1.59 t.ha-1), H-20 (1.69
t.ha-1), H-21 (1.48 t.ha-1), 162 (1.62 t.ha-1), 80 (1.63 t.ha-1), 82 (1.78 t.ha-1), 1991 (1.49 t.ha-1), and 142 (1.45 t.ha-1). Genotypes of wheat potentially developed in productive environment was G-18 (1.23 t.ha-1), G-19 (1.63 t.ha-1), 185 (1.30 t.ha-1), 40 (1.33 t.ha-1) and 42 (1.52 t.ha-1). Genotypes potentially developed in marginal environments is 28 (2.22 t.ha-1), H-1 (1.61 t.ha-1), H-8 (1.65 t.ha-1) and H-16 (1.68 t.ha-1).
Selected wheat genotypes with wide adap-tation or specific adapadap-tation to environments can be used as materials for genetic recombination of wheat adapt the medium and low altitude tropical regions.
ACKNOWLEDGEMENTS
The authors would like to thank to Directorate General of Higher Education who have financed this research through Competitive Grants Research According To National Priorities Batch III with the title of project: Perakitan varietas unggul gandum tropika No: 6991/J10.2/PG/2009.
REFERENCES
Aggarwal, P.K., F.W.T.Penning de Vries. 1989. Potential and water-limited wheat yields in rice based cropping systems in Southeast Asia. Agricultural Systems 30(1): 49–6 Allard, R.W. 1999. Principles of plant breeding.
2nd ed. John Wiley and Sons, Inc. New York, NY. pp 485.
Allard, R.W. and A.D. Bradshaw. 1964. Impli-cation of genotype-environment in appli-ed plant breeding. Crop. Sci. 4 : 503-507. Althaus, R.A., M.G. Canteri, da E.A. Giglioti. 2001.
Tecnologia da informação aplicada ao agronegócio e ciências ambientais: sistema para análise e separação de médias pelos métodos de Duncan, Tukey e Scott-Knott. Anais do X Encontro Anual de Iniciação Cientí-fica, Parte 1, Ponta Grossa, p.280-281.
Azwar, R. 1987. Wheat adaptation in the tropic: I Genotype environment interaction. Pem-beritaan Penelitian Sukarami 9:3-7 Azwar, R., T. Danakusuma and A. A. Daradjat.
Bahar H., Nasrullah, Soemartono and R. Azwar. 1988. Pengaruh faktor lingkungan ter-hadap hasil terigu (Triticum aestivum L). Pemberitaan Sukarami 15 :13-18
Becker, H.C. and J. Leon. 1988. Stability analysis in plant breeding. Plant Breeding 101:1- 23
Crop Research Informatics Laboratory. 2007. Manual of Cropstat for Windows Version 7.2.2007.3. International Rice Research Institute. Metro Manila, Phillipine. 391 pp. Dahlan M., Rudjianto, J. Murdianto and M.
Yusuf. 2003. Usulan pelepasan varietas gandum Balai Penelitian Tanaman Sere-alia. Pusat Penelitian dan Pengem-bangan Pertanian. Badan Penelitian dan Pengembangan Pertanian.
Dasmal, M. Jusuf and A. Kaher. 1992. Penampilan galur harapan terigu pada tiga jarak larikan. Pemberitaan Penelitian Sukarami 21: 14-17.
Eagles, H.A., P.N. Hinz and K.J. Frey. 1977. Selection of superior cultivars of oats by using regression coefficients. Crop. Sci. 17:101-105.
Eberhart, S.A. and W.A. Russel. 1966. Stability parameter for comparing varieties. Crop. Sci. 6 : 36-40.
FAO (Food and Agriculture Organisation of the United Nations) 2007, FAOStat Databa-se, Rome (http://faostat.fao.org).
Finlay, K.W. and G.N. Wilkinson. 1963. The analysis of adaptation in plant breeding program. Aust. J. Agron. Res : 14:742-754. Gardner, F.P., R.B. Pearce and R.L. Mitchell.
1985. Physiology of crop plants. The Iowa State University Press. pp. 327 Gaspersz, V. 1991. Teknik analisis dalam
pene-litian percobaan. Jilid 1. Tarsito. Bandung Hamdani, M., Sriwidodo, Ismail and M.M. Dahlan. 2002. Evaluasi galur gandum introduksi dan CIMMYT. Prosiding Kongres IV dan Simposium Nasional PERIPI. Universitas Gadjah Mada Yogyakarta.
Ismal. G. 1984. Ekologi tumbuhan dan tanaman pertanian. Universitas Andalas Padang. pp.196.
Kramer, P.J. 1980. Drought, stress, and origin adaptation. In Adaptation of plant to water and high temperature stress. p 7-20. Edited by N.C. Turner and P.J. Kramer. John Wiley and Sons, Inc. New York.
Kusmana, R. and Subandi. 1985. Penelitian pemuliaan terigu 1973 - 1984 di Balittan Bogor. Dalam Subandi et al (eds); Risalah Rapat Teknis dari Hasil Penelitian Jagung, Sorgum dan Terigu. Puslitbang-tan Bogor. p. 203-207.
LeClerg, E.L., W.H. Leonard, and A.G. Clark. 1962. Field plot technique. Burgess Publishing Company. Minnesota. pp 373. Liang, G.H.L., E.G. Heyne, and T.L. Walter. 1966.
Estimate of variety x environmental interactions in yield tests of three small grains and their significance on the breeding programs. Crop Sci. 6:135-139. McIntosh, M.S. 1983. Analyses of combined
ex-periments. Crop Sci. 75:153-155
Nor, K.M. and F.B. Cady. 1979. Methodology for identifying wide adaptability in crops. Agron. J.71: 556-559.
Onofri, A. 2006. EXCEL macros to perform basic statistic analysis on routine agricultural experiments. Dipartimento di Scienze ed Ambientali (DSAA).Borgo XX Giugno. Perugio, Italy.
Pabendon, M.B., R. Haeruddin and M. Hamdan. 2010.Kemajuan pemuliaan gandum tropis. Warta Penelitian dan Pengembangan Per-tanian. 32(4):3-4
Petersen, R.G. 1994. Agricultural field experi-ments: Design and analysis. Marcel Dekker, Inc. New York. Basel. Hongkong. pp 409.
Rawson, H.M. 1987. Effects of high tempe-ratures on the development and yield of wheat and practices to reduce dekterions effects. p 44-62. In. A.R. Klatt (ed). A proceedings of the International Conference. January 19-23, 1987. CIMMYT.
Saunders, D.A. 1988. Characterization of tropical wheat environments: Identification of production constraints and progress achieved in South and South East Asia. In: Klatt AR (ed) Wheat Production Constraints in Tropical Environments. CIMMYT, Mexico DF. p 12-26
Supriyanta, ,A. Sariningtyas, B. Kurniasih, C. Sumardiyono and A. Priyatmojo. 2007. Pewarisan ketahanan tanaman gandum (Triticum aestivum) terhadap penyakit bercak daun Helminthosporium ( Helmin-thosporium sorokianum. Ilmu Pertanian (14) 1: 46-55
Tan, Wai-Koon, Geok-Yong Tan and P.D. Walton. 1979. Regression analysis of genotype-environment interaction in smooth brome-grass. Crop Sci. 19:393-396.