38
RESEARCH METHOD
In this chapter, the writer discussed about research type, research design, population and sample, instrumentation of the study, instrument try out, data collection procedure, data analysis procedure.
A. Research Type
In this study, the writer used a quantitative approach because this approach is qualified to collect statistical data to answer the problems of this study. Then, the writer measured the students‟ score by the tests; pre-test and post-test. According to Creswell:
”a quantitative study, consistent with the quantitative paradigm, is an
inquiry into a social or human problems based on testing a theory composed
of variables, measured with numbers, and analyzed with statistical
procedures, in order to determine whether predictive generalizations of the
theory hold true”.1
B. Research Design
The design of this study was experimental design because the writer measured the effect of series picture on the students‟ ability in writing
narrative text.2
1
John W. Creswell, Qualitative and Quantitative Approach, 1994, California: SAGE Publications, Inc, 1994, p. 2.
2
In this study, the writer used quasi-experimental design. Quasi-experimental design are similar to randomized Quasi-experimental research in that involve manipulation of an independent variable but differ in that subjects are not randomly assigned to treatment group.3 There were many situations in educational research in which is not possible to conduct a true experiment. Neither full control over the scheduling of experimental conditions nor the ability to randomize can be always realized.4
The writer used nonrandomized control group pre-test post-test design with a kind of treatment. There were two groups in this model, control group and experimental group. Both of group given pre-test (Y1 and Y2) before having treatment. The treatment was given to the experimental group only (X). Post-test was given for both of groups to measure the students‟ score after the treatment was given (Y1 and Y2). The scheme of model was:
Table 3.1
The Scheme of Quasi Experimental Design Nonrandomized Control Group, Pretest-Posttest Design
Subject Pre-test Treatment Post-test
E Y1 X Y1
C Y2 - Y2
Where:
E: Experimental Group
C: Control Group
X: Treatment
3
Ibid, p.316.
4
Y1: Pretest
Y2: Posttest
The students divided into two groups, experimental group and control group. In this experimental, the writer was taught the students directly with the same material. Therefore, the used of picture series as media in teaching writing was applied on experimental group only. For the control group, the writer was taught by using conventional approach. The writer explained the conventional approach when the teacher taught the students by using textbook without media like picture. Meanwhile, the control group is not given the treatment.
C. Population and Sample
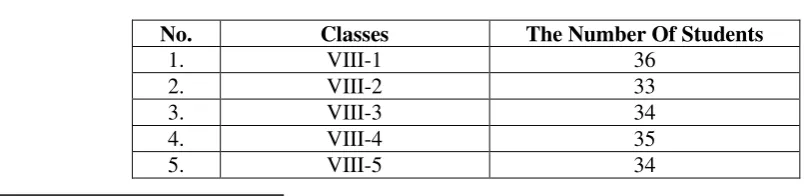
A population was defined as all members of any well-defined class of people, events, or objects5. The population of this study was the all students at eight grade of SMPN-8 Palangka Raya. It consisted of eight classes. The number of the population of the students was 269 students. It showed in the table below.
Table 3.2
The Number of Population of the Eight Grade Students of SMPN-8 Palangka Raya
No. Classes The Number Of Students
1. VIII-1 36
2. VIII-2 33
3. VIII-3 34
4. VIII-4 35
5. VIII-5 34
5
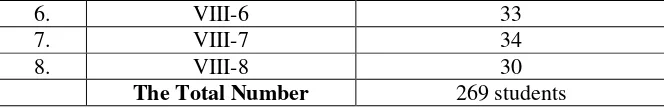
6. VIII-6 33
7. VIII-7 34
8. VIII-8 30
The Total Number 269 students
A sample is the small group that is observed6. The sample of this study was two classes. They are class VIII-4 and Class VIII-5. To take sample, the writer used a cluster sampling. Cluster sampling refers to groups or chunk of elements that would heterogeneity among members within each group are chosen for study.7 Cluster sampling is a sampling in which intact groups, not individual. Cluster sampling is sometimes used in educational research with the classroom as the unit of sampling. The writer chosen cluster sampling because the score of population are heterogeneity. According to the teacher, the class VIII-4 and class VIII-5 have represented average English achievement of whole the population. So, it helped the writer to choose that class as sample of the study. The sampling shown in following table:
Table 3.3
The Number of Sample of the Eighth Grade Students of SMPN-8 Palangka Raya
No. Classes Number of Students
1) VIII-4 35
2) VIII-5 34
Total Number 69 students
6
Ibid, p. 138
7
In this study, the VIII-4 class was considered as the experimental group who taught using picture series and VIII-5 class as the control group who taught using conventional approach.
D. Instrumentation
The data were very important in the study; it helped the writer to find the aims of the study. They were to measure the effectiveness of series picture toward students‟ ability in writing narrative text at the eighth grade students of
SMPN-8 Palangka Raya.
This part explained the test, as a research instruments, used to collect the data. It coverts test types, test construction, scoring method, and test validity and reliability, normality and homogenity.
1. Test Type
2. Test Construction
The test construction was based on the objective of the study. The study is aimed at finding the effectiveness of using series picture in writing narrative text. To investigate the effectiveness of using series picture, the subjects were assigned to write narrative text with using series picture and without using picture series. There were two tests Pre-test and Post-test. The result of the two tests was investigated using statistical analysis and the outcomes were compared to see the effects of using a picture series on writing. The pre-test was given to both classes that would be assigned as the sample of the study. The pre-test conducted on March 10, 2014 for Experimental group and March 10, 2014 for the Control group. And then, the writer gave post-test to both classes after giving the treatment. It conducted on April 21, 2014 for the experimental group and April 21, 2014 for the control group.
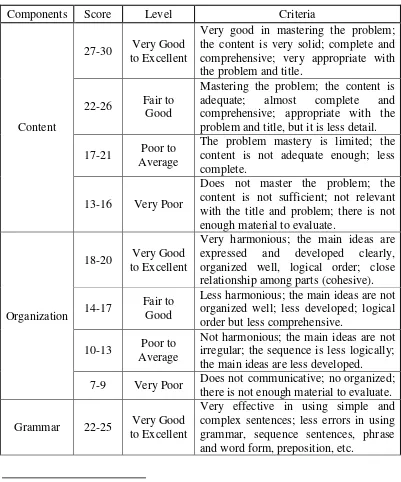
3. Scoring Method
sub skills on which a rater basis his or her judgment.8In this study the writer used analytic scoring method in evaluating the students; final composition.
Table 3.4 the Scoring rubric for the Measurement of Writing Test9
Components Score Level Criteria
Content
27-30 Very Good to Excellent
Very good in mastering the problem; the content is very solid; complete and comprehensive; very appropriate with the problem and title.
22-26 Fair to Good
Mastering the problem; the content is adequate; almost complete and comprehensive; appropriate with the problem and title, but it is less detail. 17-21 Poor to expressed and developed clearly, organized well, logical order; close relationship among parts (cohesive). 14-17 Fair to
Good
Less harmonious; the main ideas are not organized well; less developed; logical order but less comprehensive.
10-13 Poor to Average
Not harmonious; the main ideas are not irregular; the sequence is less logically; the main ideas are less developed. 7-9 Very Poor Does not communicative; no organized;
there is not enough material to evaluate. Grammar 22-25 Very Good
to Excellent
Very effective in using simple and complex sentences; less errors in using grammar, sequence sentences, phrase and word form, preposition, etc.
8
Sabarun, The Effectivenes of Using Outlines in Writing Expository Essay, STAIN: Palangka Raya, 2010, p.29
9
18-21 Fair to Good
Effective in using simple sentences; some difficulties in using complex sentences; some errors in using grammar, sequence sentences, phrase and word form, preposition, etc.
11-17 Poor to Average
Error and difficult in using simple and complex sentences; most errors in using grammar, sequence sentences, phrase and word form, preposition, etc.
5-10 Very Poor
Almost not mastering the grammar; full errors in grammar; cannot be mastery in word form and formation. 14-17 Fair to
Good
Repertory of words is enough; the chosen and use of words occasional not exactly, but the meaning not obscured. 10-13 Poor to until can not communicate the meaning; less informative to evaluate.
Punctuation
5 Very Good to Excellent
Comprehence to the punctuation; less error in spelling, punctuation, the use of capital letter, arrange of paragraph.
4 Fair to spelling and writing; difficult to read the writing; main content and meaning are hazy.
2 Very Poor
4. Test Validity
Validity refers to the extent to which an instrument measures what it is intended to measure.10 The validity of test was the extent to which it measures what it is supposed to measure and nothing else. Heaton stated that every test whether it is a short, informal classroom test or a public examination should be as valid as the constructor can make it.11 Validity was classified into content, construct, and face validity.
1) Face Validity
Face validity was an estimate of whether a test appears to measure a certain criterion; it does not guarantee that the test actually measures phenomena in that domain. The face validity of the test items as follow:
1) The form of test items is essay test.
2) The evaluation by essay test based on scoring method. 3) Kind of the essay test is writing narrative text.
4) The language of items uses English.
5) The essay test is suitable to Junior High School. 2) Content Validity
Content validity was essentially and of necessity based on the judgment, and such judgment must be made separately for each situation.12 It refers to
10
Donald Ary, Lucy Cheser Jacobs, Chris Sorensen, Asghar Razavieh, Introduction to Research in Education (3th edition), New York: Holt, Rinehart and Winston, Inc, 1985, p.213
11
J.B.Heaton, Language Testing,………, 1987, p. 155
12
whether or not the content of the manifest variables is right to measure the latent concept that is trying to measure.
3) Construct Validity
Construct validity was concerned with the extent to which a test measures a specific trait or construct.13 It is related to the theoretical knowledge of the concept that wants to measure. The meaning of the test scores is derived from the nature of the tasks examines are asked to perform.14
In this study, the validation of instruments was mainly directed to the face and content validity that is to make the test items (contents) match with what is supposed to measure. Related to writing test, the content validity can be checked by examining the agreement between the objectives of the course and the test used to measured the objective. Then, in terms of the face validity, the test assigns the students to write a narrative text. Next, construct validity meant that the test really measure the intended construct.15 Here, the writer wants to measure the students‟ ability in writing narrative text and the type of
test is writing test. The writer used product moment correlation as the formula to calculate the validity from the test result (see in appendix 10).
rxy = ∑ ∑ ∑
√ ∑ ∑ ∑ ∑
13
Donald Ary, Introduction to research in Education; third edition,…. 1985, p 218
14
Mohammad Adnan Latief, Tanya Jawab Metode Penelitian Pembelajaran Bahasa, Malang:Universitas Malang Press, 2010, p.134
15
Where:
rxy : Index Correlation Number “r” Product Moment. N : Number of Cases.
∑XY : Multiplication Result between score X and Score Y. ∑X : Total Value of Score X.
∑Y : Total Value of Score Y. Interpretation:
rxy > rt = Valid rxy < rt = Invalid
Riduwan in Mayasyarah states the criteria of interpretation the validity:16 0.800 – 1.000 = Very High Validity
0.600 – 0.799 = High Validity 0.400 – 0.599 = Fair Validity 0.200 – 0.399 = Poor Validity 0.00 – 0.199 = Very Poor Validity 5. Test Reliability
The reliability of a measuring instrument was the degree of consistency with which it measures whatever it is measuring. This quality was essential in any kind of measurement.17 Reliability was concerned with how consistently we are measuring whatever we are measuring. This is the
16
Mayasyarah, The Effectiveness of Video Compact Disc as an Audiovisual Medium toward The Students’ Listening Comprehension Score of The Tenth Grade Students at MAN Model of Palangka Raya, Unpublished Thesis, p. 18.
17
characteristic of test in the reliability. To measure the reliability of the whole test can be estimated by using the formula of Alpha method18.
In rather reliability, there were inter-rater reliability and intra-rater reliability. Inter-rater reliability is the consistency of the judgment of several raters on how they see a phenomenon or interprete the responses of the subject.19 It indicates accuracy in scoring compositions of two different raters. Meanwhile, intra-rater reliabilty referred to the consistency of the rater in scoring the same paper at two different points of time. It points out an individual accuracy in scoring a particular composition.
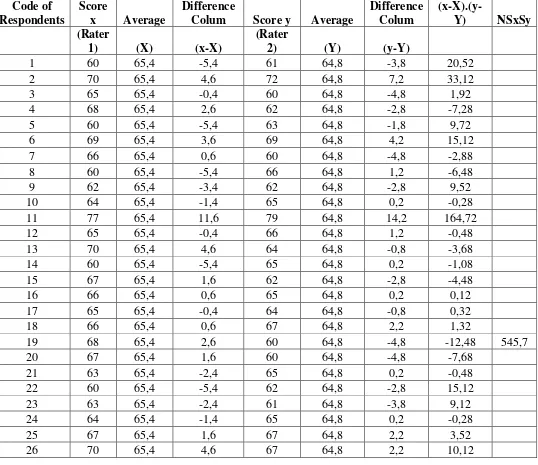
In this study, the writer used reliability in the terms of inter-rater reliability. Inter-rater reliability estimates the reliability of two scores which are gained from two testers for the same subjects of the test.20 Therefore, the test have be done by two testers, the score has high reliability. The first rater was the writer of this study and the second rater was the English teacher at SMPN-8 of Palangka Raya. To obtain inter rater reliability; the scores of the two raters were correlated using Product Moment Correlation calculation. Then, the writer got the interpretation of coefficient correlation, whether they belong to high, moderate, or weak positive/ negative inter rater reliability category. In order to find concurrent reliability used Product Moment Correlation.
18
J.B.Heaton, Language Testing..., p.157
19Ibid,
p. 367
20
Table 3.5 Inter-rater Coefficient Correlation and Interpretation
Correlation Coefficient Interpretation
.90 to 1.00 or -. 90 to - 1.00 Very high positive or negative correlation .70 to .89 or -.70 to - .89 High positive or negative correlation .50 to .69 or -.50 to -.69 Moderate positive or negative correlation .30 to .49 or -.30 to -. 49 Low positive or negative correlation .00 to .29 or -.00 to -.29 Little if any correlation
27 62 65,4 -3,4 64 64,8 -0,8 2,72
28 69 65,4 3,6 68 64,8 3,2 11,52
29 62 65,4 -3,4 62 64,8 -2,8 9,52
30 66 65,4 0,6 60 64,8 -4,8 -2,88
31 70 65,4 4,6 76 64,8 11,2 51,52
32 69 65,4 3,6 62 64,8 -2,8 -10,08
33 64 65,4 -1,4 66 64,8 1,2 -1,68
34 65 65,4 -0,4 64 64,8 -0,8 0,32
N 2229 2201 307,68
Xx,Yy
Sx,Sy 5,258 6,266
∑ 307,68
r-xy
307,68 : 545,7 =
0,564
The Correlation Level of Reliability
Correlation Coefficient Interpretation
.90 to 1.00 or -. 90 to - 1.00 Very high positive or negative correlation .70 to .89 or -.70 to - .89 High positive or negative correlation .50 to .69 or -.50 to -.69 Moderate positive or negative correlation .30 to .49 or -.30 to -. 49 Low positive or negative correlation .00 to .29 or -.00 to -.29 Little if any correlation
6. Normality
7. Homogeneity
Homogeneity test aimed to test the equality (homogeneity) some samples.21 The writer used SPSS 17.0 program to measure the homogenity of the data.
E. Instrument Try Out
The writer was given try out to the test instruments before it applied to the real sample. The try out was given to the VIII-2 class of SMP Islam Nurul Ihsan Palangka Raya. It consisted of thirty four students. The instruments try out was held at on February 17, 2014. The test consist three topics and the writer asked the students to choose one of the interest topic. Then, the students written a narrative text based on the topic by their own words. The procedures of the try out were:
1. The writer prepared the instruments.
2. The writer was given try out the instrument to the respondents 3. The writer collecting and scoring the students‟ answer
4. The writer analyzed the result of students‟ test F. Data Collection Procedure
The aim of this study was to investigate the effectiveness of using series pictures on the quality of composition written by experimental group of students. To collect the data, the writer divided the subject into two groups; the two groups were experiment group and control group. Both of groups was given pre-test, then teach the experiment group by series picture and control
21
group without series pictures, and given post-test to the experiment and control group.
Figure: 3.1 Data Collection Procedure
The steps of the data collection procedure as follows:
1. The writer divided into two groups (control group and experiment group) 2. The pre-test was given to both classes that would be assigned as the sample of
the study. (see the schedule of treatment in appendix 1 )
Teaching Writing Narrative Text at SMPN-8 Palangka Raya Kalimantan Tengah
Experiment Group Control Group
Pre-Test Pre-Test
Using Non Picture
Series Using
Series Picture
Treatment No Treatment
Post-Test Post-Test
Analysis the Data Using T-test
3. The writer gave the treatment to the experiment group. Teaching Writing narrative text using picture series and control group without picture series. (for the step of the treatment see table 3.7 )
4. The writer gave post-test to both classes after giving the treatment. (see the schedule of treatment in appendix 1)
5. The writer gave score the students writing result. There are two raters who scored the students writing result, the first rater was the writer of the study and the second rater was The English teacher of SMPN-8 of Palangka Raya 6. The writer analyzed the data using manual calculation and also SPSS 17.0
program. Then, the writer discussed and concluded the data.
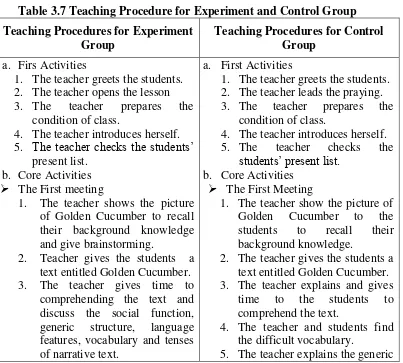
Table 3.7 Teaching Procedure for Experiment and Control Group Teaching Procedures for Experiment
Group
Teaching Procedures for Control Group
a. Firs Activities
1. The teacher greets the students. 2. The teacher opens the lesson 3. The teacher prepares the
condition of class.
4. The teacher introduces herself. 5. The teacher checks the students‟
present list. b. Core Activities
The First meeting
1. The teacher shows the picture of Golden Cucumber to recall their background knowledge and give brainstorming.
2. Teacher gives the students a text entitled Golden Cucumber. 3. The teacher gives time to
comprehending the text and discuss the social function, generic structure, language features, vocabulary and tenses of narrative text.
a. First Activities
1. The teacher greets the students. 2. The teacher leads the praying. 3. The teacher prepares the
condition of class.
4. The teacher introduces herself. 5. The teacher checks the
students‟ present list. b. Core Activities
The First Meeting
1. The teacher show the picture of Golden Cucumber to the students to recall their background knowledge.
2. The teacher gives the students a text entitled Golden Cucumber.
4. Teacher divides the students into group.
5. Teacher asks the students to answer the some questions. 6. The teacher asks the students to
write the correct answer in the whiteboard.
The Second Meeting
1. The teacher addresses some brainstorming to the students. 2. The teacher divides the students
into group.
3. The teacher gives jumbled picture and jumbled stories of Malin Kundang to the students. 4. The teacher gives time to
comprehend the picture and text 5. The teacher ask the students
find the difficult of vocabulary. 6. The taecher asks the students to
match the picture and text into Seven Dwarft to the students. 2. The teacher divides the students
into group.
3. Teacher gives a narrative text of Snow hite and Seven Dwarft. 4. The teacher and students
structure, language feature, vocabulary, and tenses of questions about Golden Cucumber.
11.The teacher asks the students to collect their writing. Kundang story and the students follow it.
5. The teacher repairs the students‟ pronounciation.
6. The students find the schematic stucture.
7. The students answer the comprehension questions of the text focusing on generic structure.
jumbled pictue.
7. The students rearrange the picture into correct order. 8. The teacher guides the students
to write short story based on
1. The teacher gives the conclusion of the material
2. The teacher gives advice to the students
3. The teacher closes the lesson.
text of Snow White and Seven Dwarft to the students.
6. The teacher explain the simple past.
7. The students write paragraph of Snow White.
c. Closing Activities
1. The teacher gives the conclusion of the material 2. The teacher gives advice to the
students
3. The teacher closes the lesson.
G. Data Analysis Procedure
This study used the students‟ writing score as a data. The data was quantitative data. The data analyzed by inferential statistics. The writer would analyze the data by some procedure below:
1. Gave and collected the data of the students „score both of pre-test and post-test at eight grade students of SMPN-8 Palangka Raya.
2. Tabulate the students‟ score into distribution of frequency in the table, then find out the mean of students‟ score, standard deviation and standard error of variable X1 (Experimental group) and X2 (Control group).
4. Analyzed the data using t-test and make the conclusion of data analysis obtain. The formula:
t
o=
Where:
Mx1 – Mx2 : Differentiation of Two Means.
SEmx1 – mx2 : The Standard Error of the Difference between Two Means.
With the criteria:
If ttest > ttable = Ha is accepted and Ho is rejected. If ttest < ttable = Ha is rejected and Ho is accepted.
The writer used the level of significance at 1% and 5%. If the result of ttest is higher than ttable, Ha is accepted but if the result of ttest is lower than ttable, Ho is accepted.
5. The writer used SPSS 17.0 program after using t-test to answer the problem of the study, whether there is significant difference between using Series Picture or without using Series Picture.
6. The writer calculated the degree of freedom with formula:22 df = (N1 + N2 - 2)
Where:
df : Degree of Freedom
N1 and N2 : Number of Cases
7. The writer determined the significant level of t observed by comparing the t observed with the t table.
8. The writer interpreted the result of the data analysis in chapter IV.
22