“AN ANALYSIS OF ANTECEDENT FACTORS
OF ATTITUDES TOWARDS BRANDS AND ITS
EFFECT ON INTENTION TO BUY LUX,
LIQUID SOAP PRODUCT”
(
Case study in Semarang )BACHELOR THESIS
Submitted to Faculty of Economics and Business In partial fulfilment of the requirements
for Bachelor Degree by :
NIKEN ROSYIDA RAHMA NIM. C2A008114
FACULTY OF ECONOMICS & BUSINESS
DIPONEGORO UNIVERSITY
SEMARANG
ii
BACHELOR THESIS LETTER OF AGREEMENT
Author : Niken Rosyida Rahma
Student Number : C2A008114
Faculty /Department : Economics and Business / Management
Title : AN ANALYSIS OF ANTECEDENTS FACTORS
OF ATTITUDE TOWARD BRANDS AND ITS EFFECT ON INTENTION TO BUY ”LUX”, A LIQUID SOAP PRODUCT (Case Study in Semarang)
Bachelor Thesis Supervisor : Dr. Ibnu Widiyanto, MA. PhD
Semarang , March 29th 2012
Bachelor Thesis Supervisor
(Dr. Ibnu Widiyanto,MA,PhD)
iii
LETTER OF APPROVAL
Name : Niken Rosyida Rahma
Student Number : C2A008114
Faculty/Department : Economics and Business/Management
Title : AN ANALYSIS OF ANTECEDENTS FACTORS OF ATTITUDE TOWARD BRANDS AND ITS EFFECT ON INTENTION TO BUY ”LUX”, LIQUID SOAP PRODUCT ( Case study in Semarang )
HAS BEEN PASSED THE EXAM ON April 27th 2012 The examiner :
1. Drs. Ibnu Widiyanto,MA,Ph.D (...)
2. Drs. H. Mudiantono, M.Sc (...)
iv
ORIGINALITY BACHELOR THESIS STATEMENT
I am Niken Rosyida Rahma,the author, states that my bachelor thesis
entitled ”AN ANALYSIS OF ANTECEDENTS FACTORS OF ATTITUDE TOWARD BRANDS AND ITS FACTORS ON INTENTION TO BUY “LUX”, LIQUID SOAP
PRODUCTS” is definitely my original. I truthfully state that in this thesis, there is no
other author works being copied or rewritewithout anypermission or without presenting their credit.
Thus, if I did intentionally or unintentionally what I stated before,I take out my bachelor thesis as my scholar science. If I am convicted in cheating, copying, or even
rewriting other authors‟ works and then I admit those as mine, I will let my certificate and
my titled are canceled by the University.
Semarang, March 28th 2012 Author
Niken Rosyida Rahma
v
MOTTO AND DEDICATION
“ Allah tidak akan memberikan cobaan yang melebihi kemampuan hamba- NYA”
“Don`t hang your head, go with your shoulders strengthened out. What is it that you find ugly? It`s only dented
There`s no need to change the shape of the puzzle
You just haven` t found the right place...”( Starlight March – strawberry fields)
This bachelor thesis is dedicated to my beloved parents, my greatest Mother whom never gives up supporting all my dreams and givingher endless love to me. And also all my
brothers,I will show you so that you will be proud of me.
vi ABSTRACT
In these recent years, there has been competition between liquid soaps in Indonesia. However, they compete in the market even though they are manufactured by the same company. Lux isa beauty soap that made in 1924, and launched in 1954 in Indonesia. Yet, it tried to build its images with liquid soap in 2006 and then, became a market leader in the next years. However, Lux must provide advantages to the customers to stabilize its position.
The aim of this research is to analyze the influence of community effect, media usage, attractiveness of advertisement, and brand ambassadors popularity on attitude, and also from attitude towards the intention to buy Lux liquid soap product. This research involves 150 college students, senior high school students, employees, and freelancers as its respondents and accidental sampling method. Thewriter distributes questionnaire in order to collect all the data and thenanalyzes employing double- regression linier analysis by SPSS software.
Analysis data result shows that research model design is related and can be proved. The conclusion from this research related to community effect, media usage, attractiveness of advertisement and brand ambassador`s popularity is those are having variouspositive effects and significant on attitude. However, especially for media usage, the result is positive but it is not significant. Therefore, the attitude is significant toward the intention to buy.
Key words : intention to buy, attitude, community effect , media usage,
vii
ACKNOWLEGEMENTS
Alhamdullilahi robbil `alamin, Thanks to Allah SWT, for Allah`s bless and hidayah, so that the writer can finish the bachelor thesis entitled “An Analysis Of Antecedents Factors On Attitude Towards Brand and Its Factors On Intention To Buy “Lux”, Liquid Soap Product”, as one of requirements to complete the Bachelor
Degree of Faculty of Economy and Business Diponegoro University.
As the writer, I would like to say thanks to Allah for giving me a strength and patient in the middle of lacked and limited in writing this bachelor thesis. I want to express my sincere to :
1. Thank you Prof.Mohammad Nasir,M.Si.Akt.Ph.D as a Dean of Economics and Business Faculty, Diponegoro University.
2. Thank you, Prof.Ibnu Widiyanto, MA,PhD, as my bachelor thesis supervisor whom gave me some advise and direction to finish my bachelor thesis.
3. Thank you Idris, S.E,MSi, as my Dosen Wali whom always supports me and gives me some advise, thank you very much.
4. Thank you Farida Indriani,S.E,M.M, thank you for your time to share my bachelor thesis and help me creating the questionnaire. Thank you for your support to encourage me continueing to study abroad. I will do my best.
5. Thanks to all lecturers in Faculty of Economics and Business, who shared their knowledge to the students.
6. Thanks to Faculty of Economics and Business‟s staffs that help me.
viii
elder brother, Muhammad Rizal Fadli for your cares, support, and financial help. Thank you to remind me to stay focus. My younger brother, Imam Ma`arif Annafi, thank you so much for your critics.Thank you to my youngest brother, Visnu Haqi Fathoni for the support, imagination never dies, you hear it!!! 8. Thanks to my Korean Sonsaengnim and KSC (Korean Study Center) Family,
Chinchimo Family, Ryu Yoon Hee Sonsaengnim, Ka Hye Song Sonsaengnim, Park Sonsaengnim, nomu nomu Gamsahamnida.
9. Thanks to AIESEC member TM family; Papi Dimas, Pempi, Deka, Tiwi, Gin. I would like to say thank you to Jogja Tracking team; all My OC -Gilar, Irta, & Ipho - ; Sanidya Project India, Bhavans Prominent School Staff, and the Global Warming Team, they are John as my leader, Shryu, Bob, Kathrin, Fathan, Natalie, Becky, Luke Lai, and Vladimir.
10. Thank you so much to Bazaar HMJM starring committee for the experience. 11. All Class of Management 2008, bachelor thesis warrior, Hwaithing!!! Ema,
Mila, Ikanita, Shanty, Rian, Deka, Danu, Mita,Dhiar,Nana,Debora, Novita and so on , thank you for the times.
12. Light Galaxy Entertaiment Family, Cyborg, XA, Cygnes,G- Flash,Oxygen, Hwaithing!!!!!
13. Danone trust team Semar Mesem, Eko, Ardi, Gerry, Finta, thank you so much. 14. Team KKN Bucu, Novan, Ingrith eonni, Raras, Ratna, Rizqy, Ribud, Sukma,
and Yason, thank you for the beautiful memories.
ix 16. My respondents thank you for your time.
17. Thank you for everyone whom help me to finish this bachelor thesis, and I`m so sorry if I cannot mention it.
The writer cannot give something to express the gratitude, except pray to Allah SWT, and hopefully, Allah will give the feedback. Thank you for critics and advice to make this bachelor thesis perfect, thank you very much.
Semarang, March 28th 2012
Author
x
TABLE OF CONTENT
BACHELOR THESIS LETTER OF AGREEMENT…………...………...…..ii
ORIGINALITY BACHELOR THESIS STATEMENT…………...………….iii
MOTTO AND DEDICATION………...………...iv
CHAPTER I INTRODUCTION………...…..……1
1.1 Background of the Research………...………1
1.2 Research Problem………...………...7
1.3 Research Objective and Usability Research…………...…………....7
1.4 Writing system………...…………...8
CHAPTER II LITERATURE REVIEW………...…….….…10
2.1 Underlying Theories………...…..…...…..10
2.2 Theoretical Framework of Study and Hypotheses `summary...19
2.3 Conceptual Variable Definition………...…...19
CHAPTER III RESEARCH METHOD………...23
3.1 Research Variable and Operation Definition Variable……...…...23
3.1.1 Research variable………... 23
3.1.2 Operation Definition Variable………...….….24
xi
3.2.1 Population and Sample in This Study………...…...27
3.3 Kinds and Source of the Data……….…...27
3.3.1 Kinds of the Data………....27
3.3.2 Source of the Data………...28
3.4 Collection Data Method………...29
3.5 Analysis Data Method………...…...30
3.5.1 Qualitative Analysis Data………...…....30
3.7 Analysis of Determination……….……...37
CHAPTER IV RESULT AND DISCUSSION……….……...…....39
4.1 Research Object Description………...39
4.1.1 Research Object in General………...39
4.2 Respondents in General…………...………...40
4.2.1Respondents Crosstabs Based on Sex,Age,and Ever Seen The Advertisement…….……….………...….40
4.3 Analysis Data……….……..…45
4.3.1 Analysis Descriptive Data……….……...…45
4.3.1.1 Description of Community Effect variable…...…..….…46
4.3.1.2 Description of Media Usage Variable…….………...47
4.3.1.3 Description of Attractiveness Advertisement Variable....48
xii
4.3.1.6 Description of Intention to buy Variable………..51
4.3.2 Analysis Quantitative Data………....….…52
4.3.2.1 Reliability Test………..52
4.3.2.2 Validity Test……….………….53
4.3.3 Regression Analysis……….…….….55
4.3.4 Normality Data Test………...….58
4.3.5 Classic Assumption Test………..…..62
4.3.6 Hypothesis Test………..….…65
4.3.7 Goodness Model Test (R2)………...69
4.4 Discussion………..….…70
CHAPTER V CONCLUTION………...73
5.1 Conclusion………...…73
5.2 Suggestion.………..………....77
xiii
LIST OF TABLE
Table 1.1 Top Of Mind Advertising...3
Table 1.2 Market Share of Liquid Soap...4
Table 1.3 Regression Model of Attitude...6
Table 2.2 Conceptual Variable ...21
Table 3.1 Operational Definition of Research`s Variable...24
Table 4.1 Respondent Crosstab Based on Sex and Age...41
Table 4.2 Respondent crosstabs based on ever seen the advertisement...44
Table 4.3 Respondents answer about Community Effect...47
Table 4.4 Respondent Answer about media usage...48
Table 4.5 Respondent Answer about attractiveness of advertisement...49
Table 4.6 Respondent Answer about brand ambassador`s popularity...50
Table 4.7 Respondent answer about attitude...51
Table 4.8 Respondent answer about intention to buy...52
Table 4.9 Reliability Test...53
Table 4.10 Validity Test ...54
Table 4.11 Regression model test first equation...55
Table 4.12Regression model test second equation...56
Table 4.13 Statistic test first equation...60
Table 4.14 Statistic test second equation...61
Table 4.15 Multicolinearity test first equation...62
Table 4.16 Multicolinearity test second equation...63
Table 4.16 F test first equation ...68
Table 4.17 F test second equation...68
Table4.18 Determination Coefficients First Equation...69
xiv
LIST OF FIGURES
Picture 2.1 Theoretical Model...19
Picture 4.1 Regression Result Design ...57
Picture 4.2 Normality Test first equation...59
Picture 4.3 Normality Test second equation...60
Picture 4.4 Heterokedasitas test first equation...64
xv APPENDIX APPENDIX A: Questionnaire
1
CHAPTER 1
INTRODUCTION
1.1 Background of the Research
In order to support a product in the market fierce competition,
companies must implement various efforts to build their products compete
and gain large market share. The strategy developed by this company is
intended to influence attitudes of the customers. Therefore, it influences the
consumers to buy product offered. According to Hawkins, Mothersbaugh, and
Best (2006:282) ” information processing is a series of activities by the which
stimuli are perceived, transformed into information and store”.
Providing information to the customers is a major problem in
promotion strategy in order to provide a product known by the consumers.
When information has been disseminated, that information will transform into
several elements that influence the consumers to purchase the products and
consume it. All the information dispersed to consumers creates costumer‟s
perception. Perception is a process that begins with consumer‟s exposure and
attention to marketing stimuli and ends with consumer‟s interpretation.
Perception will naturally create some elements that would be experienced by
the consumers (Hawkins, Mothersbaugh, and Best (2006:282).
From this perception, a product offered leads the consumers to believe
its function naturally (Kotler & Armstrong, 2008:176). A strong belief in
products will affect consumer‟s attitudes and encourage them to buy the
2
product. Building a positive image in consumer‟s mind through brand equity
will be difficult because of having many competitors, especially for identical.
Products, such as consumers‟ goods, undergo the greater pressures to
consumer`s mind share, especially since they faced the consumers who
constantly get various offers from various old products and new products
(Kartajaya ,2006: 558).
Lux soap was first launched mass-marketed in 1924 in the United
States. It has been around 80 years and was first marketed in the form of solid
soap.
Lux is one of Unilever products in the beauty soap category. Lux`s
goal is to provide women`s needs to make them look beautiful and confident
everyday. In 2008, Unilever launched two new products in liquid soap
category. Liquid soap product is brand extension strategy from Lux. Lux
applied this strategy because their image as solid soap category is already
strong. The strength of Lux liquid soap can be proved by increased position in
3
Table 1.1
Top of Mind Advertising Soap Product 2007 - 2011
Source: SWA16/XXIII/24 JULI-8 AGUSTUS; SWA16/XXIV/AGUSTUS- SEPTEMBER 2008;SWA 16/XXV/27 JULI -5 AGUSTUS2009; SWA 15/XXVI/15-28 JULI2010 ; SWA 15/XXVII/18-27 JULI 2011
Note: *** the data does not show in the magazine because the product does not include in the big 5 products in that year.
The total of TOM ad is 100 %, and because of the magazine does not show all products, the table does not in 100% of the total amount.
Tom ad shows the most remember brand position by the consumer via
advertising media. In 2008, Lux is decreased in Tom ad, and it meant that
the effectiveness and the attractiveness of the advertising began to decline,
because consumers realized that advertising was showing their product
claim more than their value. Yet, they increased in 2009.
This TOM ad calculates with surveys in 7 big cities in Indonesia,
and SWA worked with 2.609 respondents. They applied two kinds of
respondents which are personal respondents and company respondents.
The formula to calculate TOM ad is brand which is remembered by the
respondents and divided by total of respondent and then, times 100%.
Merek 2007 2008 2009 2010 2011
Lux 45,7 39,9 47,0 48,6 48,2
Lifeboy 31,8 32,7 31,9 29,6 30,4
Biore 9,6 7,4 5,6 6,4 6,5
Dove 2,2 6,0 2,0 *** ***
4
SWA Magazine NO.18/XXIV/3 SEPTEMBER 2009 in terms of
product knowledge, Lux has sought to provide information about the
liquid soap through media advertising. Media advertising itself help
consumers on where to buy the Lux liquid soap in the traditional markets,
the retail stores, and the supermarkets. In terms of knowledge usage, Ad
also provides knowledge about how to use Lux liquid soap correctly. In
terms of knowledge of pricing, advertising provides information related to
the price range of various sizes of liquid soap. Unilever also directly
provides diligent direction by giving directions on how to use the correct
liquid soap in shops; supermarkets or market as well as Lux liquid soap
routinely gives the update starting from products range, and packaging up
variants.
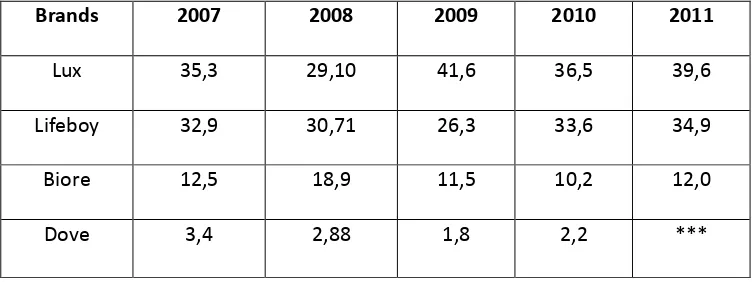
Table 1.2
Market share of liquid soap (in %) 2007-2010
Brands 2007 2008 2009 2010 2011
Lux 35,3 29,10 41,6 36,5 39,6
Lifeboy 32,9 30,71 26,3 33,6 34,9
Biore 12,5 18,9 11,5 10,2 12,0
Dove 3,4 2,88 1,8 2,2 ***
Source: SWA16/XXIII/24 JULI-8 AGUSTUS; SWA16/XXIV/AGUSTUS- SEPTEMBER 2008; SWA 16/XXV/27 JULI -5 AGUSTUS2009; SWA 15/XXVI/15-28 JULI2010 ; SWA 15/XXVII/18-27 JULI 2011
5
Market share calculates with surveys in 7 big cities in Indonesia,
and SWA worked with 2.609 respondents. They applied two kinds of
respondents which are personal respondents and company respondents.
The formula to calculate TOM ad is brand which is remembered by the
respondents and divided by total of respondent and then, times 100%.
The existence of generalized image of the Lux brand is expected to
make the same perception about Lux quality in Liquid soap product. The
decision to use brand extension strategies has to equal with consideration
of whether the consumer has the perception of positive qualities and
knowledge that drive on purchasing decisions on Lux Soap.
SWA. 18/XXIV / 3 SEPTEMBER 2009 certifys that Lux has
offered qualified product. It can be seen from the products offered, such as
liquid soap, which not only offers such emotional benefits, but also
provides functional benefits of practicality. Lux Liquid soap also produces
more foam compared to other soaps. Thus, then, gives the impression of
luxury in the bathroom. It is also considered consistent because the
position does not change. Therefore, the customers believe that it is a good
product because of its consistency. Moreover, the icons in the ad are
well-known stars of Indonesia. Lux Liquid soap is developing a number of
innovative products. For instance, this soap uses eco-friendly materials
6
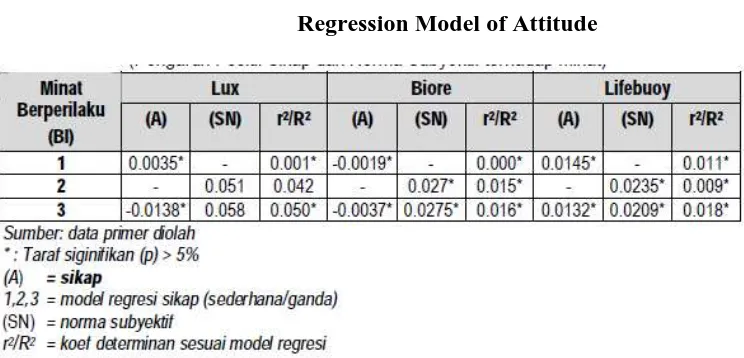
In Liriswati and Albari (2004) researches, attitude influences
consumer in having intention on soap products. We can see the result in
table 1.
Table 1.3
Regression Model of Attitude
The consumer‟s knowledge is all the information which is held by
the consumers on a wide range of products as well as other information
related to its function as a consumer (Sumarwan,2003:119), ”Marketers
need to verify what is already known by the consumer, because this
knowledge is the determinant key of consumer behaviour. What things
which consumers buy, where they buy, and when they buy depend on the
knowledge that is relevant to this decision. There are three general areas of
the costumer‟s knowledges, namely: product knowledge (product
knowledge, knowledge of usage (usage knowledge), knowledge of the price
(Price knowledge)”.
The problem appeared from the data is how to increase the
7
community effect, media usage, attractiveness of advertisement and brand
ambassador popularity .
1.2 Research Problem
Even though the competition of soap products is really high, a
product can survive by having several antecedent‟s elements. Lux liquid
soap stays on the first position from 2007 to 2010 and it needs many factors
to make it happened; one of those factors is the external factors. The
external factors help Lux to become a market leader. Therefore, do the
antecedent factors effect intention to buy Lux soap product ?
Based on the description above, the research questions are:
1. What is the effect of community on intention to buy?
2. What is the effect of media usage on intention to buy?
3. What is the effect of attractiveness of advertisement on intention
to buy?
4. What is the effect of brand ambassador`s popularity on intention
to buy?
5. What is the effect of attitude on intention to buy?
1.3 Objectives of the Research and UsabilityResearch
1.3.1 Objective of the Research
Based from the background, this study aims to:
1. Analyze the effect of community effect on consumer attitudes and
8
2. Analyze the effect of promotion through media usage on consumer
attitudes and intention to buy.
3. Analyze the effect of attractiveness of advertising on consumer
attitudes and intention to buy.
4. Analyze the effect of brand ambassador`s popularity on consumer
attitudes and intention to buy.
5. Analyze the effect of attitudes on intention to buy.
1.3.2 Method of theResearch
This research is expected to provide the benefits to the parties concerned,
namely:
1. For Practitioners
This study is expected to become a reference in enhancing business
performance impact-indirect effect of products to enhance the purchase of
soap products.
2. for further study
This research is expected to be references or input materials for
research - further research related to the problem of the influence of the
indirect effect of products that affects consumer attitudes related to the
interest of buying a productt.
1.4 Organization of the Research
Giving a clear picture of the research conducted, it describes an
systematic writing containing information about the matter and the things
9
CHAPTER I INTRODUCTION
This chapter presents the background, formulation of the problem,
research questions, objectives and usability studies, and also present a
number of data.
CHAPTER II REVIEW REFERENCES
This chapter contains the concepts and the theories of consumer‟s
behaviour, attitude, willingness to buy, marketing communications mix,
promotion via media usage, group, aattractiveness of advertisement, and
also brand popularity ambassador. The concept formulates the hypothesis
that is the ultimately form of the theoretical research model.
CHAPTER III RESEARCH METHODOLOGY
This chapter describes the operational definition of the variables
applied in the study, populations and samples, types and sources of data,
data collection methods and data analysis techniques to achieve the
research objectives.
CHAPTER IV RESULTS AND DISCUSSION
This chapter contains the results and discussion systematically,
from the research which is conducted and analyzed by employing analysis
techniques needed.
CHAPTER V CLOSING
This chapter contains the conclusions of the research results, and
10
CHAPTER II
LITERATURE REVIEW
2.1Underlying Theories
2.1.1 Attitude
Attitude is also known as the most specific concept and much
needed in contemporary social psychological. This attitude is also one of the
most important concepts used by the consumers(Setiadi :2003)
Definition put forward by All port implies that attitudes are learned
tendency to respond to an object either liked or disliked consistently.
(Yulistiano and Suryandari Engel: 2003) divide attitudes into three
components as follows:
a. Cognitive
Cognitive and knowledge are associated with the introduction of
the object and its attributes. When the consumer receives an ad to
stimulate internal psychological processes, it will work and associate
with activated of senses.
b. Affective
Affective provides feedback about their feelings towards the
object and its attributes. The feelings will give the interpretation of an
object or even in an advertisement concerning to a product or brand
and the part of it.
11
c. Conative
In co native one has an interest and action in behaviour. When
this stage is to work then the consumer has had a decision to vote.
Based on the theory, hypothesis development for the effect of
attitude on intention to buy is
H5: attitudes influences toward brand, the higher effect of attitudes toward
brand makes higher influences intention to buy.
2.1.2 Community Effect
Kotler and Armstrong (2006: 164), someone`s behaviour is more
influenced by the group. Groups that have a direct influence and a place
where a person is a member called membership groups. People often
influenced by the references in which they do not become the members.
The group behaviour and lifestyle introduce something new to the others
and affect a person's attitudes and self-concept, and then creating some
pressure to assert the influence related to someone's choice of products and
brands.
In a group, there is someone who will be opinion leader. An
opinion leader is someone who has a special skill, knowledge, personality
or other characteristics that may affect others members, and usually use
marketing buzz to create an opinion leader to discuss their products and
12
Kotler and Armstrong (2006) who says that, “uses the power of a
group of references to create an opinion leader who can deliver a strong
influence someone to change an attitude or personality”. Therefore, the
customers may have a desire to buy or try the product by the presence of a
person's group.
In addition, a group references can also do a marketing buzz which
drive the members to buy the product. Beside marketing buzz, they also
influence others by Word – of – Mouth, and give a major impact to
promote a product.
Based on the theory, hypothesis development for the effect of
community on attitude and intention to buy is
H1: the community effect influences attitudes toward brand; the
higher effect of community makes the higher influences attitudes related to
the intention to buy.
2.1.3 Media Usage
Selection of advertising media is very important that the messages
conveyed in advertising can effectively reach the target and acceptable to
consumers. Kotler (2000: 588), one among the various categories of media
planners must consider the following matters:
a) The media habits of target consumers, which saw demographic factors
13
b) Product, brand specific products tailored to the need for a product
demonstration or just the audio, so it is reviewed whether a particular
media can reach out and bring a pretty good impact.
c) messages, the messages conveyed in the ad is whether in the form of a
notice or announcement of the medium of television can be used but
contains a lot of technical data it requires media newspapers or
magazines.
d) The cost, cost considerations are essential to assess the effectiveness of
advertising in which a fee can achieve success.
Television is one of the effective advertising medium to deliver
advertising messages to potential consumers. It is also the most effective
media to convey the messages advertising products by positioning the ads in
the sidelines of broadcast television programs. The viewers will have more
times to see the ads. The form of television broadcasting depends on the
various forms of broadcasting, whether it is part of a syndicate, local
network, cable or any other forms. The forms of television advertising are:
Sponsorship, participation, and announcements.
Television creates a strong effect to consume in terms of creating the
flexibility by combining audio-visual. Therefore, the ads can be packaged in
an attractive form. The advertisement of television media influence the
consumer‟s attitudes and perceptions. Therefore, many potential customers
will spend more times sitting in front of the television as one of the source
14
Liriswati and Albari (2004) conduct a study on the analysis of the
attitude related to the interest of buying after seeing television as the
advestising media. The results of the research are positive but many
manufacturers should provide more motivations when the message from an
advertisement are delivered to the consumer.
Based on the theory, hypothesis of development realated to the effect
of media usage on attitude and intention to buy is
H2: media usage influences attitudes toward brand; the higher effect of
media usage makes the higher influences attitudes toward intention to buy.
2.1.4 Attractiveness of Advertisement
Basically, promotion or advertising are forms of non-personal
presentation to communicate ideas, products and services which are offered
by manufacturers in order to influence and create intention to buy in
consumers (Dun & Barban, 1982:7).
Wells, Burnett, and Moriarty (1995: 270), by advertising, people will
have lots of pleasant or unpleasant to the product being advertised. Besides
Wells, Burnett and Moriarty (1995: 278) also said the ads were able to
create the attraction which makes the products that are advertised to be
attractive to the consumers. They also said that the message in an
advertisement can affect the impression of knowledge and favourite of
15
1. Public Presentation, it means that your ads will let everyone
receives the same message about the product being advertised.
2. Pervasiveness, it means that the same advertising message can
be repeated to establish the receipt of information.
3. Amplified expressiveness, it means that ads dramatize the
company and its products through the pictures and sounds to
inspire and influence the feelings of the audience.
4. Impersonality, it means that the audience is not forced to pay
attention and respond to it, because it is a one-way
communication.
Dwityanti (2008) has conducted a study on relationship
attractiveness Buy advertising on consumer interest towards Internet
Banking Services products independently. The results of this study note
that the influence of advertising is to attract consumers' purchasing
priorities and foster consumer purchase and repeat purchase consumer of
these studies can be said advertisement`s appeal directly proportional to
the buying interest of consumers.
Based on the theory, hypothesis development for the effect of
attractiveness advertisement on attitude and intention to buy is
H3: attractiveness advertisement influences attitudes toward brand;
the higher effect of attractiveness advertisement makes the higher
16
2.1.5. Brand Ambassador`s Popularity
Shimp (2003:468), appeal does not mean the physically but also
some attraction. It can be more important if it includes a number of
characteristics supports which can be seen by the audience itself, those are:
personality traits, lifestyle, athlete posture and so on. General concept of
attraction consists of three related ideas: equality (similarity), recognition
(familiarity), and like (liking).
Namely, proponents are considered to be attractive by the audience
if they could share a sense of similarity or familiarity with it or even if
they just liked the support, regardless of whether the two are similar in
every respect. By selecting the artists as the speakers, advertising
executives evaluate the different aspects that can be incorporated under the
general designation of attraction. The attraction includes friendliness, fun,
physical, and work as some of the important dimensions of the concept of
magnetism.
Idiyanti (2010) has conducted a study on the effects of the use of
Celebrity endorsement Ad Lux Soap Consumer perception. The results of
this study note that the usage of endorsement artists has positive and
significant impact on consumer perceptions of advertising Lux soap.
Based on the theory, hypothesis development for the effect of
17
H4: Brand ambassador‟s popularity influences attitudes toward brand,
higher effect of brand ambassadors popularity makes higher influences
attitudes toward intention to buy.
2.1.6 Intention To Buy
Intention to buy is part of the component of behaviour which
influenced by attitudes. According to Kinnear and Taylor (1995: 306),
intention to buy is the tendency stage of respondents to act before deciding
to buy which is really implemented. Intention to buy (willingness to buy)
can be defined as probability if the buyer is intended to purchase the
product (Doods, Monroe and Grewal, (1991). A product is said as have
been consumed if the customers have deciced to buy the products. The
decision to purchase is influenced by the product being evaluated. When
the perceived benefits outweigh the sacrifices to get it, then drive to afford
the higher. Conversely, if the benefit is smaller than the sacrifice, then the
buyer will refuse to buy and generally switch to evaluate other similar
products.
Dwityanti (2008), the consumers‟ buying behaviour is often
preceded and influenced by many stimuli (stimuli) from the outside; both
are in the form of marketing stimuli and stimuli from the
environment. Stimulation is then processed in accordance with his
personal characteristics, before finally the decision to purchase is
18
process these stimuli are very complex, and one of them motivate
consumer to buy. According to Keller (1998), consumer interest is how
likely consumers buy a brand or how likely consumers switch from one
brand to another brand. While Mittal (1999) found that the function of the
interest of the consumer interest is a function of quality of products and
quality of service.Ferdinand (2002: 129), in Dwityanti (2008) buying
interest can be identified through the following indicators:
1. Transactional interest, namely the tendency for someone to buy
the product.
2. Referential interest, namely a person's tendency to refer the
product to others.
3. Preferential interest, the interest that describes the behaviour of
someone who has a major preference on these products. This
preference can only change if anything happens to the product
of preference.
4. Ask explorative, this interest can be described as the behaviour
of someone which is always looking for information about
products of interest and seek information to support the positive
19
2.2 Theoretical Framework of Study and Hypotheses’ Summary
Based on previous theory and research foundation that has been
discussed previously, it can be arranged in the framework of this study as
presented in the following figure
Figure 2.1
Theoretical model
Source: Reviewed for the research
The relation between variable in this study have a number of hypothesis
which can be identified as:
H1: the community effect influences attitudes toward brand; the higher effect
of community makes the higher influences attitudes toward brand. Community Effect
(X1)
Media Usage(X2)
Attractiveness of Advertisement (X3)
Brand Ambassadors popularity (X4)
Attitude (Y1) Intention To Buy (Y2) H1
H2
H3
H4
20
H2: media usage influences attitudes toward brand; the higher effect of media
usage makes higher influences attitudes toward intention to buy.
H3: attractiveness advertisement influences attitudes toward brand; the higher
effect of attractiveness advertisement makes the higher influences attitudes
toward intention to buy.
H4: Brand ambassador‟s popularity influences attitudes toward brand; the
higher effect of brand ambassadors‟ popularity makes the higher influence
attitudes toward intention to buy.
H5: attitudes influences toward brand; the higher effect of attitudes toward
brand makes the higher influences intention to buy.
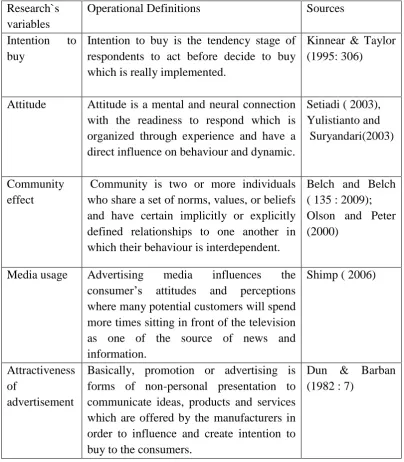
2.3 Conceptual Variable Definitions
Conceptual variable definitions are explained as a variable which
provides an action which needs to measure its variable. The conceptual
21
Table 2. 2
Conceptual Variable Table
Research`s variables
Operational Definitions Sources
Intention to
Attitude Attitude is a mental and neural connection with the readiness to respond which is organized through experience and have a direct influence on behaviour and dynamic.
Setiadi ( 2003), who share a set of norms, values, or beliefs and have certain implicitly or explicitly defined relationships to one another in which their behaviour is interdependent.
Belch and Belch ( 135 : 2009); Olson and Peter (2000)
Media usage Advertising media influences the consumer‟s attitudes and perceptions where many potential customers will spend more times sitting in front of the television as one of the source of news and
Basically, promotion or advertising is forms of non-personal presentation to communicate ideas, products and services which are offered by the manufacturers in order to influence and create intention to buy to the consumers.
22
Brand
ambassador`s popularity
Appeal does not mean the physically but also some attraction. It can be more important if it includes a number of characteristics supports which can be seen by the audience, those are; personality traits, lifestyle, athlete posture and so on. The general concept of attraction consists of three related ideas: equality (similarity), recognition (familiarity), and like (liking).
23
CHAPTER III
REASEARCH DESIGN AND METHODOLOGY
3.1 Research Variable and Operational Definition Variable
3.1.1 Research Variable
Research variable is an attribute or characteristic from objects or
activities which have such variations that decided by the researcher to
learned and make conclusions (Sugiyono: 2001).
Variable in this study have two type of variables, those are
dependent variable or variable which depend on other variables, and
independent variable or variable which does not depend on other variable.
The variables that applied in this research are:
a) Dependent variable is intention to buy toward Lux liquid soap
product (Y2).
b) Intervening variable is attitude or consumers‟ attitude toward Lux
liquid soap product (Y1).
c) Independent variable is the consumers‟ reasons to have the
intention to buy toward Lux liquid soap product, which includes 2
dimensions, those are :
1. X1 = Community Effect
2. X2 = media usage
24
3. X3=attractiveness of advertisement
4. X4=Brand ambassador`s popularity
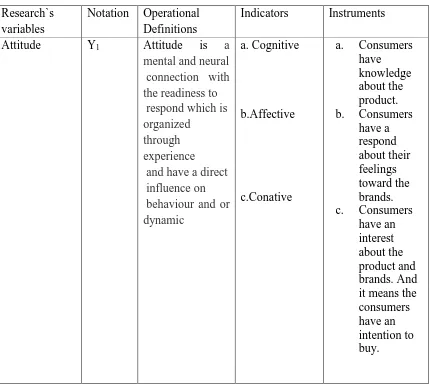
3.1.2 Operational Definition Variable
This operational definition from each variable is developed in this
research and need to be measured as the operational definition variable is
explained in table 3.1
Table 3.1
Operational Definition of Research`s Variables
Research`s variables
Notation Operational Definitions
Indicators Instruments
27
popularity physically but also some
3.2.1 Population and Sample in the Study
The population is not only human but also others objects. It is not
only object or subject that learned but also all of the characteristics that
they have. The population in this study is the consumers who have ever
used or tried Lux liquid soap.
Sample is a part of population research. It is also a part of
population which take have to be analized. Sampling method is applied by
draw on a purposive sampling. Purposive sampling is a sampling
technique which the objects should match with the criteria that have been
28
Sample criteria in this research are everyone who has ever tried and
used Lux liquid soap product.
Sample in this research are 150 respondents and they are consist of
men and women, with range of age around 17- 23 years old.
3.3 Kinds and Source of the Data
3.3.1 Kinds of the Data
1. Qualitative Data
Qualitative data is a result from an act of monitoring in which the
output can only be in a form of category (Santoso: 2003), for examples are
sex, kinds of job, etc.
2. Secondary Data
Secondary data is a result from an act of monitoring from a kind
object or something that can be said or wrote with a form of number
(Santoso: 2005), for examples are age, wages, etc.
3.3.2 Source of the Data
1. Primary Data
Primary data is data that is collected by an individual or
organization directly from the objects (Suprapto: 2003). Respondent data
need to understand the consumer‟s intention to buy Lux liquid soap
29
attractiveness of advertisement, and brand ambassador‟s popularity. In that
case, it can be gathered by giving questionnaire or question list.
2. Secondary Data
Secondary data is data from publications which is collected by
other organizations. The secondary data in this research are gathered from
the magazines, book, and thesis.
3.4 Collection Data Method
In scientific research, the data collection is used to gather the
materials that relevant, accurate and reliable (Supranto: 2003). The
primary data is used questionnaire. Questionnaire is one of the methods to
collect the data by giving question list to the respondent, and hopefully
they will give some respond. In this research, the questionnaire employs
close and open questions. The measurement variable employs Likert‟s
scale which uses that method:
Very
disagree
Very
agree
1 2 3 4 5 6 7 8 9 10
Number 1 shows that respondents do not support the question
given. Furthermore, number 10 shows that respondent supports the
30
3.5 Analysis Data Method
The collected data have benefits if we can analyze the data first and
then process it. Therefore, we can make the data as the basic data to create
a decision. The purpose of analyzing data is to interpret and make a
conclusion from some the collected data.
3.5.1 Qualitative Analysis Data
Qualitative analytical data is an analysis based on the data that
have been said in essay. The data can only be measured by empolying two
ways, directly or on the spot (Hadi: 2001). There are a number of the
qualitative data‟ process, those are :
1. Editing
Editing is a process of chosing or taking data needed and then, take out
the unnecessarily data, so that it will be easier to calculate the
hypothesis.
2. Coding
Coding is a process by giving some code in some various answers in the
same question category.
3. Scoring
Questionnaire is creaed by employing Likert‟s scale, 10 stages with the
biggest score is 10, and the respond is “very agree” and the smallest
31
4. Tabulating
Tabulating is a kind of answer‟s grouping process carefully and
systematically, and then the data will be calculated and summarized.
This table can be use to make a relation with all variables.
3.5.2. Quantitative Analysis Data
Quantitative analytical data is a kind of analyzing process using
number and then calculating by employing a statistical method, so that the
data are classified in some categorize on the tables. In order to make it
easier in analyzing, the writer uses SPSS (Statistical Package and Search
Solution) program windows version 17.0. It is a n analyze tools that will
be used is Validity test and reliability test.
3.5.3 Reliability and Validity Test
3.5.3.1 Reliability Test
Reliability is a tool to measure a questionnaire which is an
indicator from variable or construction (Gozali: 2006). A questionnaire is
reliable if someone`s answer is consistent from times to times. The process
in order to make some reliable test in this research use Cronbach Alpha
statistic test to measure the reliability. Understanding that questionnaire is
reliable, it will be analyzed in reliable questionnaire test with SPSS. The
32
If the coefficient Alpha result more than significant standard 70%
or 0,7 ,so the questionnaire is reliable.
If the coefficient Alpha result less than significant standard 70%
or 0,7, so the questionnaire result is not reliable.
3.5.3.2 Validity Test
In order to support regression analyze, we do a number of validity
and reliability tests. In this research, validity test is used to understand
whether the questionnaire is valid or not. Validity shows how accurate and
neatness a measurement tools do the function. A questionnaire is said to be
valid if the question in the questionnaire can show object that will be
measured by its questionnaire (Gozali:2006). If the result shows a
significant value, so that, each indicator questions are valid. In this
research validity test is done with SPSS program.
3.5.4 Regression Test
Analyze data method which is used in this research is a
quantitative analyze method. The purpose is to analyze the influence of
attitude, the community effect, media usage, attractiveness of
advertisement, and brand ambassador`s popularity related to the intention
to buy by employing some multiple regression analyses. This analysis,
despite off to measure the relation of each variable, also to show the
relation between dependent variable and independent directly
33
data. From this program, we can get the output that is a result process from
the collected data. The data will be interpret and analyzed by employing
some process. From the analysis, we can make a conclusion as a result
from the result. This research can be explained with a linear model:
Y1 = �1X1+β2X2+β3X3+β4X4
Y2 = β1Y1
Explanation :
Y1 = attitudes (dependent variable)
Y2 = intention to buy (dependent variable)
X1 = community effect
X2 = media usage
X3 = attractiveness advertisement
X4 = brand ambassador`s popularity
β1 = coefficient of community effect
β2 = coefficient of media usage
β3 = coefficient of attractiveness advertisement
β4 = coefficient of brand ambassador`s popularity
Doubled regression is applied to understand how far the
independent variable influences intervening variable and dependent
variable. A dependent variable, a intervening variable and more than one
independent variable can be found in the doubled regression. This research,
34
towards Lux liquiud soap product. Intervening dependent is the intention
to buy Lux liquid soap product. And the independent variables are the
community effect, media usage, attractiveness of advertisement and brand
ambassador` popularity.
3.5.5 Normality Data Test
Normality data is used to analyzed in regression model and
residual variable have distribution normal ( Gozali : 2006). We can use
this method to analyze the data which are collected whether they have
normal distribution or not:
a) Graphic Method
Reliable graphic method is how to see the normal probability plot
which is compared with cumulative distribution from normal
distribution (Gozali :2006). Normal distribution shapes one
diagonal line. And plotting residual data will be compared with
diagonal line. If the data spread around diagonal line, the regression
model completes normality assumption. If the data spread far away
from the diagonal or follow diagonal line, the regression model is
not complete normality assumption.
b) Statistic Method
Simple statistic test is usually used to analyze normality is an
analysis test from Kolmogorov Smirnov. This test is done by
looking at the significant value variables. If significant more than
35
3.5.6 Assumption Classic test
Besides of validity test and reliability, we can also employ
deviation assumption classic tests, those are :
1. Multi co-linearity test
This test aims to analyze whether the regression model finds correlation
between the independent variables (independent) or not. Regression
model should not have happened with a good correlation between the
independent variables. If the independent variables are correlated, these
variables are not orthogonal (orthogonal variable is the independent
variable which has the correlation between the members of the
independent variables equal to zero). The presence or absence
multicollinierity in the regression model can be seen from the value of
tolerance and his opponent VIF (Variations Inflation Factor). Both of
these measurements show that each independent variable is explained by
other independent variables. The tolerance measures the variability of
selected independent variables that cannot be explained by other
independent variables. Therefore, a low tolerance value as high as to the
value of VIF. Cutoff‟s values are commonly used to indicate the presence
of multicollinearity with tolerance values ≤ 0.10 or equal to the value of
VIF ≥ 10 (Ghozali, 2007: 96).
2. Heteroskedastisitas Test
Heteroskedastisitas test aims to analyze whether in a regression model
36
( Gozali : 2006). If one of variations from one residue or from one
monitoring to other monitoring is stable, it called homokedastisitas. And
if the variations are different, therefore it will be called heterokesdesitas.
A good regression model is Homokesdesitas not Heterokedesitas
( Gozali : 2006). One way to detect a heterodesitas is by seeing plot
graphic between prediction value dependent variable which is ZPRED
and the residue value is SRESID.
3.6 Hypothesis Test
I would like to use two kinds of test to build the hypothesis, those
are partial test and simultaneous test. Partial test will be done with the t
test employing F test.
t Test ( Significant Test in Partial )
t test used to test the significant relation between X variable and Y
variable, do X 1, X2, X3, X4, variables influence variable Y 1, and Y 1
influence Y2. To show how each independent variable influences
dependent variable, the hypothesis formula is
H1 = independent variables significant influence dependent variable,
while test criteria are
1. if calculation t > table t , so H0 reject, H1 accept.
2. If calculation t < table t , so H0 accept ,H1 reject
Or
37
2. If probability calculation t < 0,05 H0 reject and H1 accept
F Test ( significant test in simultaneous)
F test show all independent variables in the model which having
influence gathering toward dependent variables ( Gozali : 2006). In
this research, hypothesis test simultaneously aims to measure the
community effect , media usage, attractiveness of advertisement
and brand ambassador‟s popularity which are influence the
attitudes related to the intention to buy. Hypothesis that can be used
in this research is “
Based on Gozali (2006) the decision will be:
1. With compare F value calculation with table F
If table F > F calculation , so H0 reject and H1 accept.
If table F > F calculation , so H0 accept and H1 reject
2. Use significant probability Number
If significant probability > 0,05 so H0 accept and H1 reject.
If significant probability < 0,05 so H0 reject and H1 accept.
3.7 Analysis of Determination Coefficient (R2)
The main purpose of determination coefficient is to measure how
far the model ability explaining the dependent variable variations
(Gozali :2006). Determinant coefficient (R2) has an aims to know the best
accurate level in regression analysis; it shows from determination
coefficients range between 0 (zero) and 1 (one). If the determination
38
the dependent variable. If the determination coefficient is almost one (1 );
it means that the independent variable influences the dependent variable.
Meanwhile, determination coefficient is used to know how the dependent