THE PREDICTION OF POSITION AND ORIENTATION PARAMETERS OF UAV
FOR VIDEO IMAGING
D. Wierzbicki a *
a
Department of Remote Sensing, Photogrammetry and Imagery Intelligence, Geodesy Institute, Faculty of Civil Engineering and Geodesy, Military University of Technology, 2 Kaliskiego st. Warsaw, Poland
KEY WORDS: Photogrammetry, UAV, Navigation, Orientation determination, Accuracy
ABSTRACT:
The paper presents the results of the prediction for the parameters of the position and orientation of the unmanned aerial vehicle (UAV) equipped with compact digital camera. Issue focus in this paper is to achieve optimal accuracy and reliability of the geo-referenced video frames on the basis of data from the navigation sensors mounted on UAV. In experiments two mathematical models were used for the process of the prediction: the polynomial model and the trigonometric model. The forecast values of position and orientation of UAV were compared with readings low cost GPS and INS sensors mounted on the unmanned Trimble UX-5 platform. Research experiment was conducted on the preview of navigation data from 23 measuring epochs. The forecast coordinate values and angles of the turnover and the actual readings of the sensor Trimble UX-5 were compared in this paper. Based on the results of the comparison it was determined that: the best results of co-ordinate comparison of an unmanned aerial vehicle received for the storage with, whereas worst for the coordinate Y on the base of both prediction models, obtained value of standard deviation for the coordinate XYZ from both prediction models does not cross over a admissible criterion 10 m for the term of the exactitudes of the position of a unmanned aircraft. The best results of the comparison of the angles of the turn of a unmanned aircraft received for the angle Pitch, whereas worst for the angles Heading and Roll on the base of both prediction models. Obtained value of standard deviation for the angles of turn HPR from both prediction models does not exceed a admissible exactitude 5⁰ only for the angle Pitch, however crosses over this value for the angles Heading and Roll.
* Corresponding author
1. INTRODUCTION
Scientific progress and technological which took place in last years, resulted in the development of the imaging technology of the surface of the Earth. Thanks to that, systems and devices letting the surface of our planet for acquiring images with the much higher, radiometric and spectral spatial resolution came into existence. Also an accuracy of the sense of direction of these images grew. The special meaning has intensive development of representation from a low altitude with the help of set up sensors on board of unmanned aircraft (Colomina, Molina, 2014; Remondino, et. al., 2011; Mesas-Carrascosa, et al., 2014; Kedzierski, Wierzbicki, 2016). Presently the transceivers of one frequency of GPS allowing to reach the GPS accuracy of appointing the position which is developing on the level of just a few meters are installed on board of majorities low-cost UAVs and INS with a strong drift are used which do not allow for direct georeferencing (Grenzdörffer et al., 2008; Kedzierski et al., 2016a). In relation to determination the value of angle orientations of the camera on cheap UAV mainly inert sensors based on mikro-electromechanical systems are being used (MEMS). The achieved accuracy of appointing angle values in inert individuals of this type is developing on level 1 ° for pitches crosswise and oblong, however for the angle of torsion this accuracy is taking out 2 ° (Chao et al., 2010). The low accuracy of outlining angles is caused mainly by errors in of measurements accelerometers, gyroscopic and not very exact readings magnetometers (Kolecki, 2012). The results of obtained measurements from the individuals MEMS are not as
accurate as those based on fiber-optic gyroscopes FOG (Fiber Optic Gyro), however in case of limiting mass applying such solutions on board UAVs is becoming impossible (Burdziakowski, 2016). Performed examinations through (Goodall et al., 2012) demonstrated, that where a minimization of costs, a reduction in the weight and minimal lowering the accuracy are essential (e.g. assembly on board UAVs) solutions based on MEMS will be advantageous in this case. The devices based on FOG will find application for precise mobile devising systems and for military applications.
Therefore, the problem of the prediction of the position and the UAV sense of direction based on GNSS/INS systems constitutes into the important component in the UAV technology photogrammetry. The predictable trajectory of flight and orientation in space of the unmanned aerial vehicle has a key value in the aspect of safety of implementation of aviation operation and the minimization of the effect of the collision with other aircraft. Moreover the extrapolation of the position and the sense of direction of the unmanned platform is essential in case of the no data, loss of the connection or eye contact with the unmanned aircraft. In frames of the prediction of the position and the sense of direction of the unmanned aircraft different mathematical models and statistical models are applicable. Is necessary to emphasize that the applied function of the extrapolation can be appropriate for the parameter of the position, whereas inappropriate for the parameter of the sense of direction or on the contrary. The selection of the function of extrapolations must be closely fitted and adapted to resulting
needs as well as research guidelines. In addition during application of prediction one should come back attention on: number of sample of data, assortment of the model of the extrapolation, character of changes sample of data, time of the sampling of data, a frame of reference sample of data, continuity sample of data etc.
The results of the prediction for parameters of the position and of the sense of direction of the unmanned aircraft were presented in the paper. In applied work two mathematical models for the process of the prediction were used i.e. the polynomial model and the trigonometric model. The forecast values of position and orientation of the unmanned aircraft became verified with the real readings of navigational parameters from UAV. Real navigational readings from the Trimble UX-5 come from the photogrammetric flight, accomplished by compact camera Sony NEX5R into 2016 in the town Tylicz in southern Poland. Research experiment was conducted on the sample of navigational data from 23 measuring epochs. The paper was divided in four parts and references at the end. The results of researches were placed in the graphical form, tabular and descriptive in the chapter four of the paper.
2. MATHEMATICAL FORMULA PREDICTION FOR POSITION AND ORIENTATION UAVS
Within the framework of the prediction of the position and he orientation of an unmanned aerial vehicle two models of the extrapolations were used (Ratajczak, 2006):
- the model of the polynomial 2nd degree:
2 position in the moment of time of "t",
POLY t
Y = forecast value of the Y coordinate for the UAV position in the moment of time of "t",
POLY t
Z = forecast value of the Z coordinate for the UAV position in the moment of time of "t",
POLY t
H = forecast value of the Heading angle for the UAV position in the moment of time of "t",
POLY t
P = forecast value of the Pitch angle for the UAV position in the moment of time of "t",
POLY t
R = forecast value of the Roll angle for the UAV position in the moment of time of "t",
t = measuring epoch; determines the time for which predicted position parameters and orientation are determined.
(aX,bX,cX) = coefficients of the polynomial for the forecast of
- model of the trigonometric function:
cos( ) sin( )
X = forecast value of the X coordinate for the UAV position in the moment of time of „t”,
TRI t
Y = forecast value of the Y coordinate for the UAV position in the moment of time of „t”,
TRI t
Z = forecast value of the Z coordinate for the UAV position in the moment of time of „t”,
TRI t
H = forecast value of the Heading angle for the UAV position in the moment of time of „t”,
TRI t
P = forecast value of the Pitch angle for the UAV position in the moment of time of „t”,
TRI t
R = forecast value of the Roll angle for the UAV position in the moment of time of „t”,
t= measuring epoch; determines the time for which predicted position parameters and orientation are determined.,
2 T
, frequency of the sampling, T- total period of the sampling,
(eX,fX,gX)= coefficients of trigonometric function for the forecast of the X coordinate,
( ,eY f gY, Y)= coefficients of trigonometric function for the forecast of the Y coordinate,
(eZ,fZ,gZ)= coefficients of trigonometric function for the forecast of the Z coordinate,
(eH,fH,gH)= coefficients of trigonometric function for the forecast of the Heading angle,
( ,eP fP,gP)= coefficients of trigonometric function for the forecast of the Pitch angle,
( ,eR fR,gR)= coefficients of trigonometric function for the forecast of the Roll angle .
Prognosticated parameters of the
POLY, POLY, POLY
position of user in satellite system GPS. In case of parameters of the orientation of an unmanned aerial vehicle predicted valuesof angles of the turnover
POLY, POLY, POLY
placed on board of unmanned platforms.
The values of linear coefficients in the polynomial and trigonometric model are determined based on navigation data from several first measuring epochs.
Linear coefficients from the equations (1) to (4) are used the prediction of the UAV for succeeding measuring epochs. The parameter of time t” determines the current measuring epoch on which are determined predicted values of the position and orientation of UAV.
3. RESEARCH EXPERIMENT
Within the framework of research experiment the prediction of the place-value and angles of the turnover for the unmanned aerial vehicle were made. Research experiment was conducted for navigational exemplary data from 23 measuring epochs. Measuring data from the Trimble UX-5 which carried out photogrammetric flight in the Tylicz city in 2016 (Fig. 1). The Trimble UX-5 platform registered in real time navigational data in the form of co-ordinate geodetic BLh (B- geodetic width, L- geodetic length, h- ellipsoid height) and HPR rotation angles (Heading H-, P- Pitch, R- Roll) for the UAV. The Trimble UX-5 writes down navigational parameters of position and orientation of an unmanned aircraft in the form of text file with the expansion *.log” (Kedzierski et al., 2016b). The target accuracy of co-ordinate delimitation of an unmanned aircraft should not cross 10 m, whereas accordingly or angles of the turnover is taking out to 50 (Eling et al., 2015). Analysis of the prediction for geocentric XYZ coordinates which are received as a result of the Helmert transformation from geodetic BLh coordinates were made in the paper. In case of parameters of orientation values of HPR angles registered by the Trimble UX-5 were used directly in calculations.
Figure 1. The Flight trajectory of UAV
Predicted values of XYZ coordinates and HPR angles for the unmanned aircraft were appointed for measuring epochs from 4 to 23 in the recursive process. Values of linear rates for the polynomial and trigonometric model are determined sequentially based on navigation data from 3 previous measuring epochs in accordance with equations (1) to (4). The interval of observation for performed calculations equals 1 s.
4. RESULTS AND DISCUSSION
Based on conducted researches Fig. 2, 3, 4, 5, 6 and 7 presents values of the difference between forecast parameters of
positions and orientations of the UAV and with actual readings from GPS and INS sensors placed on the Trimble UX-5 platform. The value of the difference for the forecast and actual coordinates and angles of rotation of an unmanned aircraft were obtained from the relation:
- for the polynomial method:
POLY real POLY Heading angle in the moment of time of „t” in the polynomial model,
DR = difference of the forecast and actual value for the Roll angle in the moment of time of „t” in the polynomial model,
real
Y = The actual reading for Y coordinate angle in the moment of time of „t”,
real t
Z = The actual reading for Z coordinate angle in the moment of time of „t”,
P = the actual reading for Pitch angle in the moment of time of „t”,
real t
R = the actual reading for Roll angle in the moment of time of „t”;
- for the trigonometric method:
TRI real TRI
TRI t
DX = difference of the forecast and actual value for the X coordinate in the moment of time of „t” in the trigonometric model,
TRI t
DY = difference of the forecast and actual value for the Y coordinate in the moment of time of „t” in the trigonometric model,
TRI t
DZ = difference of the forecast and actual value for the Z coordinate in the moment of time of „t” in the trigonometric model,
TRI t
DH = difference of the forecast and actual value for the Heading angle in the moment of time of „t” in the trigonometric model,
TRI t
DP = difference of the forecast and actual value for the Pitch angle in the moment of time of „t” in the trigonometric model,
TRI t
DR = difference of the forecast and actual value for the Roll angle in the moment of time of „t” in the trigonometric model.
Fig. 2 presents values of DX parameters for the polynomial and trigonometric model. The mean of the DX parameter in the polynomial model equals 0.06 m, whereas in the trigonometric model equals 1.13m. The scattering of achieved results for the DX parameter in the polynomial model equals between -12.15 and 7.33 m, however in the trigonometric model accordingly between -10.54 m and 8.03 m. The standard deviation for the mean of the DX parameter equals 4.91 m in the polynomial model, whereas in the trigonometric model 4.74 m accordingly. Moreover the value of the median for the DX parameter equals 0.49 m in the polynomial model, however in the trigonometric model 1.49 m accordingly.
Figure 2. The values of DX parameter based on polynomial and trigonometric method.
Figure 3. The values of DY parameter based on polynomial and trigonometric method.
Fig. 3 presents values of DY parameters for the polynomial and trigonometric model. The mean of the DY parameter in the polynomial model equals -0.11 m, whereas in the trigonometric model equals -2.13 m. The dispersion of achieved results for the DY parameter in the polynomial model equals between -13.16m and 14.45 m, however in the trigonometric model between -14.85 m and 12.02 m accordingly. The standard deviation for the mean of the DY parameter equals 7.72 m in the polynomial model, whereas in the trigonometric model 7.54 m accordingly. Besides the value of median for the DY parameter equals 0.55 m in the polynomial model, however in the trigonometric model -1.45 m accordingly.
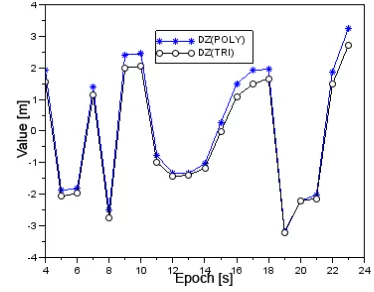
Figure 4. The values of DZ parameter based on polynomial and trigonometric method.
Fig. 4 presents values of DZ parameters for the polynomial and trigonometric model. The mean of the DZ parameter in the polynomial model equals 0.04 m, whereas in the trigonometric model equals -0.21 m.
The scattering of achieved results for the DZ parameter in the polynomial model equals between -3.18 m and 3.25 m, however in the trigonometric model between -3.21 m and 2.71 m accordingly. The standard deviation for the mean of the DZ parameter equals 2.03 m in the polynomial model, whereas in the trigonometric model 1.90 m accordingly. Moreover the value of the median for the DZ parameter equals -0.26 m in the polynomial model, however in the trigonometric model -0.51 m accordingly.
Table 1 presents summary table values obtained for the statistical parameters DX, DY, and DZ. In the polynomial model mean of DX DY and DZ parameters are close to 0 however the scattering of achieved results is greater than in the trigonometric model. The value of the median is smaller in the polynomial model than in the trigonometric model. The standard deviation for DX parameters and DY is greater than for the DZ parameter in both mathematical models. The large differences of statistic values are particularly visible for the parameters DX and DY.
Statistical size Parametr DX Parametr DY Parametr DZ Average value 0.06 m in polynomial
model, 1.13 m in trigonometric model.
-0.11 m in polynomial model, -2.13 m in trigonometric model
0.04 m in polynomial model, -0.21 m in trigonometric model Standard deviation 4.95 m in polynomial
model, 4.74 m in trigonometric model.
7.72 m in polynomial model, 7.54 m in trigonometric model
2.03 m in polynomial model, 1.90 m in trigonometric model
Median 0.49 m in polynomial
model, 1.49 m in trigonometric model.
0.55 m in polynomial model, -1.45 m in trigonometric model
-0.26 m in polynomial model, -0.51 m in trigonometric model Amplitude of the results Between -12.15 m and 7.33
m in polynomial model, between -10.54 m and 8.03
m in trigonometric model.
Between -13.16 m and 14.45 m in polynomial model, between -14.85 m and 12.02
m in trigonometric model
Between -3.18 m and 3.25 m in polynomial model, between -3.21 m and 2.71 m
in trigonometric model
Table 1. The statistical analysis of DX, DY, DZ parameters
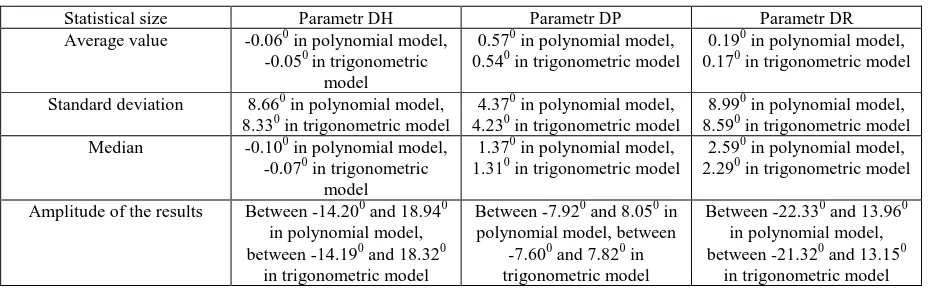
Fig. 5 presents values of DH parameter for polynomial and trigonometric model. The mean of the DH parameter in the polynomial model equals -0.060, whereas in the trigonometric model equals -0.050. The scattering of achieved results for the DH parameter in the polynomial model equals between -14.200 and 18.940, however in the trigonometric model between -14.190 and 18.320 accordingly. The standard deviation for the mean of the DH parameter equals 8.660 in polynomial model whereas in trigonometric model equals 8.330 accordingly. Moreover the value of the median for the DH parameter equals -0.100 in the polynomial model, however in the trigonometric model equals -0.070 accordingly.
Figure 5. The values of DH parameter based on polynomial and trigonometric method.
Figure 6. The values of DP parameter based on polynomial and trigonometric method.
Fig. 6 presents values of DP parameters in polynomial and trigonometric model. The mean of the DP parameter in the polynomial mode equals 0.570, whereas in the trigonometric model equals 0.540. The scattering of achieved results for the DP parameter in the polynomial model equals between -7.920 and 8.050, whereas in trigonometric model between -7.600 and 7.820 accordingly. The standard deviation for the mean of the DP parameter equals 4.370 in polynomial model, whereas in trigonometric model 4.370 accordingly. Moreover the value of the median for the DP parameter equals 1.370 in the polynomial model, however in the trigonometric model 1.310 accordingly.
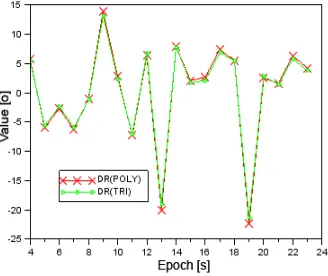
Figure 7. The values of DR parameter based on polynomial and trigonometric method.
Fig 7 presents values of DR parameters in polynomial and trigonometric model. Mean of the DR parameter in the polynomial model equals 0.190, whereas in trigonometric model equals 0.170. Obtained scattering of results for the parameter DR in polynomial model equals between -22.330 and 13.960 whereas in trigonometric model between -21.320 and 13.150 accordingly. Standard deviation for the mean of the DR parameter equals 8.990 in polynomial model, whereas in trigonometric model 8.590 accordingly. Moreover value of the median for the DR parameter equals 2.590 in polynomial model, whereas 2.290 in trigonometric model.
Statistical size Parametr DH Parametr DP Parametr DR Average value -0.060 in polynomial model,
-0.050 in trigonometric model
0.570 in polynomial model, 0.540 in trigonometric model
0.190 in polynomial model, 0.170 in trigonometric model
Standard deviation 8.660 in polynomial model, 8.330 in trigonometric model
4.370 in polynomial model, 4.230 in trigonometric model
8.990 in polynomial model, 8.590 in trigonometric model Median -0.100 in polynomial model,
-0.070 in trigonometric model
1.370 in polynomial model, 1.310 in trigonometric model
2.590 in polynomial model, 2.290 in trigonometric model
Amplitude of the results Between -14.200 and 18.940 in polynomial model,
Table 2. The statistical analysis of DH, DP, DR parameters.
Table 2 presents summary table values obtained for the statistical DH, DP and DR parameters. Statistical values for DH, DP and DR parameters are very close based on the polynomial and trigonometric model. In the polynomial and trigonometric model mean of DH DP and DR parameters are smaller than 10. The dispersion of achieved results is biggest for the Roll angle, whereas smallest for the Pitch angle for both mathematical models. Is necessary to emphasize, that standard deviation is smaller than 50 for Pitch angle, whereas for Heading and Roll angle equals almost 90. The value of the median is smallest for the Heading angle, however biggest for the Roll angle.
5. CONCLUSIONS
Conception of using mathematical models for the prediction of the position and UAV orientation were presented in this paper. Mathematical models of prediction used in the investigation based on using the polynomial model of 2nd step and the trigonometric function. Research experiment was conducted on the preview of navigation data from 23 measuring epochs. Navigation data were registered and gathered by the Trimble UX-5. Comparison of the forecast values of coordinates and turnover angles and actual reading from Trimble UX-5 platform were made.
Based on the get comparison results they it has been established that:
- the best results of coordinate comparison of a unmanned aircraft received for the coordinate Z, whereas worst for the coordinate Y based of both models of prediction,
- obtained value of standard deviation for the coordinate XYZ from both models of prediction does not exceed acceptable criterion of 10 m for locating the accuracy of unmanned aircraft, - the best results of comparing angles of the turnover of the unmanned aircraft were received for the Pitch angle, whereas worst for Heading angles and Roll based on both models of the prediction,
- obtained value of the standard deviation for the HPR rotation angles from both models of the prediction doesn't exceed acceptable accuracy 5⁰ only for the Pitch angle, however is crosses over for Heading angles and Roll.
ACKNOWLEDGEMENTS
This work was supported by grant co-financed with Faculty of Civil Engineering and Geodesy, Military University of Technology (Geodesy Institute).
REFERENCES
Burdziakowski, P. 2016. Przegląd budowy i funkcjonalności współczesnych bezzałogowych statków powietrznych do celów fotogrametrycznych. Biuletyn Wojskowej Akademii Technicznej, 65(4). (In Polish), doi: 10.5604/12345865.1228956
Chao H., C. Coopmans, L. Di, Y., 2010. Chen, A comparative evaluation of low-cost IMUs for unmanned autonomous systems, In Multisensor Fusion and Integration for Intelligent Systems (MFI), 2010 IEEE Conference on 2010, 211-216.
Colomina, I.; Molina, P. Unmanned aerial systems for photogrammetry and remote sensing: A review. ISPRS J. Photogramm. Remote Sens. 2014, 92, 79–97.
Eling, C., Wieland, M., Hess, C., Klingbeil, L., and Kuhlmann, H., 2015. Development and evaluation of a UAV based mapping system for remote sensing and surveying applications, Int. Arch. Photogramm. Remote Sens. Spatial Inf. Sci., XL-1/W4, 233-239, doi:10.5194/isprsarchives-XL-1-W4-233-2015.
Goodall, C., Carmichael, S., El-Sheimy, N., Scannell, B., 2012. INS face off MEMS versus FOGs. InsideGNSS 7, 48–55.
Grenzdörffer, G.J., Engel, A. and Teichert, B., 2008. The photogrammetric potential of low-cost UAVs in fores try and agriculture. In: IAPRS&SIS , Vol. 37, Part B1, Beijing, China, p. 1207-1213.
Kedzierski, M., Wierzbicki, D., 2016. Methodology of improvement of radiometric quality of images acquired from low altitudes. Measurement, 92, 70-78.
doi: 10.1016/j.measurement.2016.06.003
Kedzierski M., Fryskowska A., Wierzbicki D., Nerc P., 2016b. Chosen aspects of the production of the basic map using UAV imagery Int. Arch. Photogramm. Remote Sens. Spatial Inf. Sci., XLI-B1, 873-877, doi:10.5194/isprs-archives-XLI-B1-873-2016.
Kolecki J.,2012. Determination of approximated exterior orientantion parameteres of terrestrial images using MEMS IMU, Archiwum Fotogrametrii, Kartografii i Teledetekcji, 24, 2012, 133-143. (In Polish)
Mesas-Carrascosa, F.; Rumbao, I.; Berrocal, J.; Porras, A., 2014. Positional quality assessment of orthophotos obtained from sensors onboard multi-rotor UAV platforms. Sensors 2014, 14, 22394–22407.
Ratajczak T., 2006 Metody numeryczne: przykłady i zadania, Wydawnictwo Politechniki Gdańskiej, Gdańsk, 2006. (In Polish)
Remondino, F.; Barazzetti, L.; Nex, F.; Scaioni, M.; Sarazzi, D.2011. UAV photogrammetry for mapping and 3D modeling-current status and future perspectives. Int. Arch. Photogram. Remote Sens. Spat. Inf. Sci., 38, 25–31.