ENHANCEMENT OF SPATIAL RESOLUTION OF THE LROC WIDE ANGLE CAMERA
IMAGES
P. Mahantia,∗, M. S. Robinsona, H. Satoa, A. Awumaha, M. Henriksena
aLROC Science Operations Center, School of Earth and Space Exploration, Arizona State University, Tempe, Arizona , U.S.A.
Commission VII, WG VII/6
KEY WORDS:Moon, Image Fusion, LRO, Wide Angle Camera
ABSTRACT:
Image fusion, a popular method for resolution enhancement in Earth-based remote sensing studies involves the integration of geometric (sharpness) detail of a high-resolution panchromatic (Pan) image and the spectral information of a lower resolution multi-spectral (MS) image. Image fusion with planetary images is not as widespread as with terrestrial studies, although successful application of image fusion can lead to the generation of higher resolution MS image data. A comprehensive comparison of six image fusion algorithms in the context of lunar images is presented in this work. Performance of these algorithms is compared by visual inspection of the high-resolution multi-spectral products, derived products such as band-to-band ratio and composite images, and performance metrics with an emphasis on spectral content preservation. Enhanced MS images of the lunar surface can enable new science and maximize the science return for current and future missions.
1. INTRODUCTION
Planetary imaging by orbiters is often performed using two sepa-rate instruments: a high-resolution Pan camera, and a lower res-olution MS camera or hyper-spectral (HS) imager. Small pixel footprint cameras (small instantaneous field-of-view (IFOV), high-resolution) usually require a wider spectral bandwidth for shorter exposures (to avoid smear); likewise a narrow spectral band sens-ing element results in a larger pixel scale (larger IFOV). Typically the design of planetary imaging instruments is more restrictive in terms of volume and mass constraints than Earth-based examples. High-resolution imagers are typically large in size and mass, so in addition to the IFOV vs. bandwidth tradeoff, there are limitations on physical dimensions and mass of the final instrument based on the payload for a mission. If a high-resolution multi-spectral (HRMS) imager were to be deployed on a planetary mission, the corresponding data volume would likely outstrip typical plane-tary spacecraft onboard mass storage and downlink capabilities (Zhang, 2004).
A popular method in Earth-based applications for resolution en-hancement involves merging of Pan and MS images in a process known as image fusion; a procedure that integrates geometric (sharpness) detail of a high-resolution Pan image and the spectral information of a low-resolution MS image (Pohl and Van Gen-deren, 1998, Zhang, 2004). Typically a MS image contains lower frequency (colors and tones) information relative to a Pan image that shows higher frequency details (edges, boundaries). For ex-ample if the source scene has sharp edges, then those edges are present in the MS bands but not strongly represented (blurred or fuzzy), whereas in the Pan frame the edges are sharply resolved. In image fusion, the goal is to transfer the high-frequency infor-mation of the Pan into the MS image with minimal change to its original low-frequency content.
Since the design of high-resolution multi-spectral instruments is challenging and cost-prohibitive in planetary imaging, the op-tion of improving the resoluop-tion of spectral informaop-tion by post-processing methods is attractive. A bundled high-resolution Pan
∗Corresponding author
image and low-resolution MS image can mitigate the storage and downlink restrictions. Currently, many image fusion methods ex-ist and several comprehensive reviews (Pohl and Van Genderen, 1998, Wang et al., 2005) discuss their algorithms, implementa-tion and applicaimplementa-tion for Earth-based remote sensing. However, image fusion is not frequently employed in planetary applica-tions despite the existence of published methods as early as 1982 (Simard, 1982) - a possible reason being the limitations on avail-able tools and/or multi-mission, multi-sensor planetary image data. Among the few applications of image fusion methods for plane-tary images examples are found using Viking Orbiter images of Mars (Archinal et al., 2004, Robinson, 1994) and Kaguya and Chandrayaan images of the Moon (Lavanya et al., 2011).
In the last decade, Pan and MS imaging of the lunar surface by several orbiters (Lunar Reconnaissance Orbiter (Chin et al., 2007), Kaguya (Haruyama et al., 2008), Chandrayaan-1 (Goswami and Annadurai, 2009) and Chang’E 1-3 (Xiao, 2014)) and the availability of modern image analysis techniques and computa-tional resources have opened new opportunities for applying im-age fusion techniques to planetary observations. Investigating the performance of existing image fusion methods on existing lunar images enables advancing the state-of-art for planetary image fu-sion methods. In this work, we perform image fufu-sion for the first time with Lunar Reconnaissance Orbiter Camera (LROC) (Robinson et al., 2010) Narrow Angle Camera (NAC) and LROC Wide Angle Camera (WAC) images.
Our work also provides the first comparative performance evalua-tion of six well known image fusion methods across three classes of image fusion methods for lunar images: (1) Intensity-Hue-Saturation (IHS), (2) Brovey Transform (BT), (3) Principal Com-ponent Analysis (PCA), (4) University of New Brunswick (UNB), (5) High Pass Filter (HPF) and (6) Additive Wavelet (AWT). The performances of image fusion methods are assessed both quali-tatively (visual examination) and quantiquali-tatively (via well known image fusion performance metrics). Preservation of spectral in-formation is considered to be more important in our performance analysis.
meth-ods being compared are first discussed and compared followed by a description of the raw images. The method of performance evaluation is discussed next followed by discussion of the results.
2. CLASSIFICATION AND OVERVIEW OF IMAGE FUSION METHODS
Image fusion methods are classified based on the scheme of in-jecting sharpness details into the MS bands. The component substitution methods (e.g. IHS and PCA) use algebraic trans-forms to segregate the brightness, intensity and luminance com-ponents from the composite (e.g. color) MS image and replaces the intensity component with the Pan image. In the Intensity-Hue-Saturation (IHS) fusion (Gillesfie et al., 1986, Welch and Ehlers, 1987), a color composite of bands (or band derivatives) such as ratio is transformed into IHS color space. The intensity component is replaced by the Pan image, the MS hue and satu-ration bands are re-sampled to the high-resolution pixel size and the scene is reverse-transformed, integrally merging the Pan and MS. The Principal Component Analysis (PCA) method (Chavez et al., 1991) is a statistical method that converts inter-correlated MS bands into a new set of uncorrelated components. The first component resembles a Pan image and is replaced by a high-resolution Pan image; a reverse PCA transform then generates the HRMS images.
Modulation schemes form the second class of image fusion meth-ods where sharpness details are modulated (via spatial multiplica-tion or direct addimultiplica-tion of high-frequency informamultiplica-tion) into the MS images.Typically a synthetic, low-resolution Pan image (LRPI) is used to normalize the original Pan and then the normalized Pan is spatially multiplied to the MS image or the difference of the Pan and LRPI is added to the MS image. The Brovey Transform (Gillespie et al., 1987), HPF (Gangkofner et al., 2008) and UNB methods (Zhang, 1999) fall into this class. The difference in these methods lies in the LRPI synthesis. For BT, the average of the MS bands is used as LRPI; for HPF, a boxcar-filtered Pan is the LRPI, and for UNB, the LRPI is constructed via least-squares-regression as a linear combination of MS bands that spectrally overlap the Pan.
The third category of image fusion methods are Multi-Resolution Analysis (MRA) based methods where the MS and Pan images are first decomposed into coarse and fine components in the scale-space domain and then spatial details are injected at fine scales from the Pan image while maintaining spectral details of the MS. Wavelets and other MRA techniques are used in this class of im-age fusion. The Additive Wavelet method (N¨unez et al., 1999), where a normalized wavelet plane of the Pan is added to the cor-responding MS wavelet plane at each decomposition level is im-plemented and used in this work. All image fusion methods used here can be explained as a form of a generalized image fusion method (Table 1) where high spatial-frequency information from Pan is integrated into the MS bands to form the HRMS as per the following:
HRMSk=MSk↑+αk(Pan−Φk) (1)
In the above expressionMSk↑indicates the up-sampled MS im-ages, values ofαkandΦkchange with the image fusion algorithm (Table 1).
3. LUNAR IMAGES ACQUIRED BY LROC
The LROC WAC is a MS (7-color: Ultra-Violet - 321 nm, 360 nm; Visible - 415 nm, 566 nm, 604 nm, 643 nm and 689 nm)
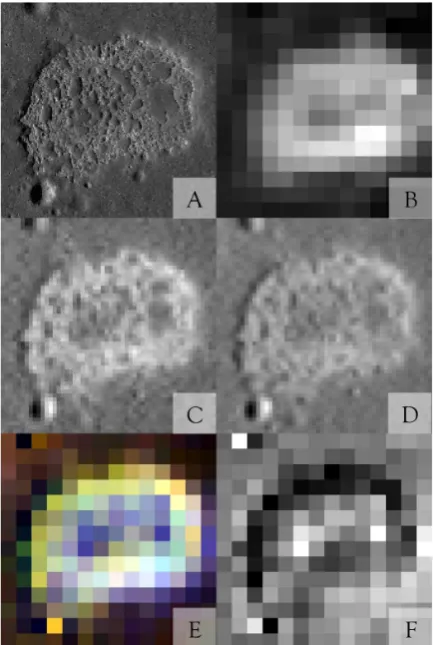
Figure 1: Ina-D - A) Pan - 16 m/px, B) MS UV 1 - 256 m/px, C) MS Vis 1 - 64 m/px, D) MS Vis 5 - 64 m/px, E) MS composite image (red: Vis 5, green: Vis 1, blue: UV 1) - 256 m/px F) MS ratio image: UV 1 / Vis 1 - 256 m/px.
push-frame camera while the two NACs are monochrome (spec-tral response - 400 - 760 nm) narrow-angle, line-scan imagers. Image acquisition and calibration details for the cameras are de-tailed elsewhere (Mahanti et al., 2015, Humm et al., 2015, Spey-erer et al., 2015, Robinson et al., 2010) and not repeated here. LROC observations are publicly accessed through the NASA Plan-etary Data System (PDS) (NASA, 2014).
The Visible (Vis) and Ultra-Violet (UV) bands are considered separate MS stacks during image fusion to fix the ratio between Pan and MS resolution at 4:1 (target spatial enhancement is 4 times). Pixel scales of the Pan and MS images used for image fu-sion were: NAC at 16 m/px and WAC-Vis at 64 m/px, and NAC at 64 m/px and WAC-UV at 256 m/px. It must be noted that UV is at a 4x lower pixel scale than Vis and this effects the resolu-tion of images derived by combining Vis and UV. The pixel scale for the NAC images is 0.5 m/px (from 50-km altitude) so the Pan images are re-sampled versions of the original NAC.
The two example lunar images are of the Ina-D, a volcanic feature first discovered in Apollo era photography, and South Ray crater which is an young impact crater explored during the Apollo 16 mission. Observations used for Ina-D were NAC: M1173023278 (left and right pair); WAC: M165808188CE. For the South Ray target, the observations used were NAC: M1182366809 and WAC: M144524970CE. NAC pair images and frames in the WAC ob-servation were mosaicked prior to obtaining the region-of-interest for each target geographical area.
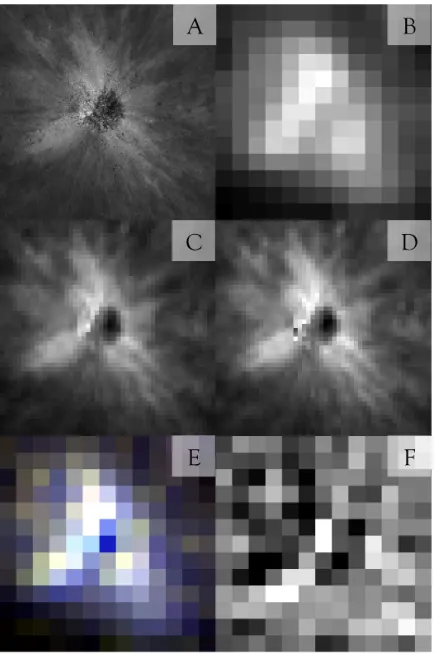
Figure 2: South Ray - A) Pan - 16 m/px, B) MS UV 1 - 256 m/px, C) MS Vis 1 - 64 m/px, D) MS Vis 5 - 64 m/px, E) MS composite image (red: Vis 5, green: Vis 1, blue: UV 1) - 256 m/px F) MS ratio image: UV 1 / Vis 1 - 256 m/px.
<100 my (Braden et al., 2014). Two distinct units characterize Ina: a rough floor material thought to underlie a relatively smooth unit delimited with steep lobate margins. Inas sharp topographic contrast results in images rich with spatial details (the smooth units contribute more to the spectral details) - an increased spa-tial resolution via image fusion would better characterize the two units and the color signatures observable in ratio and/or color composite images. The second target (South Ray crater, 700 m diameter) is a young crater (Copernican era) located in the high-land terrain, 3.9 km south of Apollo 16 high-landing site. The higher albedo (immature) ejecta rays is in sharp contrast to the surround-ing mature, lower albedo surface. The ratio images 321 nm /415 nm show variations related to the maturity of regolith (Denevi et al., 2014). An improvement in spatial detail could lead to a refined characterization of ejecta rays providing better insight to ejecta emplacement mechanisms.
4. PERFORMANCE ANALYSIS
Absolute performance of an image fusion method depends on the specific intended use of the resulting HRMS product - whether spatial or spectral details are more important and the degree of compromise permissible between the two aspects. Only basic forms of known algorithms are implemented in this work and no tuning was performed for enhancing spatial or spectral per-formance. During evaluation, both qualitative (visual character-ization) and quantitative (metric-based charactercharacter-ization) criteria are used. Quality of two HRMS bands (UV 1 and Vis 5) and products derived from the HRMS bands (band ratio and false-color composite image products), are analyzed visually. Spatial
Table 1: Image fusion methods
Method αk Φk
enhancement and is assessed from the individual high-resolution bands (Figures 4, 5) while visible spectral irregularities are more evident in the ratio (Figure 6) and composite (Figure 7) images.
The UV 1 to Vis 1 (321/415 nm) band ratio was specifically cho-sen due to its known applications in spectral characterization of the lunar surface. The ratio follows Ti02 abundance in lunar soils (Robinson et al., 2011), was used to classify areas of basaltic magmatism on lunar mare plains, which resulted in irregular mare patches (such as Ina-D (Braden et al., 2014)), and used to clas-sify mare units (Boyd et al., 2012). The (321/415 nm) ratio also allows for analysis of surfaces with increased exposure to space weathering - a diagnostic feature for the youngest lunar craters, and possible helpful indicator of the relative age of Copernican craters (Denevi et al., 2011).
Composite (false color) images are effective in conveying rela-tive spectral content of three bands at any specific location (x,y). Specific band choices for composite images can accentuate spec-tral signatures specific to mineralogic context exposure to space weathering effects. For example, lunar swirls are mapped using a WAC composite (red = 415 nm, blue = 321/415 nm, and green = 321/360 nm) that reveals the locations of the swirls (Denevi et al., 2015). A more general falsecolor mapping is used in this work -the three selected bands are -the two extreme LROC WAC filters - UV 1 (321 nm) and Vis 5 (689 nm), and the smallest visible wavelength band, Vis 1 (415 nm).
Quantitative performance evaluation is affected by computing the values of five image fusion quality metrics (Tables 3 and 4) : (1) Average Gradient (AG) - average magnitude of the image gradi-ent computed in the row and column directions; larger AG implies higher spatial resolution (Li et al., 2005); (2) ERGAS -French acronym for Relative Dimensionless Global Error in Syn-thesis (Wald, 2002); ERGAS is zero for distortion-free image fu-sion; (3) Spectral Angle Mapper (SAM) - denotes the absolute value of the angle between true and estimated spectral vectors (Yuhas et al., 1992); SAM is zero for no spectral mismatch; (4) Universal Image Quality Index (UIQI (Wang and Bovik, 2002)) - UIQI models image distortion as a product of three factors: loss of correlation, radiometric distortion, and contrast distor-tion); and (5) Spectral Distortion Index (SD (Alparone et al., 2008)) which is the p-norm of the deviation between the pair-wise similarity matrix constructed from the MS and the HRMS bands; SD is zero for no spectral distortion.
Table 2: Quantitative image fusion performance metrics
of the kth band of the test image from the reference image,gis a 2-dimensional laplacian operator,∇Fis the gradient for a raster (or raster stack) F,kFkis the norm for the raster stack computed at each (x,y) andFk,sis a standardized raster (after mean subtrac-tion) for the kth band. A reference raster (or raster stack, e.g. the original MS band(S)) is denoted by R andr,f are reference and test spectral vectors obtained at a given location (x,y). Suf-fixes are used to denote specific values of meanµand standard deviationσ.
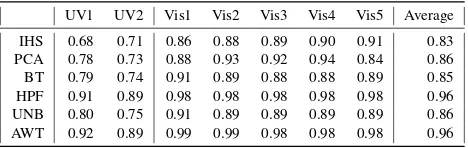
In addition to the overall values of quantitative evaluation metrics, the performance of the image fusion algorithms is further judged based on Wald’s protocol (Wald et al., 1997) and band similarity based spectral quality of the fused image (Pradhan et al., 2006). In particular, we check the consistency property (necessary con-dition) for image fusion from Wald’s protocol that implies that the synthesized MS image, when degraded to its original resolu-tion (degraded HRMS - DHRMS), should resemble the original MS image. We compare the original MS WAC image and the DHRMS via cross-correlation (CC: Tables 5, 6) and UIQI (Ta-bles 7, 8) metrics for both Ina-D and South Ray.
The necessary condition requires a reference for comparison and does not test fusion performance at HRMS resolution. For preser-vation of spectral properties, relationship between bands must be maintained such that pairwise correlation or similarity between any two bands in the MS image is unaltered by image fusion (Pradhan et al., 2006). While CC is a standard similarity mea-sure, CC is insensitive to local changes in average signal level and contrast when computed pairwise for bands (Alparone et al., 2008). Hence we adopt the method used by Alparone et. al. (2008) and compute pairwise UIQI for bands before and after the image fusion to the compute the Spectral Distortion Index (Tables 3,4).
5. RESULTS AND DISCUSSION
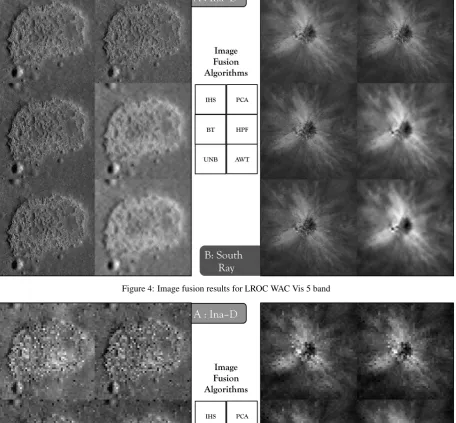
Improvement in spatial resolution of WAC images is evident by visually comparing the synthesized HRMS images (Vis 5 and UV 1 band images, Figures 4 and 5 respectively) from each algo-rithm to the corresponding ‘before’ images (Figures 1 and 2). The Pan image (LROC NAC; Figure 1A for Ina-D and Figure 2A for South Ray) provides a visual reference for the theoretical maximum spatial resolution of HRMS product. The UV 1 HRMS (Figure 5A and 5B) images contain more high frequency spatial detail than the original images (Figure 1B and 2B) for both Ina-D and South Ray crater. Note that pixel resolution for the WAC UV bands is 4 times coarser compared to the visible bands; at the original resolutions both Ina-D and South Ray crater have barely recognizable features. For example. in the Ina-D HRMS, the smaller craters in the north and south can be identified and for the South Ray HRMS, the structure of rays is sharper. Con-trast between foreground and background is non-uniform in the IHS and PCA UV1 HRMS results (more visible in IHS). HPF and AWT results are not as sharp as other UV 1 HRMS results.
Image fusion results for the HRMS Vis 5 band show consider-able improvement in high frequency detail with less blockiness (present in original images at same pixel scale). Spatial resolu-tion improvement is clearly more prevalent for the IHS, PCA, BT and UNB algorithms; HPF and AWT results are different -there is overall weaker contrast and small gains in sharpness. The very small craters in Ina-D and rocky floor of South Ray is better shown by the IHS, PCA, BT and UNB algorithms.
Table 3: Ina D: Average values of performance metrics
AG ERGAS (≥0*) SAM [0*,90] UIQI [-1,1*] SDI [0*,1]
Vis UV Vis UV Vis UV Vis UV Vis UV
IHS 0.10 0.10 9.86 10.08 1.26 1.47 0.62 0.41 0.025 0.154 PCA 0.09 0.11 9.16 10.12 2.22 0.86 0.71 0.40 0.047 0.000 BT 0.10 0.11 9.83 10.17 1.34 0.82 0.62 0.39 0.043 0.053 HPF 0.06 0.08 6.27 8.11 0.95 0.76 0.94 0.75 0.012 0.034 UNB 0.10 0.11 9.78 10.13 1.34 0.82 0.63 0.40 0.044 0.053 AWT 0.04 0.10 4.78 9.15 0.87 0.77 0.98 0.60 0.003 0.043
Table 4: South Ray: Average values of performance metrics
AG ERGAS (≥0*) SAM [0*,90] UIQI [-1,1*] SDI [0*,1]
Vis UV Vis UV Vis UV Vis UV Vis UV
IHS 0.07 0.09 7.88 9.28 0.38 0.67 0.94 0.86 0.008 0.017 PCA 0.05 0.09 6.31 9.12 0.75 0.20 0.97 0.87 0.005 0.000 BT 0.07 0.09 7.75 9.13 0.04 0.21 0.95 0.87 0.001 0.005 HPF 0.04 0.07 4.69 7.06 0.04 0.25 0.99 0.95 0.000 0.002 UNB 0.07 0.09 7.80 9.12 0.04 0.22 0.94 0.87 0.000 0.004 AWT 0.03 0.09 2.77 8.10 0.03 0.19 1.00 0.92 0.000 0.002
Band ratio (321/415 nm) images derived from the HRMS prod-ucts show improvements in high frequency detail. HPF and AWT results exhibit the sharpest results (determined by examination of ratio images before and after image fusion), followed by PCA, IHS and finally by BT and UNB. However, IHS and PCA results show spectral distortion - local patches of background to fore-ground contrast differences uncorrelated with morphology. Fur-ther, the morphological outline fades and merges into the back-ground in the west corner of Ina-D. A crater at this south-west corner cannot be identified in the IHS HRMS band ratio. Structure of ejecta rays are expected to be enhanced by contrast difference in ratio images - this effect is clearly observed for the HPF and AWT algorithm results for South Ray; Other algorithms, have less clarity for the ray structures. The ratio images for BT and UNB are very similar visually - for these two algorithms HRMSk= MSΦk·Pank where Pan andΦkis identical for all bands and these terms get canceled when a band ratio is computed.
Composite (false-color) images reveal transformation dependent spectral distortion at Ina-D: (a) morphologically uncorrelated color patches can be seen in IHS (blue patches) and PCA (less pro-nounced than IHS), and (b) there is smearing of colored pixels (north-east quadrant, Ina-D). Similar distortion effects are not prominent for the South Ray HRMS color composite images. Note that the composite image color in HPF and AWT results are slightly different from the other algorithms for both Ina-D and South Ray targets. Further, larger spatial resolution enhancement is obtained for IHS, PCA, BT and UNB algorithms for composite images.
Table 5: Ina D: Correlation Coefficient (MS,DHRMS)
UV1 UV2 Vis1 Vis2 Vis3 Vis4 Vis5 Average IHS 0.68 0.71 0.86 0.88 0.89 0.90 0.91 0.83 PCA 0.78 0.73 0.88 0.93 0.92 0.94 0.84 0.86 BT 0.79 0.74 0.91 0.89 0.88 0.88 0.89 0.85 HPF 0.91 0.89 0.98 0.98 0.98 0.98 0.98 0.96 UNB 0.80 0.75 0.91 0.89 0.89 0.89 0.89 0.86 AWT 0.92 0.89 0.99 0.99 0.98 0.98 0.98 0.96
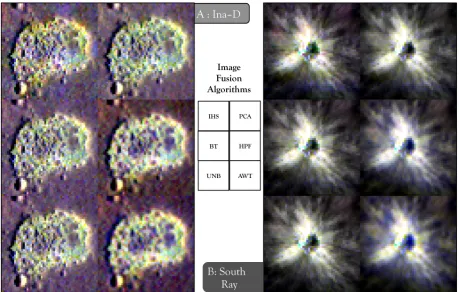
Figure 3: Spectral Angle Mapper (SAM) images for (A) Ina-D and (B) South Ray. Pixel value is the spectral angle between WAC visible bands before and after image fusion. Contrast limit maximum saturates top 2% of Ina-D PCA SAM pixel values.
Table 6: South Ray: Correlation Coefficient (MS,DHRMS)
UV1 UV2 Vis1 Vis2 Vis3 Vis4 Vis5 Average IHS 0.92 0.94 0.98 0.99 0.99 0.99 0.99 0.97 PCA 0.94 0.94 0.99 1.00 0.99 1.00 0.99 0.98 BT 0.94 0.94 0.99 0.99 0.99 0.99 0.99 0.98 HPF 0.97 0.97 1.00 1.00 1.00 1.00 1.00 0.99 UNB 0.94 0.94 0.99 0.99 0.99 0.99 0.99 0.98 AWT 0.98 0.98 1.00 1.00 1.00 1.00 1.00 0.99
the locations for large deviations from the ideal zero spectral an-gle. The Ina-D SAM image has more pixels with values greater than 2 degrees, in comparison with South Ray image. Larger values of spectral angle is observed at topographic boundaries /strong brightness transitions. The algorithms AWT, HPF, and UNB perform better (overall small SAM values) compared to the remaining three algorithms.
Tables 3,4 compare overall performance metrics for the HRMS results. The UNB, BT and IHS algorithms perform best in terms of spatial resolution enhancement (large AG values) while AWT and HPF algorithms show the best spectral performance. All al-gorithms perform better for the South Ray target (compared to Ina-D) and UV and Vis bands perform similarly against all met-rics except UIQI, for which the performance of Vis HRMS results is distinctly better.
Table 7: Ina D: UIQI (MS,DHRMS)
UV1 UV2 Vis1 Vis2 Vis3 Vis4 Vis5
IHS 0.60 0.59 0.75 0.80 0.82 0.83 0.86
PCA 0.63 0.59 0.86 0.91 0.88 0.92 0.75
BT 0.63 0.58 0.85 0.81 0.81 0.80 0.81
HPF 0.88 0.86 0.97 0.98 0.98 0.97 0.98
UNB 0.65 0.59 0.86 0.82 0.82 0.81 0.81
AWT 0.83 0.78 0.99 0.99 0.98 0.98 0.98
Performance of algorithms varies between the MS bands (Tables 5,6,7,8) and this effect is assessed via the CC and UIQI metrics. For both CC and UIQI, the Vis bands perform better than UV
bands. Note that the UIQI reported for Tables 7,8 is with respect to the DHRMS, and high values indicate that a particular fusion algorithm better satisfies the necessary condition of image fusion (see section 4). Values of CC and UIQI show more variation for Ina-D and show that AWT and HPF generate the best spectrally correct results.
Table 8: South Ray: UIQI (MS,DHRMS)
UV1 UV2 Vis1 Vis2 Vis3 Vis4 Vis5
IHS 0.91 0.94 0.98 0.99 0.99 0.99 0.99
PCA 0.93 0.93 0.99 1.00 0.99 1.00 0.99
BT 0.93 0.93 0.99 0.99 0.99 0.99 0.99
HPF 0.97 0.97 1.00 1.00 1.00 1.00 1.00
UNB 0.93 0.93 0.99 0.99 0.99 0.99 0.99
AWT 0.98 0.98 1.00 1.00 1.00 1.00 1.00
6. CONCLUSION
The aligned field-of-view of LROC NAC and WAC and the rela-tive spectral response of their filters (NAC response spans that of the five WAC visible filters) makes these instruments nearly opti-mal for spatial resolution enhancement via image fusion. All six image fusion algorithms from three classes of pixel-level image fusion methods - component substitution (IHS, PCA), modula-tion (BT, HPF, UNB) and multi-resolumodula-tion analysis (AWT) were successful in enhancing spatial resolution of LROC WAC MS bands.
An image fusion method that successfully improves the spatial resolution of spectral data is enabling in the context of lunar sci-ence. We discovered that for spectral enhancement via band-ratio (a common practice in planetary science / remote sensing), HRMS results from multiplicative modulation-based image fu-sion methods cannot be used due to an implicit cancellation of the normalized PAN (same for each HRMS band) from either HRMS band. For example, the UNB method produces high spa-tial resolution products with comparatively small magnitudes of spectral distortion. However, UNB (the form implemented here) is modulation (multiplicative) based - usable UNB implementa-tions must be able to generate reliable HRMS band-to-band ratio images by tweaking the LRPI synthesis procedure.
Similar to image fusion applied to Earth-based remote sensing, spatial resolution enhancement was achieved for LROC WAC im-ages (e.g. IHS, PCA). The best spatially performing algorithms were IHS, PCA, UNB and BT, while the spectral performance of wavelets was found to be the best. A compromise between spa-tial and spectral performance for generating HRMS lunar images is exciting - implementation and performance analysis of hybrid algorithms (e.g. wavelets and IHS) schemes may further improve our initial success.
HRMS results presented here indicate future possibilities of an optimal (spectrally correct and spatially resolved within accepted tolerances) image fusion scheme for using LROC lunar images for other key science targets.
REFERENCES
Figure 4: Image fusion results for LROC WAC Vis 5 band
Figure 5: Image fusion results for LROC WAC UV 1 band
Archinal, B. A., Lee, E. M., Kirk, R. L., Duxbury, T. C., Sucharski, R. M., Cook, D. A. and Barrett, J. M., 2004. A new mars digital image model (mdim 2.1) control network. Inter-national Archives of Photogrammetry and Remote Sensing 35, pp. B4.
Boyd, A., Mahanti, P., Robinson, M., Lawrence, S., Spudis, P.
and Jolliff, B., 2012. Lunar smooth plains identification and clas-sification. In: European Planetary Sci. Congress.
Figure 6: Image fusion results’ ratio images for LROC WAC UV 1 / Vis 1 band ratio. Contrast stretch limits saturate upper and lower 2% of pixel values of individual composite images.
Figure 7: Image fusion results’ composite images for LROC WAC Vis 5, Vis 1, & UV 1 bands (red, green, & blue, respectively). Contrast stretch limits saturate upper and lower 2% of pixel values of individual composite images.
Chavez, P., Sides, S. C. and Anderson, J. A., 1991. Comparison of three different methods to merge multiresolution and multispec-tral data- landsat tm and spot panchromatic. Photogrammetric Engineering and remote sensing 57(3), pp. 295–303.
Denevi, B., Robinson, M., Sato, H., McEwen, A. and Hapke, B., 2011. Lroc wac ultraviolet characterization of lunar space weathering. In: Lunar and Planetary Science Conference, Vol. 42, p. 2304.
Denevi, B. W., Robinson, M. S., Boyd, A. K. and Blewett, D. T., 2015. The widespread distribution of swirls in lunar re-connaissance orbiter camera images. In: European Planetary Science Congress 2015, held 27 September-2 October, 2015 in Nantes, France, Online at http://meetingorganizer. copernicus. org/EPSC2015, id. EPSC2015-854, Vol. 10, p. 854.
Denevi, B. W., Robinson, M. S., Boyd, A. K., Sato, H., Hapke, B. W. and Hawke, B. R., 2014. Characterization of space weath-ering from Lunar Reconnaissance Orbiter Camera ultraviolet ob-servations of the Moon. Journal of Geophysical Research: Plan-ets 119(5), pp. 976–997.
Gangkofner, U. G., Pradhan, P. S. and Holcomb, D. W., 2008. Optimizing the high-pass filter addition technique for image fu-sion. Photogrammetric Engineering & Remote Sensing 74(9), pp. 1107–1118.
Gillesfie, A. F., KAi-iLE, A. S. and WALKER, F. L. E., 1986. Color enhancement of highly correlated images. Images decor-relation and HIS contrast stretches. Remote Sensing of Environ-ment 20, pp. 209–235.
Gillespie, A. R., Kahle, A. B. and Walker, R. E., 1987. Color enhancement of highly correlated images. ii. channel ratio and chromaticity transformation techniques. Remote Sensing of En-vironment 22(3), pp. 343–365.
Goswami, J. and Annadurai, M., 2009. Chandrayaan-1: Indias first planetary science mission to the moon. Curr. Sci 96(4), pp. 486–491.
Haruyama, J., Matsunaga, T., Ohtake, M., Morota, T., Honda, C., Yokota, Y., Torii, M. and Ogawa, Y., 2008. Global lunar-surface mapping experiment using the lunar imager/spectrometer on selene. Earth, Planets and Space 60(4), pp. 243–255.
Humm, D., Tschimmel, M., Brylow, S., Mahanti, P., Tran, T., Braden, S., Wiseman, S., Danton, J., Eliason, E. and Robinson, M. S., 2015. Flight calibration of the lroc narrow angle camera. Space Science Reviews pp. 1–43.
Lavanya, A., Vani, K., Sanjeevi, S. and Kumar, R. S., 2011. Im-age fusion of the multi-sensor lunar imIm-age data using wavelet combined transformation. In: Recent Trends in Informa-tion Technology (ICRTIT), 2011 InternaInforma-tional Conference on, pp. 920–925.
Li, Z., Jing, Z., Yang, X. and Sun, S., 2005. Color transfer based remote sensing image fusion using non-separable wavelet frame transform. Pattern Recognition Letters 26(13), pp. 2006–2014.
Mahanti, P., Humm, D., Robinson, M. S., Boyd, A., Stelling, R., Sato, H., Denevi, B., Braden, S., Bowman-Cisneros, E., Brylow, S. et al., 2015. Inflight calibration of the lunar reconnaissance orbiter camera wide angle camera. Space Science Reviews pp. 1– 38.
NASA, 2014. Lunar reconnaissance orbiter online data volumes.
N¨unez, J., Otazu, X., Fors, O., Prades, A., Pal`a, V. and Arbiol, R., 1999. Multiresolution-based image fusion with additive wavelet decomposition. IEEE Transactions on Geoscience and Remote Sensing 37(3 I), pp. 1204–1211.
Pohl, C. and Van Genderen, J. L., 1998. Review article multi-sensor image fusion in remote sensing: Concepts, methods and applications.
Pradhan, P. S., King, R. L., Younan, N. H. and Holcomb, D. W., 2006. Estimation of the number of decomposition lev-els for a wavelet-based multiresolution multisensor image fusion. Geoscience and Remote Sensing, IEEE Transactions on 44(12), pp. 3674–3686.
Robinson, M., 1994. Exploring small volcanoes on mars. As-tronomy 22, pp. 30–37.
Robinson, M., Denevi, B., Sato, H., Hapke, B. and Hawke, B., 2011. Lroc wac ultraviolet reflectance of the moon. Lunar Planet. Sci., XLII.
Robinson, M. S., Brylow, S. M., Tschimmel, M., Humm, D., Lawrence, S. J., Thomas, P. C., Denevi, B. W., Bowman-Cisneros, E., Zerr, J., Ravine, M. A. and Others, 2010. Lunar Reconnaissance Orbiter Camera (LROC) Instrument Overview. Space science reviews 150(1), pp. 81–124.
Simard, R., 1982. Improved spatial and altimetric information from spot composite imagery. In: International Symposium on Remote Sensing of Environment, Second Thematic Conference: Remote Sensing for Exploration Geology, Fort Worth, TX, Pro-ceedings,, Vol. 1, pp. 433–444.
Speyerer, E., Wagner, R., Robinson, M. S., Licht, A., Thomas, P., Becker, K., Anderson, J., Brylow, S., Humm, D. and Tschim-mel, M., 2015. Pre-flight and on-orbit geometric calibration of the lunar reconnaissance orbiter camera. Space Science Reviews pp. 1–36.
Strain, P. and El-Baz, F., 1980. The geology and morphology of ina. In: Lunar and Planetary Science Conference Proceedings, Vol. 11, pp. 2437–2446.
Wald, L., 2002. Data fusion: definitions and architectures: fusion of images of different spatial resolutions. Presses des MINES.
Wald, L., Ranchin, T. and Mangolini, M., 1997. Fusion of satel-lite images of different spatial resolutions : Assessing the quality of resulting images. Photogrammetric Engineering & Remote Sensing 63(6), pp. 691–699.
Wang, Z. and Bovik, A. C., 2002. A universal image quality index. Signal Processing Letters, IEEE 9(3), pp. 81–84.
Wang, Z., Ziou, D., Armenakis, C., Li, D. and Li, Q., 2005. A comparative analysis of image fusion methods. IEEE Transac-tions on Geoscience and Remote Sensing 43(6), pp. 1391–1402.
Welch, R. and Ehlers, M., 1987. Merging multiresolution spot hrv and landsat tm data. Photogrammetric Engineering and Remote Sensing 53, pp. 301–303.
Xiao, L., 2014. China’s touch on the moon. Nature Geoscience 7, pp. 391–392.
Yuhas, R. H., Goetz, A. F. H. and Boardman, J. W., 1992. Dis-crimination among semi-arid landscape endmembers using the spectral angle mapper (sam) algorithm. In: Summaries of the third annual JPL airborne geoscience workshop, Vol. 1, pp. 147– 149.
Zhang, Y., 1999. A new merging method and its spectral and spatial effects. International Journal of Remote Sensing 20(10), pp. 2003–2014.