THE USAGE OF RUSBOOST BOOSTING METHOD FOR CLASSIFICATION OF
IMPERVIOUS SURFACES
M. H. Kesikoglu a, *, U. H. Atasever a, C. Ozkan a , E.Besdok a
a
University of Erciyes, Engineering Faculty, Department of Geomatics Engineering, 38039 Kayseri, Turkey - (hayrikesikoglu, uhatasever, cozkan, ebesdok)@erciyes.edu.tr,
Commission VII, WG VII/4
KEY WORDS: RUSboost, Classification tree, Impervious surface, Image classification, Remote sensing
ABSTRACT:
Impervious surface areas are artificial structures covered by materials such as asphalt, stone, brick, rooftops and concrete. Buildings, parking lots, roads, driveways and sidewalks are shown as impervious surfaces. They increase depending on the population growth. The spatial development of impervious surface expansion is necessary for better understanding of the urbanization status and its effect on environment. There are different impervious surface determining approaches met in literature. In this paper, it is aimed to extract the impervious surface areas of Kayseri city, Turkey by using remote sensing techniques. It is possible to group these techniques under a few main topics as V-I-S (vegetation-impervious surface-soil) model, based on spectral mixture analysis or decision tree algorithms or impervious surface indices. According to these techniques, we proposed a new technique by using RUSBoost algorithm based on decision tree in this study. In this scope, Landsat 8 LDCM image belonging to July, 2013 was used. Determining of impervious surface areas accurately depends on accuracy of image classification methods. Therefore, satellite image was classified separately by using Classification Tree and RUSBoost boosting method which increases accuracy of the classification method based on decision tree. Classification accuracies of these supervised classification methods were compared and it was observed that the best overall accuracy was obtained with RUSBoost method. For this reason, RUSBoost method was preferred to determine impervious surface areas. The overall accuracies were obtained 95% with Classification Tree and 97% with RUSBoost boosting method.
* Corresponding author. Tel: +90 (352) 2076666-32658 Fax: +90 (352) 4375784 1. INTRODUCTION
When population distribution throughout the world is examined, it is indicated that 54% of people are living in urban areas, this condition will increasingly continue and this rating will reach to the level of 66% percent by 2050 according to 2014 reports of United Nations. When Turkey is considered, it is estimated that this ratio is 73% and will become 84% in 2050 within the frame of the researches performed (URL-1,2014). It is seen that residential, occupational and transportation areas and settlements developed by rapid expansion in urban areas have become a constantly growing fact subject to population increase (Shahtahmassebi et al., 2012). The constructions built in line with increasing requirements are signs that the natural environment and climate are adversely affected in contrast to being positive signs of growth and wealth. The increasing number of buildings lead to disruptions in natural habitat by giving rise to decrease in stream levels, decrease in water quality, changes in land surface temperatures, increase in the frequency of storm and flood disasters (Weng, 2012). Therefore, it is of great importance that environmental changes are examined and the interaction between man and environment is identified.
The impact of settlements with increasing extensiveness on environmental change is understood by the identification of the interaction with the impervious surface area-ISA. Surfaces such as building surfaces and roof spaces, roads, car parks, pavements, etc. constructed with waterproof materials such as asphalt, stone, concrete are called impervious surfaces-IS
(Arnold and Gibbons, 1996). Many techniques exist that are used to describe and determine the quantity of IS, one of which is remote sensing. Measurements are performed via earth observation satellites using remote sensing techniques. Image data sets are acquired as a result of these measurements. These images acquired are examined using classification techniques and spatial analysis is performed.
When methods used to acquire ISA from remotely sensed data sets are considered, it is seen that the methods used for the determination of ISA can be divided into five different groups: 1) through manual or half-automatic selection of areas to be classified in the image and identification of class labels in consequence of visual interpretation (Jennings et al., 2004; Gluch et al., 2006); 2) evaluation of classified impermeability results in the light of the data collected from other data sources such as vegetation cover and soil (VIS-Vegetation-Impervious Surface-Soil model) (Phinn et al., 2002; Okujeni et al., 2015); 3) by using indices such as IS, vegetation cover, water, etc. (Bauer et al., 2004; Yang and Liu, 2005; Wang et al., 2015); 4) by using spectral mixture analysis - SMA (Phinn et al., 2002; Wu and Murray, 2003), 5) by using decision tree algorithm (Xian et al., 2008; Couturier et al., 2011).
In this study, image classification performances have been assessed by using the decision tree method and decision tree-based RUSBoost boosting methods used in improving the accuracy of classification methods. Afterwards, the image has been classified using the classification method providing the highest overall accuracy value.
2. STUDY AREA AND DATA
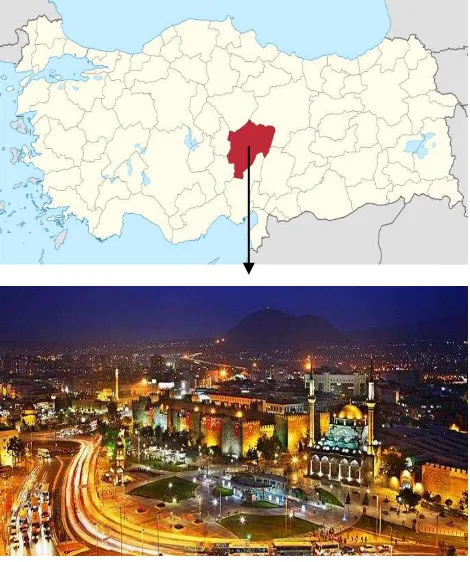
The city centre, industrial area and residential areas of Kayseri province were selected as the study area. Kayseri, our study
area, is located between 34° 56’ and 36° 59’ east longitudes and
37° 45’ and 38° 18’ north latitudes. One of the provinces of
Turkey with metropolitan status, Kayseri is proceeding with rapid urbanization. It has a population of 1,322,376 people
according to year 2014 data. It is also Turkey’s 15th most
crowded city. One of the oldest cities of the world, Kayseri is located in the region called Cappadocia during the classical ages. Furthermore, the Silk Road also passed through here. The city has therefore attracted the attention of all nations during every era, serving as the cradle of many civilizations (URL-2). Figures 1, 2 and 3 show respectively a map indicating the location of Kayseri, the study area amongst other provinces of Turkey, a photograph of the study area and Landsat 8 satellite image dated July 11, 2013.
Figure 1 and 2: A map indicating the location of Kayseri and a photograph of the study area
Figure 3: Landsat 8 LDCM satellite image dated July 11, 2013
3. THE METHODS USED 3.1 Classification Tree Method
Decision trees-DT are one of the image classification methods generated by Breiman et al. in 1984 and amongst the most significant subjects of data mining. This method is also known as one of the multistage classification methods. DT-based Classification Tree (CT) method is intensely used in many different disciplines as it is extremely fast and adaptive. In a CT analysis, the tree configuration is classified downwardly by the decision tree classifier from the root towards the leaves. Three sections signified as the root, leaf and branch exist within this tree structure. The root is the section with no incoming data edges or excessive number of outgoing edges located on top part of the CT mechanism. The section called the node is the unit with only one incoming edge and one or more outgoing edges. The section with one incoming edge but no other outgoing edge is called the leaf. The parts between the root and leaves is called the branch (Tan et al., 2006). A class label is assigned to each leaf on the decision tree. The root and other nodes include the edges to be used for classifying the data. Once the CT structure is developed, the test data can also be easily classified. The test data is fed into the CT structure through the root section of the tree. The test data is moved downwards according to the decision mechanism created and classification process is completed by dividing into sub-units until a leaf is reached (Tan et al., 2006). Furthermore, CT
classification method operates on “If-then” logic. The primary
objective of the method is to provide that the data is classified into suitable groups in the fastest and most accurate way
according to the conditions generated by the “If-then”
mechanism.
The most significant characteristic differing the CT method from other decision trees is that it only allows double branching. That is to say, when selection is performed at a node, only two branches can exit through such node. Twoing Algorithm and Gini Algorithm are generally used in this method. In this study, Gini index has been preferred as the branching criteria.
3.2 Boosting Method
One of the most fundamental problems with respect to classification is the uneven distribution of the data indicating each different class within the training data set (Seiffert et al., 2008). This problem is encountered with in many image classification applications (Kumar, 2012). Data sampling and boosting algorithms can be used in order to decrease the data distribution imbalance in classes (Govindaraj and Lavanya, 2013). Data sampling balances the class distribution within the training data set by either adding data to the minority class (oversampling) or extracting data from the majority class (undersampling).
The boosting method (Schapire, 1990) is one of the well-known machine learning techniques. A weak classifier is selected in each boosting iteration and trained using different sample distributions. These classifiers are then weighted and a boosted classifier is generated by weighting the weak classifiers with linear combination of other classifiers. By this way, classification accuracy is improved. When compared with other methods, it is considered an advantage that boosting operates without having to perform precision adjustment. In addition, boosting method is also resistant against overfitting. Thanks to these advantages, the use of boosting method is continuing to become widespread today. Boosting methods are used in land The International Archives of the Photogrammetry, Remote Sensing and Spatial Information Sciences, Volume XLI-B7, 2016
surface classification, medical classification, computational biology, computer vision and many other fields (Liu and Vemuri, 2011). When literature is examined, it is seen that classification has been performed using many boosting methods
(Özkan et al., 2008; Kumar, 2012). RUSBoost method was used
in this study.
3.2.1 Rusboost Boosting Method
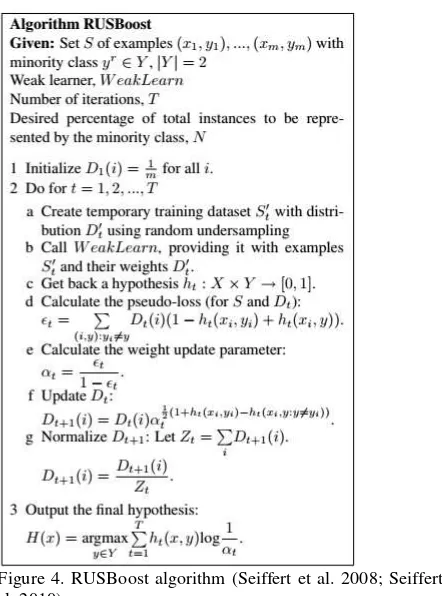
The RUSBoost algorithm is used for improving the performance of the trained data set acquired from the skewed data set. In other words, RUSBoost is one of the methods that eliminate the data distribution imbalances between the classes and improve the classification performance of the weak classifiers. RUSBoost is a hybrid data sampling/boosting algorithm. A few methods are recommended with respect to data sampling. One of these methods is random resampling. RUS (random undersampling) in RUSBoost method refers to random data extraction; i.e., the method randomly deletes data from the training data set until the intended balanced class distribution is achieved (Seiffert et al. 2008; Seiffert et al. 2010). RUSBoost is also accepted as a kind of advanced data sampling technique. Boosting can be performed by both weighting and re-sampling. In this method, re-sampling is performed according to the weights given to samples included in the training data set (Hulse 2007). RUSBoost method yields both advantages and disadvantages. While data extraction in data distribution until the desired balance is achieved is a disadvantage, the reduction of the time required for model training is considered an advantage. Furthermore, this algorithm is one of the methods producing the fastest results amongst the hybrid boosting algorithms. RUSBoost algorithm is presented in Figure 4.
Figure 4. RUSBoost algorithm (Seiffert et al. 2008; Seiffert et al. 2010)
In the first step, each sample weight is taken as , where m is the number of samples within the training data set. T weak hypotheses are trained according to the sequence of procedures in step 2. In step 2a, random undersampling is applied on the
samples within the majority class until they reach the N% level.
belong to the minority class; therefore, it will have a new
weight distribution ( ). In step 2b, and become primary
learners and WeakLearn create the weak hypothesis . In step
2d, the Pseudoloss (based on the original training data set S and weight distribution Dt) is calculated. The weight update
parameter α is calculated in step 2e. Weight distribution is
updated for another iteration (step 2f) and normalized (step 2g). In step 3, H (x) final hypothesis which is the weighted
version of T weak hypothesis is acquired. In equations, is a
point in X feature space, is a class label and t is an iteration between one and maximum number of iterations T (Seiffert et al. 2008; Seiffert et al. 2010).
4. RESULTS AND DISCUSSIONS
Year 2013 Landsat 8 LDCM satellite image of Kayseri province was used in this study. The training areas best demonstrating the state of the land were identified by geodetic works in order to determine the ISA and land surface classes to be specified on the satellite image. The training data determined is divided into six classes: IS-1 (industrial area), IS-2 (urban area), IS-3 (road), vegetation, soil-1 and soil-2. Test data has been used in order to determine the accuracy of the classification methods.
Gini index was preferred since higher accuracy can be achieved as the branching criteria in classification by the classification tree method. Classification was performed with respect to 1000 different iterations by using each of the Classification tree and RUSBoost methods on the same data set and it was determined which combination of these methods was the best in delivering the classification result. The parameters regarding the classifications performed are shown in Table 1 and Table 2.
Table 1. Parameter values belonging to Classification tree method
Observation No Leaf Number Overall Accuracy (%)
1 176 92,35
Table 2. Parameter values belonging to RUSBoost method
Observation
7 32 220 0,7303 94,67
8 32 130 0,9625 94,58
9 31 160 0,6044 94,67
10 26 380 0,5811 94,77
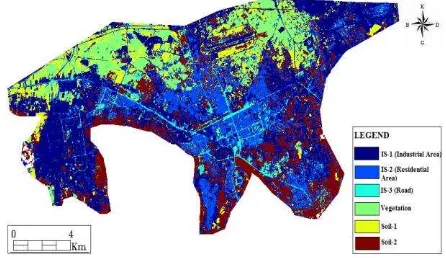
Table 1 and Table 2 show ten different combinations randomly selected amongst the iterations with respect to the Classification tree and RUSBoost classification methods. When these values are considered, it is seen that the changes in the leaf number, weak learner, learning rate and parent (each branch node in the tree has at least parent observations) criteria affect the overall classification accuracy. When both tables are examined, it is seen that the highest overall accuracy was achieved by 97.29% according to the observations acquired by the RUSBoost method in Table 2. It has been seen that using suitable parameter values with the RUSBoost method yielded results with higher accuracy than the Classification tree method. Therefore, determination of the land cover was performed by using the combination of the RUSBoost method delivering the best result. The thematic classified image of the land cover is presented in Figure 5.
Figure 5: The thematic map produced via classification of IS
5. CONCLUSION
Determination of IS is a study of great importance in terms of environmental practices such as conservation and management of natural resources, urban and regional planning, etc. and required to be updated frequently. Images with different spatial resolution covering large geographical areas acquired at different times can be obtained through remote sensing. This enables the acquiring of IS areas by classification performed on the satellite images. One of the most significant factors affecting the accuracy of the study performed is the success of the classification method. Therefore, selection of the classification method is of high importance. Today, methods which we can call hybrid algorithms that improve the accuracy of the classification methods have been developed thanks to the advancements in image processing. One of these methods is the boosting method. In this study, the satellite image was classified using each of the decision tree-based classification tree and RUSBoost methods. Numerous different combinations were applied with respect to the classification criteria of the classification methods and the classification method yielding the highest accuracy was investigated. In consequence, it was seen that the highest accuracy was acquired by the RUSBoost classification algorithm. As a result of the works performed, RUSBoost method was used as it provided higher classification accuracy and the IS areas in Kayseri were acquired.
Furthermore, it was set forth that the RUSBoost classification method increased classification accuracy when suitable classification parameters were used.
Acknowledgement
The authors would like to thank The Scientific and Technological Research Council of Turkey. This study has been supported by The Scientific and Technological Research Council of Turkey under the study with application number 1649B031501703 within the frame of 2211-C Domestic Doctoral Scholarship Program Intended for Priority Areas.
REFERENCES
Arnold C. L., Gibbons C. J., Impervious Surface Coverage: The Emergence Of A Key Environmental Indicator, Journal of the American Planning Association, 62, 243–258, 1996.
Bauer M.E., Heinert N.J., Doyle J.K., Yuan F., Impervious surface mapping and change monitoring using Landsat remote
sensing. In
Proceedings of American Society of Photogrammetry and Remote Sensing Annual Conference, 24–28 May 2004, Denver, Colorado, USA.
Breiman, L., Friedman, J. H., Olshen, R. A., & Stone, C. J. 1984. Classification and regression trees. Belmont, CA: Wadsworth International Group.
Couturier S., Ricardez M., Osorno J., Lopez-M. R., Morpho-spatial extraction of urban nuclei in diffusely urbanized metropolitan areas. Landscape and Urban Planning 101: 338– 348, 2011.
Gluch R., Quattrochi D. A., Luvall J.C., 2006. A multi-scale approach to urban thermal analysis. Remote Sensing of Environment, 104(1): 123–132.
Govindaraj M. and Lavanya S., 2013. A combined boosting and sampling approach for imbalanced data classification, Int. J. Adv. Res. in Data Mining and Cloud Computing, 1(1), 44-50.
J. Van Hulse, T. M. Khoshgoftaar, and A. Napolitano,
“Experimental perspectives on learning from imbalanced data,” in Proc. 24th Int. Conf. Mach. Learn., Corvallis, OR, Jun. 2007, pp. 935–942.
Jennings DB., Jarnagin ST., Ebert CW., 2004. A modelling approach for estimating watershed impervious surface area from National Land Cover Data 92. Photogrammetric Engineering and Remote Sensing 70(11): 1295–1307.
Kumar B. S., 2012. Boosting techniques on rarity mining. Int. J. Adv. Res. in Computer Science and Software Engineering, 2(10), 27-35.
Liu M. and Vemuri B. C., 2011. Robust and efficient regularized boosting using total bregman divergence, IEEE Conference on Computer Vision and Pattern Recognition, Colorado Springs, USA, ss. 2897-2902.
Okujeni, A., Van der Linden, S., Hostert, P., 2015. Extending the vegetation-impervious-soil model using simulated EnMAP data and machine learning, Remote Sensing of Environment, 158:69-80.
Ozkan C., Sunar F., Berberoglu S. and Donmez C., 2008. Effectiveness of boosting algorithms in forest fire classification, ISPRS Conference Vol. XXXVII. Part B7. Beijing, China, ss. 625-630.
Phinn S., Stanford M., Scarth P., Murray A. T., Shyy P.T., 2002. Monitoring the composition of urban environments based on the vegetation impervious surface-soil (VIS) model by subpixel analysis techniques, International Journal of Remote Sensing 23(20): 4131–4153.
Schapire, R. E., 1990. The strength of weak learnability.
Machine Learning. 5(2), pp. 197–227.
Seiffert C., Khoshgoftaar T. M., Hulse J. V., Napolitano A., 2008. RUSBoost: Improving classification performance when training data is skewed, IEEE 19th International Conference on Pattern Recognition, Tampa, FL, USA, ss. 1-4.
Seiffert C., Khoshgoftaar T. M., Hulse J. V. and Napolitano A., 2010. Rusboost: A hybrid approach to alleviating class imbalance, IEEE Transactions On Systems Man and Cybernetics, 40(1), 185-197 pp.
Shahtahmassebi A., YU Z., Wang K., Xu H., Deng J., Li J., Luo R., Wu J., Moore N., 2012. Monitoring rapid urban expansion using a multi-temporal RGB-impervious surface model, Applied Physics & Engineering.
Tan P-N., Steinbach M. and Kumar V., 2006. Introduction to Data Mining. Addison-Wesley Companion Book Site, USA, pp. 150-155.
URL-1, World Urbanization Prospects - The 2014 Revision, 2014. http://esa.un.org/unpd/wup/highlights/wup2014-highlights.pdf, Access Date: 26.02.2016.
URL-2, https://tr.wikipedia.org/wiki/Kayseri, Access Date: 02.03.2016.
Wang Z., Gang C., Li X., Chen Y. and Li J., Application of a Normalized Difference Impervious Index (NDII) to Extract Urban Impervious Surface Features Based on Landsat TM Images, International Journal of Remote Sensing, 36(4), 1055-1069, 2015.
Weng Q., 2012. Remote Sensing Of Impervious Surface In The Urban Areas: Requirements, Methods, and Trends, Remote Sensing of Environment, 117, 34-49.
Wu C., Murray A. T., Estimating impervious surface distribution
by spectral mixture analysis. Remote Sensing of Environment 84(4):493–505, 2003.
Xian G., Crane M., McMahon C., Quantifying multi-temporal urban development characteristics in Las Vegas from Landsat and ASTER data. Photogrammetric Engineering and Remote Sensing, 74: 473–481, 2008.
Yang X., Liu Z., Use of satellite-derived landscape imperviousness index to characterize urban spatial growth. Computers, Environment and Urban Systems 29(4): 524–540, 2005.