TECTONIC MOTION OF MALAYSIA: ANALYSIS FROM YEARS 2001 TO 2013
J. Gill, N. S. Shariff, K. Omar, Z. M. Amin
Faculty of Geoinformation and Real-Estate, Universiti Teknologi Malaysia, 81310 Skudai, Johor – [email protected]
KEY WORDS: Tectonic Motion, Earthquakes, GNSS
ABSTRACT:
This paper seeks to investigate the tectonic motion of Malaysia using the Malaysian Active GPS Station (MASS) and Malaysia Real-time Kinematic GNSS Network (MyRTKnet) data from years 2001 to 2013. GNSS data were processed using Bernese 5.0, and plotted as a time series; whereby the period before and after the 2004 Sumatra-Andaman mega earthquake are plotted separately. From the time series, episodic events and stable inter-seismic deformation period are analysed. The results indicate that the 2001-2004 and 2008-2011 periods were free from episodic events; hence, chosen to depict the tectonic motion of Malaysia before and after 2004 Sumatra-Andaman earthquake, respectively. The motion had a major change in direction and rate, especially for East Malaysia and South Peninsular Malaysia. This indicates there exist a long-term post-seismic deformation due to the 2004 mega earthquake. Nonetheless, the 2008-2011 inter-seismic period is stable, and suitable to represent the current long-term tectonic motion of Malaysia: Peninsular and East Malaysia moves south-east, at an average velocity of 0.89 ±0.01 cm/yr south and 1.70 ±0.02 cm/yr east, and 1.06 ±0.01 cm/yr south and 2.50 ±0.02 cm/yr east, respectively. In addition, the co-seismic motion for the 2005 Nias, 2007 Bengkulu and 2012 Northern Sumatra earthquakes after the 2004 Sumatra-Andaman earthquake are relatively small, indicating these three earthquakes have no significant contribution to the long-term tectonic motion of Malaysia. Overall, this paper aims to provide a general insight into the tectonic motion of Malaysia which, expectedly, may benefit other scientific fields.
1. INTRODUCTION
The earth is dynamic in nature as it undergoes geological and dynamic processes which, broadly speaking, alters the shape or, specifically, the terrain of the earth. These processes include earthquakes, landslides, volcanic eruptions, ice sheet melting, etc., of which may cause significant damages to society. Studying these processes leads to better understanding their behaviour; hence, employing appropriate mitigation and adaptation measures.
In Malaysia, the major natural processes that affects its landscapes are flooding, landslides and earthquakes. However, the study on plate tectonics and earthquakes in Malaysia is minimal as the effects are still within the safe zone when compared to the other processes, and countries such as Nepal and Indonesia. Yet, an instance whereby an earthquake had a devastating effect in Malaysia was the 9.2 Mw 2004 Sumatra-Andaman mega earthquake which resulted in long-term post-seismic deformation within the Sunda plate (Paul et. al., 2012). The implication of earthquakes are not solely in terms of socio-economics, but affects the sciences as well such as surveying and mapping.
With recent developments in technology, studying plate tectonics and earthquakes have become much simpler and straightforward, especially with the advent of Global Navigation Satellite System (GNSS) and presence of a dense geodetic network of Continuously Operating Reference Stations (CORS); comprising daily GNSS data that span many years. By generating a time series of GNSS solutions for each CORS, plate tectonic motion can be analysed with regard to its seismic activity. Therefore, this paper seeks to investigate the tectonic motion of Malaysia via employment of the Malaysia Real-time Kinematic GNSS Network (MyRTKnet) and Malaysian Active GPS Station (MASS) with GNSS data spanning from 2001 to 2013. A time series of daily solutions and velocity vectors map is plotted to study the tectonic motion of Malaysia. Overall, the
study aims to contribute to the understanding of tectonic motion of Malaysia, which may benefit other scientific fields, such as geoscience as well as risk management.
2. REVIEW ON SEISMICITY IN MALAYSIA
Tectonic plates are in continuous steady motion; however, when an earthquake occurs, this steady motion is interrupted due to the seismicity of the earthquake. Seismicity, or seismic activity, refers to the frequency, magnitude and distribution of earthquakes in a given area. For each seismic event, i.e., earthquake, it undergoes a cycle, called either a seismic or earthquake cycle. The deformations during an earthquake cycle are (Hetland and Hager, 2006): (1) pre-seismic, i.e., tectonic motion before an earthquake occurs, (2) co-seismic, i.e., tectonic motion, or instantaneous displacement, during an earthquake at the time of fault rupture, (3) post-seismic, i.e., tectonic motion that lasts weeks to decades following a fault rupture, and (4) inter-seismic, i.e., the relatively steady tectonic motion that occurs after the post-seismic deformation has decayed. Thence, the earthquake cycle contributes to the understanding of tectonic motion for a given area.
Malaysia is located on the Sunda tectonic block, encompassing a large part of Southeast Asia (Simons et. al, 2007). In the past, Malaysia was considered to be on a relatively stable continent, where it was far from catastrophic events caused by plate tectonics such as earthquakes and volcanic eruptions. However, when the 9.2 Mw Sumatra-Andaman mega earthquake occurred on December 26, 2004, this fact has changed. During the Sumatra-Andaman earthquake, the nearest sites from the epicentre showed very large co-seismic displacements: 27 cm in Phuket, Thailand, 17 cm in Langkawi, Malaysia, and 15 cm in Sampali, Indonesia (Vigny et. al., 2005). Moreover, after the 2004 Sumatran-Andaman, the post-seismic relaxation processes has been continuing for years in Andaman (Paul et. al., 2012). ISPRS Annals of the Photogrammetry, Remote Sensing and Spatial Information Sciences, Volume II-2/W2, 2015
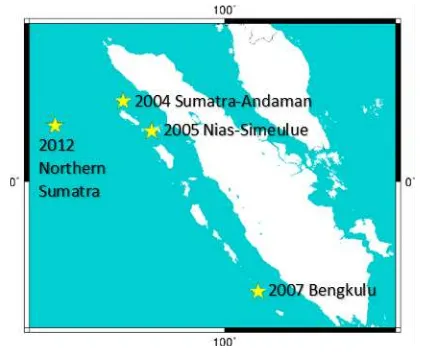
After the 2004 Sumatra-Andaman mega earthquake, there have illustrates the location of epicenter for each earthquake.
Figure 1. Location of epicenters for major earthquake affecting Malaysia from 2004 to 2013
Henceforth, there have been a number of studies regarding the tectonic motion of Malaysia, i.e., DSMM (2009), Omar et. al. (2010), Shariff et. al. (2014). However, each study has differing MyRTKnet data span, whereby DSMM (2009) used data from December 2004 to April 2009, Omar et. al. (2010) utilised data from December 2004 to December 2008, and Shariff et. al. (2014) processed 2011 data and compared it with Geocentric Datum of Malaysia 2000 (GDM2000) published coordinates. Nonetheless, all three studies prove that Malaysia is evidently affected with moderate seismicity due to the Sumatran subduction zone, of which has caused significant tectonic motion. Hence, the focus of this paper is to improve the understanding of tectonic motion in Malaysia with a longer data span, 2001 to 2013; defining the motion before the pivotal 2004 Sumatra-Andaman earthquake, and the effects after, including the co-seismic motion for the 2005 Nias, 2007 Bengkulu and 2012 Northern Sumatran earthquakes as well.
3. METHODOLOGY FOR TIME SERIES ANALYSIS
OF MYRTKNET DAILY SOLUTIONS
Several steps were implemented for the purpose of investigation into the tectonic motion of Malaysia. The first step was to process selected MyRTKnet stations and IGS stations via Bernese 5.0 (Dach et. al., 2007); hence, producing coordinate results in a single reference frame, i.e., ITRF2008. The second step was to plot a time series for the selected MyRTKnet stations to study the tectonic motion trend. The last step involved mapping the MyRTKnet station velocity vectors, which is estimated using linear least squares regression analysis from the time series of daily solutions; this step serves as the primary results for the investigation into the tectonic motion of Malaysia. GPS Interactive Time Series Analysis software (GITSA) (Goudarzi et. al., 2013) was employed to plot the time series and perform linear least squares regression analysis, while
Generic Mapping Tools (GMT) (Wessel and Smith, 1998) was used to map the velocity vectors.
3.1High-precision GPS processing for MyRTKnet
To estimate daily solutions of the MyRTKnet stations, Bernese high-precision GNSS processing software version 5.0 was used by employing its double difference quasi-ionosphere free (QIF) strategy. 65 MyRTKnet stations and 24 IGS stations were chosen with GNSS data spanning from December 2004 to December 2013. Only 15 out of the 24 IGS stations were selected (see figure 2) as fiducial stations for datum definition as they represented stable motions throughout the data time span. The processing strategy and parameters adopted are given in table 1.
Figure 2. Fiducial and non-fiducial IGS stations selected for Bernese processing
Table 1. Processing strategy and parameters used for Bernese processing 10 ° for first network GPSEST to final ADDNEQ2
Sampling Rate 30 seconds
Orbits IGS Final Orbit (.SP3)
Antenna Phase Centre PHAS_COD.I08
Ambiguity Resolution Fixed, by QIF strategy with baselines < 2000km ISPRS Annals of the Photogrammetry, Remote Sensing and Spatial Information Sciences, Volume II-2/W2, 2015
Finally, the daily solutions from 1st December 2004 to 31st December 2013 were plotted in a time series of station positions as a preliminary investigation into the trend, i.e., tectonic motion of Malaysia. The methodology, including the selected IGS stations, was repeated for GNSS data from 1st January 2001 to 25th December 2004; however, only 18 Malaysian Active GPS Stations (MASS) were available for said period. Note that only a few stations were kept operational during the transition from MASS to MyRTKnet; hence, processed separately. The purpose of GNSS data for this period is to depict the tectonic motion of Malaysia before the December 2004 Sumatra-Andaman mega earthquake.
3.2Time-series analysis and velocity estimation of MyRTKnet
After the daily solutions were estimated, a time series of daily solutions for the selected MyRTKnet stations were plotted using GITSA, a software developed by Goudarzi et. al. (2013) for time series analysis using MATLAB. With GITSA, daily SINEX solutions were converted to Cartesian coordinates and stored in GTS format files for each station. The Cartesian coordinates were then converted to local (North, East, Up) coordinates, replacing the Cartesian coordinates in the GTS files. Note that the Up component is the ellipsoidal height.
Once each station’s time series was plotted, the outliers were removed as it may affect the linear regression line later for estimating the velocity vectors. This was executed automatically via GITSA through outlier detection and removal. All outliers were removed at 99% confidence level. The linear least squares regression analysis was executed within GITSA as well. The standard deviation for each time series is displayed to represent the stability of the positions; of which small and infrequent fluctuations will result in a small standard deviation value. Time series with jumps, e.g. co-seismic motion, apparent annual and semi-annual effects, and steep slopes, e.g., due to subsidence or active motion, will have a large standard deviation value.
The determination of velocity vectors from linear least squares regression must fulfil two criteria: (1) minimum of 4 years solution in order to reduce annual and semi-annual effects in geodetic time series, of which will cause biased estimated velocities (Blewitt and Lavallée, 2001), and (2) time series with long data gaps, i.e., few months, are not chosen to estimate the velocity vectors.
4. RESULTS AND DISCUSSION
There are four parts in this section to depict and understand the tectonic motion of Malaysia: (1) the plate tectonic motion before the 2004 Sumatra-Andaman mega earthquake, (2) the plate tectonic motion after the 2004 Sumatra-Andaman mega earthquake, (3) the current long-term plate tectonic motion of Malaysia which is unaffected by episodic events, i.e., co-seismic bias, and lastly (4) the co-co-seismic motion of each earthquakes that have affected Malaysia. Note that for the time series analysis, only a few stations will be chosen to depict the seismicity of Malaysia.
From the Bernese processing of daily solutions between years 2001 and 2004 (before the 2004 Sumatra-Andaman mega earthquake), ambiguity resolution showed results above 75%. Positional RMS error for MASS stations were below 1mm for the horizontal component and between 1mm and 1.5mm for the height component. Four stations are selected to represent the
seismicity of Malaysia: ARAU (North Peninsular), UTMJ (South Peninsular), MIRI (Sarawak), and KINA (Sabah) (see figure 3).
Std. Dev.: 1.9cm
Std. Dev.: 2.2cm
Std. Dev.: 1.4cm
ARAU
UTMJ
Std. Dev.: 1.0cm Std. Dev.: 1.8cm Std. Dev.: 1.5cm
MIRI
Std. Dev.: 1.5cm Std. Dev.: 1.6cm Std. Dev.: 2.5cm North
East
Up
North
East
Up North
East
Up
Figure 3. The time series of MASS daily solutions from 2001 to 2004 for the four selected stations and their standard deviations.
With reference to figure 3, the time series shows no co-seismic displacements between years 2001 and 2004 indicating no significant earthquakes had occurred. However, the time series is heavily affected by annual and semi-annual effects; nonetheless, with solutions spanning 4 years, these effects are considerably reduced for estimating the velocity vectors (Blewitt and Lavallée, 2001).
Area Stations Average Velocity (cm/yr) (2001 – 2004) Direction (degrees)
VN VE VU
North-west Peninsular Malaysia – Perlis, Kedah, Perak, Kelantan border, and Perak-Selangor border
ARAU, USMP -1.55 ±0.03 1.77 ±0.03 -0.63 ±0.05
144.1990 North-east Peninsular Malaysia
– Kelantan, Terengganu, Pahang
GETI, KUAL, KUAN -1.65 ±0.03 1.68 ±0.03 -0.49 ±0.05
Central Peninsular Malaysia –
Selangor and Negeri Sembilan KTPK, SEGA -1.57 ±0.03 1.66 ±0.03 -0.48 ±0.05
South Peninsular Malaysia –
Melaka and Johor UTMJ -1.21 ±0.03 1.40 ±0.03 -0.32 ±0.04
Sarawak, Malaysia BINT, KUCH, MIRI -2.18 ±0.03 1.32 ±0.03 -0.83 ±0.06
159.8163
Sabah, Malaysia KINA, LABU, SAND -2.32 ±0.03 1.19 ±0.03 -0.99 ±0.06
Table 2. Averaged velocities of Malaysia and their directions, categorised by area, from linear regression analysis of MyRTKnet station positions from 2001 to 2004 (before 2004 Sumatra-Andaman earthquake – 26 December 2004). Note that SEGA is located near the border of Johor-Negeri Sembilan; however, as the velocity is closest to KTPK, the authors decided to group it under Central to avoid any average bias. VN, VE, and VU represent the north component velocity, east component velocity, and up component velocity, and their standard errors, respectively
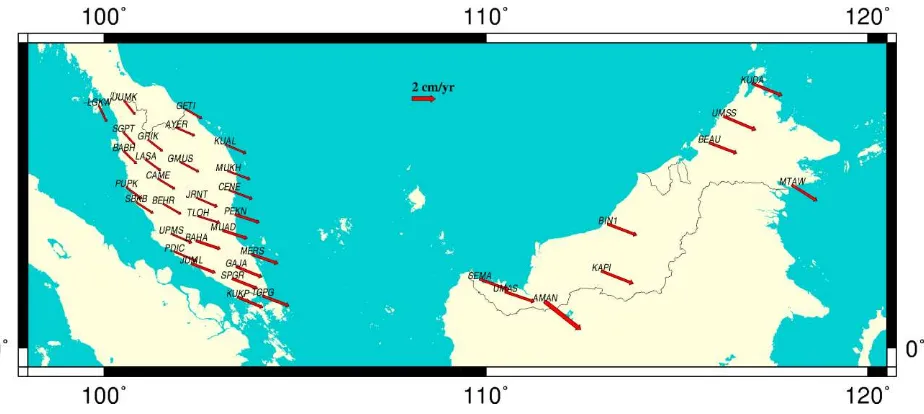
Figure 4. MASS velocity vector map for years 2001 to 2004 KINA
Std. Dev.: 1.7cm Std. Dev.: 1.5cm Std. Dev.: 2.6cm North
East
Up
From table 2 and figure 4, between years 2001 to 2004, Peninsular Malaysia moves south-east at an average velocity of -1.55 ±0.03 cm/yr for the north component, and 1.66 ±0.03 cm/yr for the east component, while East Malaysia (Sabah and Sarawak) moves south-southeast at an average velocity of -2.55 ±0.03 cm/yr for the north component and 1.26 ±0.03 cm/yr for the east component. Both regions are moving at almost the same velocity, yet the north component of East Malaysia has a 1 cm/yr difference compared to Peninsular Malaysia. The Up component is better analysed with regard to a particular station or region; thus, only the North and East velocities are focused. Based on the findings, MASS stations did not display any significant subsidence.
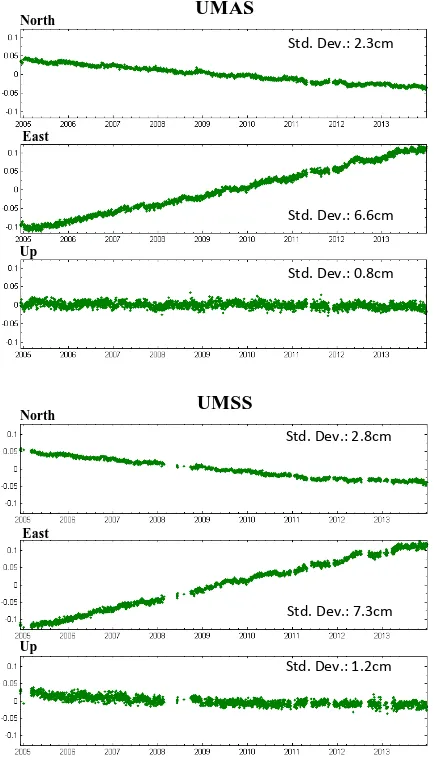
From the Bernese processing of daily solutions between years December 2004 and December 2013, most daily solutions provided excellent ambiguity resolution, on average, above 75%. Positional RMS error for MyRTKnet stations were mostly below 1 mm for the horizontal component and between 1mm to 1.2mm for the height component. Four stations are once again selected to represent the seismicity of Malaysia: LGKW (North Peninsular), TGPG (South Peninsular), UMAS (Sarawak), and UMSS (Sabah) (see figure 5).
Figure 5. The time series of MyRTKnet daily solutions from December 2004 to 2013 for the four selected stations and their standard deviations.
With reference to figure 5, the time series for all stations exhibits the four major earthquakes that affected Malaysia as stated in section 2 of this paper. The time series covers daily solutions from December 2004 to December 2013. Fortunately, from years 2008 to 2011 (4 years), Malaysia did not experience any episodic deformation. This four-year inter-seismic time-span then would adequately represent, with reduced velocity bias, the Malaysian current long-term tectonic motion since it excludes co-seismic displacement bias. However, as stated by Paul et. al. (2012), the 2004 Sumatra-Andaman earthquake had caused a long-term post-seismic relaxation process.
Std. Dev.: 3.7cm
Std. Dev.: 4.2cm
Std. Dev.: 1.2cm
LGKW
TGPG
Std. Dev.: 2.9cm
Std. Dev.: 5.7cm
Std. Dev.: 1.1cm
UMAS
Std. Dev.: 2.3cm
Std. Dev.: 6.6cm
Std. Dev.: 0.8cm
UMSS
Std. Dev.: 2.8cm
Std. Dev.: 7.3cm
Std. Dev.: 1.2cm North
East
Up
North
East
Up
North
East
Up North
East
Up
Area Stations Average Velocity (cm/yr) (2008 – 2011) Direction (degrees)
VN VE VU
North-west Peninsular Malaysia – Perlis, Kedah, Perak, Kelantan border, and Perak-Selangor border
ARAU, UUMK, LGKW, SIK1, SGPT, GRIK, BABH, LASA, GMUS, PUSI, PUPK, SBKB, BEHR
-1.09 ±0.02 1.17 ±0.02 -0.10 ±0.03 132.0767
North-east Peninsular Malaysia – Kelantan, Terengganu, Pahang
CAME, GETI, AYER, PASP, SETI, KUAL, TERI, MUKH, LIPI, JRNT, CENE, SRIJ, PEKN, TLOH, MUAD
-0.77 ±0.01 1.79 ±0.02 -0.16 ±0.03 112.8134
Central Peninsular Malaysia – Selangor and Negeri Sembilan
BENT, MERU, UPMS,
KLAW, BAHA, PDIC -0.81 ±0.01 1.89 ±0.02 -0.03 ±0.03 112.3999
South Peninsular Malaysia – Melaka and Johor
SEG1, KROM, JUML, GAJA, MERS, PRTS, SPGR, TGRH, JHJY, KUKP, TGPG
-0.85 ±0.01 2.18 ±0.02 -0.18 ±0.03 111.1570
Sarawak, Malaysia
SEMA, UMAS, SARA, KAPI, BIN1, NIAH, MRDI, MUKA
-1.00 ±0.01 2.56 ±0.02 -0.27 ±0.03
110.8854
Sabah, Malaysia
BEAU, KENI, TMBN, UMSS, RANA, BELU, MRDU, KUDA, MTAW, DATU, SEMP
-1.12 ±0.01 2.45 ±0.02 -0.07 ±0.03
Table 3. Averaged velocities of Malaysia and their directions, categorised by area, from linear regression analysis of MyRTKnet station positions from 2008 to 2011. VN, VE, and VU represent the north component velocity, east component velocity, and up component velocity, and their standard errors, respectively
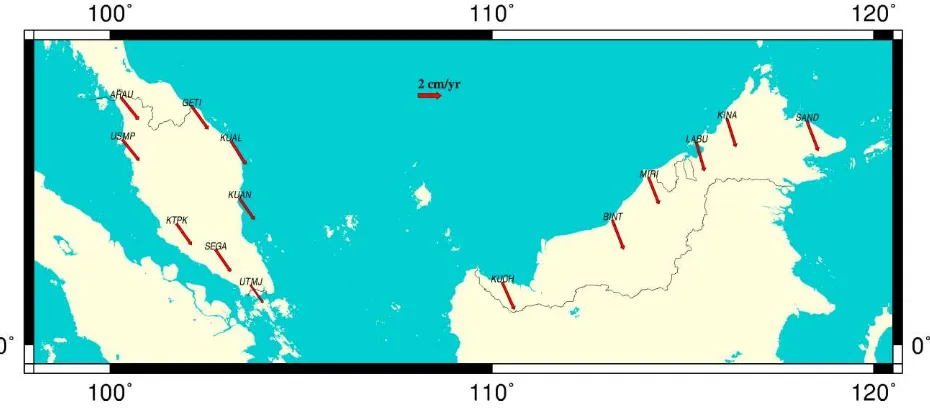
Figure 6. MyRTKnet velocity vector map for years 2008 to 2011. Note that fewer stations are displayed as the station names and arrows will overlap one another. As for East Malaysia, most stations began operation in April 2009; hence, they are not selected for velocity vector determination
From table 3 and figure 6, from 2008 to 2011, Peninsular Malaysia moves south-east at an average velocity of -0.89 ±0.01 cm/yr for the north component, and 1.70 ±0.02 cm/yr for the east component, while East Malaysia (Sabah and Sarawak) moves south-east as well, at an average velocity of -1.06 ±0.01 cm/yr for the north component and 2.50 ±0.02 cm/yr for the east component. Both regions are moving at almost the same velocity, yet the east component of East Malaysia has a 7 mm/yr difference compared to Peninsular Malaysia. The Up component is better analysed with regard to a particular station
or region; thus, only the North and East velocities are focused. Based on the findings, AMAN is the only station that exhibits a different direction with an exceptionally high velocity at 2.45 ±0.02 cm/yr north, 3.06 ±0.02 cm/yr east, and -3.35 ±0.03 cm/yr up. This is, without a doubt, due to land subsidence that occurs at the station; hence, it is removed from the average velocity results above.
Area
Velocity Difference (cm/yr) Direction
Difference (degrees)
∆VN ∆VE ∆VU
North-west Peninsular Malaysia -0.46 0.60 -0.53 12.1223
North-east Peninsular Malaysia -0.88 0.11 -0.33 31.3856
Central Peninsular Malaysia -0.76 0.23 -0.45 31.7991
South Peninsular Malaysia -0.36 0.78 -0.14 33.0420
Sarawak, Malaysia -1.18 1.24 -0.56
45.9309
Sabah, Malaysia -1.20 1.26 -0.92
Table 4. Velocity and direction differences between 2001-2004 and 2008-2011 periods
Analysing the tectonic motion before and after the 2004 Sumatra-Andaman mega earthquake, it is clearly observed the direction as well as the rates have changed prominently (see table 4). Before the earthquake, Peninsular Malaysia was undergoing steady tectonic motion, whereby both north and east component were almost similar in terms of rates; however, after the earthquake, the east component was affected the most as it has a much higher rate compared to the north component. Based on table 3, the major effect of the 2004 mega earthquake would be on the velocity gradient along Peninsular Malaysia, where the east component rates increases from north towards south region of Peninsular Malaysia. The difference between the rates of the north-west and south region are about 1cm/yr; nonetheless, in our opinion, this should not cause any horrendous effects since the direction of tectonic motion are relatively similar, except for the north-west region of Peninsular Malaysia with ~20 degrees difference than the other regions. This may be due to the fact that this region was the most affected by the 2004 mega earthquake, especially on the east component. Hence, overall, it can be deduced that the long-term post-seismic effect from the 2004 mega earthquake is still dominant.
As for East Malaysia, before the earthquake, the north component had a higher rate compared to the east component; however, after the earthquake, it was the opposite, whereby the east component has a higher rate than the north component. The possible reason for the abrupt change in velocity rates is due to the long-term post-seismic effect; even though East Malaysia was hardly affected, in terms of co-seismic deformation, the impact comprises the entire Sunda plate, whereby it seems East Malaysia – and to a degree, South Peninsular Malaysia – has the largest long-term effect in Malaysia. Nevertheless, the velocity gradient after the earthquake for East Malaysia is unnoticeable, e.g. almost uniform, unlike Peninsular Malaysia.
Due to the effect of the long-term post-seismic deformation, it is difficult to distinguish between inter-seismic and post-seismic deformations; hence, the authors prefer to adopt the definition by Hetland and Hager (2006) who defined inter-seismic deformation as any deformation during the earthquake cycle that excludes the co-seismic deformation, and includes post-seismic deformation. Therefore, the inter-post-seismic period between 2008 and 2011 is the most stable presently, and is suitable to be adopted as the current long-term tectonic motion of Malaysia. The effects from the recent 2012 Northern Sumatra earthquake is not studied in this paper due to the limitation of data; hence, the term ‘current’ is suitable since at least 4 years
of inter-seismic data is needed to appropriately study the long-term tectonic motion.
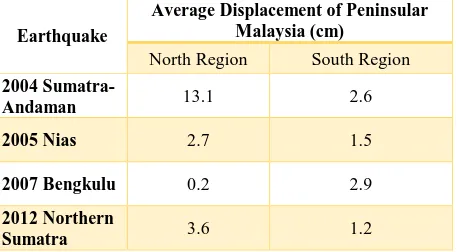
Episodic deformation, i.e., co-seismic displacement due to earthquakes, does not represent long-term tectonic motion, as it only causes instantaneous motions. However, permanent dislocation, i.e., offset, may occur causing a shift in station positions. Table 5 shows the results of the co-seismic displacement for the four major earthquakes. East Malaysia exhibited nil or minor displacements (below 5 mm) for all four earthquakes.
Table 5. Average co-seismic displacements in Peninsular Malaysia due to the four major earthquakes. Note that the directions of the co-seismic displacements are generally towards each of the earthquakes’ epicentres
From table 5, the co-seismic effect of the 2005 Nias, 2007 Bengkulu and 2012 Northern Sumatra earthquakes are less significant relative to the 2004 Sumatra-Andaman earthquake; hence, it would not have a considerable effect to the long-term tectonic motion of Malaysia. This finding is also supported by the time series of figure 5, whereby the tectonic motion has a similar trend before and after the co-seismic events, i.e., the motion returns to a steady state. However, as for the 2012 Northern Sumatra earthquake, this is still an assumption as the data limitation inhibits further study on its effects to the long-term tectonic motion of Malaysia.
To summarise, Malaysia undergoes both co-seismic and post-seismic deformation; however, the co-post-seismic deformations due to the earthquakes after the 2004 Sumatra-Andaman earthquake seem to have a less significant effect in terms of its spatial and temporal extent as depicted in figure 5 and table 5. Overall, Malaysia’s tectonic motion undergoes inter-seismic motion from 2008 to 2011, which serves as the current long-term ISPRS Annals of the Photogrammetry, Remote Sensing and Spatial Information Sciences, Volume II-2/W2, 2015
tectonic motion of Malaysia. However, further studies are needed to investigate the tectonic motion of Malaysia after year 2013, as the 2008-2011 period is still affected by the long-term post-seismic relaxation process due to the 2004 Sumatra-Andaman mega earthquake, as well as to study the effects of the 2012 Northern-Sumatra earthquake. Hence, it can be deduced here that Malaysia’s tectonic motion is not highly complex, instead it undergoes a rather rigid tectonic motion.
5. CONCLUSION
The objective of this paper has been achieved, whereby the tectonic motion of Malaysia has been investigated. Based on the results, it is evident that Malaysia is undergoing long-term inter-seismic deformation due to the 2004 Sumatra-Andaman earthquake. Changes in direction and rate for tectonic motion, before and after the earthquake are a definite result from this. Therefore, the current long-term tectonic motion of Malaysia is affected by post-seismic deformation; resulting in uncertainty in terms of the length or period for the long-term post-seismic deformation and whether the deformation direction and rate will finally return to the stable period, i.e., 2001-2004, of tectonic motion in Malaysia. The tectonic motion has, undoubtedly, caused Malaysia to shift, whereby the results of the inter-seismic deformation, 2008-2011, is as follows: Peninsular Malaysia moves south-east at an average velocity of -0.89 ±0.01 cm/yr for the north component, and 1.70 ±0.02 cm/yr for the east component, while East Malaysia (Sabah and Sarawak) moves south-east as well, at an average velocity of -1.06 ±0.01 cm/yr for the north component and 2.50 ±0.02 cm/yr for the east component. Moreover, the effect of the 2005 Nias, 2007 Bengkulu and 2012 Northern Sumatra earthquakes are less significant if compared to the 2004 Sumatra-Andaman earthquake; hence, it would not significantly affect the long-term tectonic motion of Malaysia.
In terms of survey and mapping, the present geodetic datum of Malaysia, GDM2000, will need to be revised as positions have evidently been shifted due to tectonic motion; since GDM2000 is based ITRF2000 at epoch 1 January 2000. Additionally, with respect to the relatively high deformation rate of East Malaysia and position offsets due to co-seismic motion, the period and method of revision for GDM2000 has to be reviewed. Many countries have utilised datum transformation and semi-dynamic datum approaches to overcome the need for frequent revisions, yet able to obtain positions in the present epoch.
This paper has analysed the tectonic motion of Malaysia mainly through the perspective of geodesy, i.e., velocity vectors. Thus, a call for collaboration with other scientific fields, e.g., geophysics, geology, etc., is vital in order to enhance research regarding the tectonic motion of Malaysia, such as to include seismology, earthquake mechanisms, strain rate analysis, etc., and to answer some questions regarding the variant velocity rates even only within a local area.
It is recommended that further studies are conducted to continuously monitor the tectonic motion of Malaysia even after 2013 in order to answer these uncertainties. As a side note, with regard to the recent Ranau, Sabah earthquake, other local faults may be reactivated in future, especially as Malaysia is affected by active seismic activity from the nearby inter-plate earthquakes. Moreover, it is proven from the results that it is unnecessary for an earthquake, especially mega earthquakes, to be close by for a region to be affected.
ACKNOWLEDGEMENTS
The authors would like to express our gratitude to MOSTI, UTM, Vote No. 4S074 for funding this research as well as Department of Survey and Mapping Malaysia for providing MASS and MyRTKnet data.
REFERENCES
Blewitt, G. and Lavallée, D., 2002. Effect of annual signals on geodetic velocity. Journal of Geophysical Research: Solid Earth, 107(B7).
Dach, R., Hugentobler, U., Fridez, P., & Meindl, M., 2007. Bernese GPS Software Version 5.0.
Department Survey and Mapping Malaysia (DSMM), 2009. Technical Guide to the Coordinate Reference Systems. Pekeliling Ketua Pengarah Ukur Dan Pemetaan Bilangan 1/2009.
Goudarzi, M. A., Cocard, M., Santerre, R., & Woldai, T., 2013. GPS interactive time series analysis software. GPS solutions, 17(4), pp. 595-603.
Hetland, E. A., & Hager, B. H., 2006. Interseismic strain accumulation: Spin‐up, cycle invariance, and irregular rupture sequences. Geochemistry, Geophysics, Geosystems, 7(5).
Paul, J., Rajendran, C. P., Lowry, A. R., Andrade, V., & Rajendran, K., 2012. Andaman postseismic deformation observations: Still slipping after all these years? Bulletin of the Seismological Society of America, 102(1), pp. 343–351.
Shariff, N. S. M., Musa, T. A., Omar, K., & Othman, R., 2014. The Geocentric Datum of Malaysia: Preliminary Assessment and Implications. In Geoinformation for Informed Decisions, pp. 71-83. Springer International Publishing.
Simons, W. J. F., Socquet, A., Vigny, C., Ambrosius, B. A. C., Haji Abu, S., Promthong, Subarya, C., Sarsito, D. A., Matheussen, S., Morgan, P., & Spakman, W., 2007. A decade of GPS in Southeast Asia: Resolving Sundaland motion and boundaries. Journal of Geophysical Research: Solid Earth, 112(B6).
U.S. Geological Survey, 2015. “Significant Earthquakes Archive” U.S.A http://earthquake.usgs.gov/earthquakes/ eqinthenews (1 May 2015)
Vigny, C., Simons, W. J., Abu, S., Bamphenyu, R., Satirapod, C., Choosakul, N., Subarya, C., Socquet, A., Omar, K., Abidin, H. Z., & Ambrosius, B. A. C., 2005. Insight into the 2004 Sumatra–Andaman earthquake from GPS measurements in Southeast Asia. Nature, 436(7048), pp. 201-206.
Wessel, P., & Smith, W. H. F., 1998. New version of the generic mapping tools released, Eos Trans. AGU, 79(47), pp. 579.