ROADS CENTRE-AXIS EXTRACTION IN AIRBORNE SAR IMAGES: AN APPROACH
BASED ON ACTIVE CONTOUR MODEL WITH THE USE OF SEMI-AUTOMATIC
SEEDING
R. G. Lotte, S. J. S. Sant’Anna, and C. M. Almeida
INPE, National Institute for Space Research, Avenida dos Astronautas, 1758 S˜ao Jos´e dos Campos-SP, Brazil
[email protected], [email protected], [email protected]
Commission WG VI/4
KEY WORDS:snakes, road extraction, semi-automatic seeding, SAR image
ABSTRACT:
Research works dealing with computational methods for roads extraction have considerably increased in the latest two decades. This procedure is usually performed on optical or microwave sensors (radar) imagery. Radar images offer advantages when compared to optical ones, for they allow the acquisition of scenes regardless of atmospheric and illumination conditions, besides the possibility of surveying regions where the terrain is hidden by the vegetation canopy, among others. The cartographic mapping based on these images is often manually accomplished, requiring considerable time and effort from the human interpreter. Maps for detecting new roads or updating the existing roads network are among the most important cartographic products to date. There are currently many studies involving the extraction of roads by means of automatic or semi-automatic approaches. Each of them presents different solutions for different problems, making this task a scientific issue still open. One of the preliminary steps for roads extraction can be the seeding of points belonging to roads, what can be done using different methods with diverse levels of automation. The identified seed points are interpolated to form the initial road network, and are hence used as an input for an extraction method properly speaking. The present work introduces an innovative hybrid method for the extraction of roads centre-axis in a synthetic aperture radar (SAR) airborne image. Initially, candidate points are fully automatically seeded using Self-Organizing Maps (SOM), followed by a pruning process based on specific metrics. The centre-axis are then detected by an open-curve active contour model (snakes). The obtained results were evaluated as to their quality with respect to completeness, correctness and redundancy.
1 INTRODUCTION
1.1 Motivation
The research on the use of aerial photography to generate carto-graphic products has intensified in recent decades. Applications such as the collection of altimetry in certain regions or updating maps the location of roads, buildings or other targets are exam-ples of acquisitions by remote sensing. The formation of images is usually performed by optical or radar sensors (Radio Detection and Ranging), on aircraft or satellites platforms, called airborne and orbital images, respectively.
The use of radar images for pattern recognition and land survey information about changes in targets on Earth’s surface has been widely used in areas such as geology, hydrology, oceanography, cartography and others. The operation of the radar imaging is based on transmitting and receiving microwave pulses. The im-ages are acquired by radiation emitted by the sensors, where part of the energy is absorbed by the object, part is lost, and the rest is backscattered. The energy backscattered returns to the sensor which performs the reading.
The radar imaging might have some disadvantages when com-pared to the optical imaging. The presence of noise inherent to its coherent imaging, signal distortion or interference by the so-phisticated processing for imaging are some examples of the ob-stacles faced. The noise from this type of imaging, called speckle noise, can be considered the greatest obstacle in targets recog-nition, always requiring that the generated image is subjected to preprocessing steps. However, the radar sensors has its own power source, called active sensors, allowing to acquire images
at any time, e.g. in regions with climatic adversity which the tar-gets are covered by clouds or in regions of dense forest where the topography is often obscured by forest canopy, both often found in the region of Brazil.
The research about the road extraction using synthetic aperture radar (Synthetic Aperture Radar - SAR) image emerged in the 70s, with the pioneering of Bajcsy and Tavakoli, 1976 and Quam, 1978, and it has been intensified since then. The road extraction using imaging radar is still an open scientific question, and ex-isting applications express differentiated solutions. This process is considered a major component in cartography [Doucette et al., 2004]. Some roads extractors require initial points to start the extraction process. These points, known as seeds points, repre-sent the approximate location of roads in the image. The Snakes method [Kass et al., 1987,Gruen and Li, 1997,Mayer et al., 1997] and automatic delineation [Zhao et al., 2002], are examples of methods that require seed points near of the object which, there-after, evolves either to the center axis or borders.
section 4, the advantages and disadvantages of the approach pre-sented.
2 CONCEPTS AND TECHNOLOGY
2.1 Related works
The development of techniques for road extraction in digital im-ages has been growing in the last two decades. The main re-search involving the resolution of this problem can be summed up in images from optical sensors and microwave, both present-ing different solutions. It is relatively difficult to find among these methods fully automated solutions, mostly, start the process from a knowledge a priorisuch as updating data in a geographical database system or the location of a prior road network provided by a human operator. Poz and Agouris, 2001 used the concept of dynamic programming [Bellman, 1954] for extracting symmetry axes of roads present in airborne and orbital optical images, in which the process is initiated by a human operator to determine points characterizing the seeds region of the road. Gruen and Li, 1996 presented a new approach for the extraction of roads in op-tical images, called Least Square B-Spline Snakes (LSB-Snakes), which uses manually supplied seed points for the adjustment of least squares combined with Active Contour Model [Kass et al., 1987].
Developed initially by Kass et al., 1987, the Active Contour Model or simply Snakes consists of an iterative and adaptive process for identifying contours of objects present in the scene, where an ini-tial polygonal curve is converged to object shapes. The progress of this curve toward the precise location of the road is achieved by minimizing its energy functional at each iterative cycle. Over the years of research, the method yielded efficient Snakes variations, including the geometric Level Set model [Osher and Sethian, 1988], a process that eliminates the prior parameterization of the curve. The Balloon model [Cohen, 1991], which allows the ac-quisition of the contours from the center of the object and does not require that the initial curve is near the boundary, which is required in the traditional approach.
The model presented by Kass et al., 1987 needs some adaptations to be applicable to the problem of extracting roads, one of these is the remodeling of the curve minimization process, precisaly because the traditional model consist of a closed curve, which would not be possible for the road object. Laptev, 1997 presented a hybrid approach using the concepts of linear feature extraction by differential geometry and contour extraction by Snakes, al-lowing the acquisition of the road boundaries in regions covered by trees or shadows caused by buildings. Bentabet et al., 2003 proposed a method for extracting roads in radar images, using Snakes as extractor method. In this approach the authors adjust automatically the parameters responsible to control the elastic-ity and rigidy of the curve. Butenuth, 2008 proposed a new ap-proach for obtaining the road network present in an image. The concept of degrees for each vertex presented by the author, al-lows the reconstruction of the matrix coefficients responsible to fit the curve and, consequently, the efficient identification of con-tours with open curves. However, the end points of each contour are fixed at the image boundaries, which does not allow the ex-traction of roads with abrupt endings, problem that is solved by G¨opfert, 2011.
points from the seeding process. In the following section, we present the details of each step.
2.2 General work flow
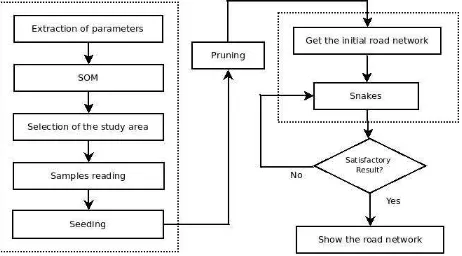
The main purpose of this paper is to present a solution that en-ables the extraction of roads present in airborne radar images of high resolution. The approach consists of a hybrid solution us-ing basically the concepts of seedus-ing and Active Contour Model [Kass et al., 1987]. The process flow diagram is shown in Fig-ure 1. The first step of the extraction process, called seeding (dashed square on the left, cf. section 2.3), represents the pre-identification stage. This step consists in a rough location of roads, where a seed is marked near or on these. The seed points acquired are refined in a process of pruning (cf. section 2.4), which the points that were erroneously marked are excluded. Fi-nally, the extraction process ends with the method Snakes (cf. section 2.5), where seed points are interpolated to be formed initial road network, which characterizes the input of the final method.
Figure 1: Fluxogram of the road extractor presented.
2.3 Seeding
For this study, is essential that the pre-identification of roads, rep-resented by seeding, has partial autonomy in the process. The approach taken in this study is the use of Self-Organizing Maps (SOM), or Kohonen maps [Kohonen, 1982], concept in Learning Machine, characterized by simulating, computationally, behav-iors and human learning. The idea of the Self-Organizing Maps refers to the human brain, wherein each region is responsible for specific sense. Likewise, the SOM network are characterized by the formation of a topographical map of input patterns which the location of each neuron in this map corresponds to the intrinsic characteristics of input patterns, that is, learning occurs present-ing to the neural network the shapes that should be recognized, called training patterns. In this case, the training patterns are ex-tracted from the observation of a SAR image, where are exex-tracted the values of some road and non-road profiles, Figure 2.
The SOM networks typically has only one input and an output layers. Each element of the output layer is connected to the input elementsXp, whereXis a vector of gray levels andpis the index
of the training pattern. For each of these connections there is a weight value, thus each element of the training patternXphas a
Figure 2: Examples of patterns of roads and non-roads to train the SOM network.
In the training process is obtained the location of the neuron with the lowest Euclidean distance in relation to the submitted entry, calculate by the equation:
i(X) =arg(j,k)min||W(j,k)−Xp||,
(
j= 1,2, ..., n k= 1,2, ..., n
(1)
where||.||denotes the Euclidean norm between the input values
XpandW(j,k).i(X)describes the position of the winner neuron
in the map given byarg(j,k), andnthe square root of the number
of neurons in the output layer [Haykin, 1994]. After obtaining the location of the winner neuron, the weights arrayW(j,k) is
adjusted, Equation 2.
W(t+ 1)(j,k)=W(t)(j,k)+η(t)∗σ(j,k)∗[Xp−W(t)(j,k)].
(2)
The values ofσfor a particular neuron(j, k)is given by Gaussian property:
σ(j,k)=e−(
dist 2∗radius2),
(3)
wheredistis the Euclidean distance between the winning neuron and the current neuron, andradiusthe radius of the neighbor-hood.
The learning rate decays every training cycle. The function that describes its decay is given by:
η(t) =η0[e−(
t
T)], (4)
whereη0is the initial learning rate, andTis the maximum
num-ber of iterations. The training process ends when all iterationsT
are completed.
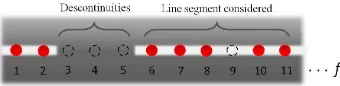
After training, the image is scanned by a window of predeter-mined size, wherein each step are read different profiles at differ-ent oridiffer-entations, as illustrated in Fig 3. Thus, during the reading samples are determined which of these patterns resemble those roads, previously submitted to the SOM network. The centroid of the samples that are flagged by the neural network as roads are called seed points.
2.4 Pruning
The set of seed points from this first process often comes with spurious points. The characteristics of SAR image or even the quantity and quality of the training patterns can sometimes con-fuse the SOM network, causing errors of commission or omis-sion as those commonly found in the results. Because of this effect, is performed in a process intermediary between seeding
Figure 3: Scanning the image for reading the set f samples, wherein each sample is obtainedk profiles roads (In the illus-tration, eight profiles).
and Snakes, a pruning process, which allows to eliminate the un-desirable points.
Each seed point is identified by an indexf, which corresponds to the sample sequence in reading. In the pruning process a seed point is kept if the inequalities below are true:
• (f+ 1) − (f) ≤LMD.
• QPC≥LMC.
The thresholdsLMD,LMCandQPCrepresent respectively:
• Maximum Limit of Discontinuity: Threshold that defines the maximum discontinuity between two seed points.
• Minimum Limit Continuity: Threshold that defines the minimum amount of seed points to be considered as the same line segment.
• Number of Points Continuous: It is a counter which check the continuity of seed points, if the value is less than LMC, the sequence is ignored.
To exemplify this process, in Figure 4 is shown a set of seed points on a road with a horizontal orientation. The dashed points correspond to points not flagged by the seeding method. Consid-ering LMC equal to 4 and LMD equal to 2, only the points 6, 7, 8, 10 and 11 would keep in the set, and the points 1 and 2 would be eliminated. The pruning process is responsible both to eliminate the spurious points as to split the line segments.
Figure 4: Discontinuities of the classification of seed points.
2.5 Active Contour Model - Snakes
The basic requirement of the Snakes method is a curve near the road to be extracted. In this case, the vertices or seed points of each contour are interpolated according to the cubic spline terms, thus forming the initial road network. The concept in-troduced by Kass et al., 1987 is the minimization of a functional energy,Esnakewhich its minimum characterizes the location of
the curve on the contour of the object. The curve energy is given by the sum of three other energies:
Esnake=
Z1
0
Esnake(v(s))ds
= Z1
0
which is composed of two terms: the term first order∂v(s)/∂s, controlled byα(s); and the second order∂2v(s)/∂s2, controlled by β(s). The first order term allows the curve to behave as a membrane, representing its elasticity. The second term relates to the rigidity, acting as a thin plate [Kass et al., 1987]. The vari-ablesαandβare essential to the efficiency of the method, while small variations can significantly change the result [Bentabet et al., 2003].
The sum of the energiesEimageandEconis called external
en-ergy,Eext. The image energy,Eimage, is composed of the sum
of the product of three other energies.
Eimage=wlineEline+wedgeEedge+wtermEterm. (7)
The values ofwline,wedgeandwtermare constants that adjust
their respective energies.Elinespecifies the characteristics of the
contour as its intensity levels, i.e. depending on value ofwline
the curve will be attracted to bright or dark lines. Such energy simply refers to the intensity levels of the image.
Eline=I(x, y). (8)
The edge functional,Eedge, can also be interpreted as an operator
for identification of edges in the image, and is given by:
Eedge=−|∇I|2, (9)
where∇Iis the gradient imageI, andEtermis defined by Kass
et al., 1987 as the functional boundary that has the responsibil-ity of finding corners and ends of the line segments. Finally, the parameterEconin Equation 5, is defined as an energy restriction
might be imposed by the user. Both energy restriction as edge en-ergies, Equation 9, and termination, Equation 9, are discarded in this work. Since is not require any restriction energy or energies to acquire edges of the objects. Thus, Equation 5 is rewritten:
Esnake=
Z 1
0
[Eint(v(s)) +wlineEline(v(s))]ds , (10)
3 EXPERIMENTS
3.1 Data
The experiments were divided into two categories: synthetic and real, they were adopted two cuts for each. The synthetic images with size of 574×574 pixels were simulated in a process that involves three steps: creation, classification of regions and sta-tistical modeling [Silva et al., 2012]. The result of the two ini-tial stages results in the idealized image, called phantom image. The synthetic images, both high contrast, are differentiated only in their polarimetric properties. For the experiments with real im-ages was adopted two cuts of a SAR image covering the Paragom-inas region in Para State (Brazil), radiometric resolution of 8 bits and spatial of 2.5 meters in P-band and HH polarization. The im-age was acquired with the sensor OrbiSAR by Orbisat da Amaz-nia Ind. e Aerolevantamento S.A. company in the aerial survey period between 11 February 2007 and 13 March 2007, flying at an altitude of11,000meters.
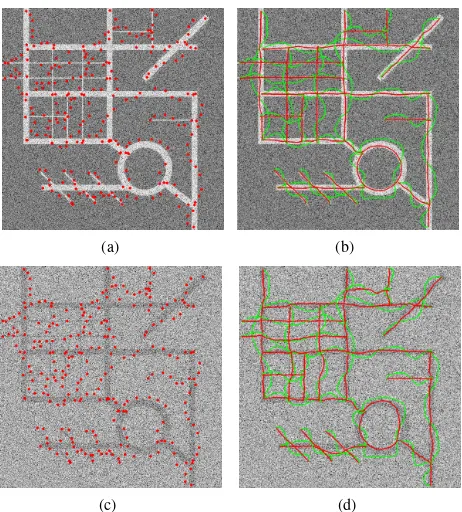
to select seed points near the roads and the method of extraction is performed on each line segment in particular. The Figure 3.2 shows the results after applying the method Snakes, red contours, and curves acquired with the initial interpolation seed points pro-vided by the user, green contours.
(a) (b)
(c) (d)
Figure 5: (a) Seed points manually selected on single look synthetic image, VV polarization. (b) Green contours represents the initial curves before the Snakes, and red, the final result for the VV polarization synthetic image. (c) Seed points man-ually selected on single look synthetic image, HH polarization. (d) Green contours represents the initial curves before the Snakes, and red, the final result for the HH polarization synthetic image.
The evolution of the curve for the central of light or dark features depends exclusively on the weighting factorwline. Negative
val-ues allows the curve to evolve roads bright and positive, dark. This configuration is performed by the user.
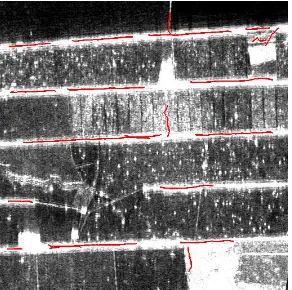
In experiments with real images, however, we applied the method of semi-automatic seeding, described in section 2.3. Thus, for the SOM network training were used a set of 30 patterns, 15 being the patterns which characterize different profiles of roads and 15 which not characterize it. The roads in Figures 6(a) and 6(b) ap-pears in approximate width between 10 and 15 pixels, bright pro-file and heterogeneous environment. The seeding was effective in identifying roads wider than 10 pixels, some roads with ap-proximate width of 3 pixels was not efficiently identified by the method. Note that the method of pruning was effective in exclud-ing spurious points, which contributes to the significant improve-ment of the result. Figure 3.2 shows the result after applying the Snakes method, which obtain the roads centre-axis on the scene.
(a)
(b)
Figure 6: Results of the seeding (Cut 1): (a) Before of pruning process. (b) After of the pruning process.
pixels and bright profiles, in some regions there is the presence of lakes, forests and buildings which makes the process even more difficult. Again, the pruning algorithm was effective in elimi-nating isolated points and discontinuities. The curves derived from the method Snakes are overlapped in some stretches. Due to the characteristic of the road to be narrow, the window scanning should perform small jumps, justifying the possibility of two seed points represent the same stretch of road, increasing the redun-dancy measure. The need for seed points located next to roads is well solved by the method of seeding presented, since the mark-ing point is not exactly carried over a region of interest, but close to them.
The measurements in Table 3.2 is based on metrics presented by Heipke et al., 1997 to evaluate the road extractor method. The Quality measurement obtained for each experiment ranged
be-Figure 7: Results of the road extraction method (Cut 1).
(a)
(b)
Figure 8: Results of the seeding (Cut 2): (a) Before of pruning process. (b) After of the pruning process.
Figure 9: Results of the road extraction method (Cut 2).
tween 0 and 1, The optimal values for measures of Redundancy, Completeness, Correctness and Quality are 0, 1, 1 and 1, respec-tively. A factor of overall performance considering the four mea-sures can be calculated by the Euclidean distance between the measures and their optimal values:
d=q(com−1)2+ (cor−1)2+ (qua−1)2+ (red−0)2, (11)
where the value ofdvaries between0and2, assuming the values close to0as the best [Scofield et al., 2007].
Table 1: Performance measures of the road extraction method.
Synt. 1 Synt. 2 Cut 1 Cut 2
Completeness 0,86 0,80 0,47 0,73 Correctness 0,82 0,76 0,68 0,76 Quality 0,84 0,78 0,59 0,74 Redundancy 0,01 0,01 0,03 0,04
narrow, and the increased noise inherent in the radar imaging, the operator becomes inefficient.
To minimize this effect was created pruning algorithm, which al-lowed the choice of the best points among those identified, elim-inating the others. Thus, many of the spurious points are elimi-nated and hence more concise hypotheses are selected from line segments. It is noted for the final results of extraction that seeding directly influences the quality of final results. Due to the char-acteristics of the image, identification of a particular pattern be-comes a difficult task and the seeding process often be-comes to err in its determinations. The experiment conducted with the syn-thetic image shows the efficiency of the Snakes method when the seeds points are marked near road, mostly, converging exactly to the central axis of the roads.
Even with the presence of roads, the seeding method sometimes fails, resulting many gaps among the contours. A solution to join these line segments is suggested by Dell’Acqua et al., 2002, Gamba et al., 2006, Mohan and Nevatia, 1992, Hu and Tao, 2007, Amini et al., 2002 technique called Perceptual Grouping and per-haps an alternative in future research. The experiment conducted with the synthetic image shows the efficiency of the Snakes method when the seed points are marked near of the road, mostly, con-verging exactly to the central axis of the roads. However, the Snakes method presents some limitations. One of the most im-portant is the lack of flexibility and inability to change their topol-ogy.
REFERENCES
Amini, J., Saradjian, M., Blais, J., Lucas, C. and Azizi, A., 2002. Automatic road-side extraction from large scale imagemaps. In-ternational Journal of Applied Earth Observation and Geoinfor-mation 4(2), pp. 95–107.
Bajcsy, R. and Tavakoli, M., 1976. Computer recognition of roads from satellite pictures. IEEE Systems, Man, and Cybernetics So-ciety pp. 623–637.
Bellman, R., 1954. The theory of dynamic programming. The RAND corporation.
Bentabet, L., Jodouin, S., Ziou, D. and Vaillancourt, J., 2003. Road vectors update using sar imagery: a snake-based method. Geoscience and Remote Sensing, IEEE Transactions on 41(8), pp. 1785–1803.
Butenuth, M., 2008. Network Snakes. PhD thesis, Deutsche Geod¨atische Kommission.
Cohen, L. D., 1991. On active contour models and balloons. CVGIP: Image Underst. 53(2), pp. 211–218.
Dell’Acqua, F., Gamba, P. and Lisini, G., 2002. Road extrac-tion aided by adaptive direcextrac-tional filtering and template matching. Proc. of IEEE Int. Geoscience and Remote Sensing Symposium. Doucette, P., Agouris, P. and Stefanidis, A., 2004. Auto-mated road extraction from high resolution multispectral im-agery. Photogrammetric Engineering and Remote Sensing 70(12), pp. 1405–1416.
Gamba, P., Dell’Acqua, F. and Lisini, G., 2006. Improving urban road extraction in high-resolution images exploiting directional filtering, perceptual grouping, and simple topological concepts. IEEE Geoscience and Remote Sensing Letters 3(3), pp. 387–391.
Gruen, A. and Li, H., 1997. Semi-automatic linear feature extrac-tion by dynamic programming and LSB-snakes. Photogrammet-ric Engineering and Remote Sensing 63(8), pp. 985–995.
Haykin, S., 1994. Neural Network: A Comprehensive Founda-tion. Macmillan College Publishing Company.
Heipke, C., Mayer, H., Wiedemann, C. and Jamet, O., 1997. Evaluation of automatic road extraction. In: In: International Archives of Photogrammetry and Remote Sensing, pp. 47–56.
Hu, X. and Tao, V., 2007. Automatic extraction of main road centerlines from high resolution satellite imagery using hierarchi-cal grouping. Photogrammetric Engineering & Remote Sensing 73(9), pp. 1049–1056.
Kass, M., Witkin, A. and Terzopoulos, D., 1987. Snakes: Active contour models. International Journal of Computer Vision 1(4), pp. 321–331.
Kohonen, T., 1982. Self-organized formation of topologically correct feature maps. Biological Cybernetics 43, pp. 59–69.
Laptev, I., 1997. Road extraction based on snakes and sophis-cated line extraction. Master’s thesis, Royal Institute of Technol-ogy (KTH), Stockholm, Sweden.
Mayer, H., Laptev, I., Baumgartner, A. and Steger, C., 1997. Au-tomatic road extraction based on multi-scale modeling, context, and snakes. International Archives of Photogrammetry and Re-mote Sensing 32, pp. 106–113.
Mohan, R. and Nevatia, R., 1992. Perceptual organization for scene segmentation and description. IEEE Trans. Pattern Anal. and Machine Intel. 14(6), pp. 616–635.
Osher, S. and Sethian, J. A., 1988. Fronts propagation with curva-ture dependent speed: algorithms based on hamilton-jacobi for-mulations. Journal of Computational Physics 79, pp. 12–49.
Poz, A. P. D. and Agouris, P., 2001. Um algoritmo de otimizac¸˜ao global para a extrac¸˜ao de rodovias em imagens digitais. Revista Brasileira de Cartografia (53), pp. 65–72.
Quam, L., 1978. Road tracking and anomaly detection in aerial imagery. Image Understanding Workshop, pp. 51–55.
Scofield, G. B., Sant’Anna, S. J. S., Freitas, C. C. and Dutra, L. V., 2007. Avaliac¸˜ao quantitativa do SegSAR atrav´es de medi-das de borda e regi˜oes em imagens ´opticas sint´eticas. In: Anais XIII Simp´osio Brasileiro de Sensoriamento Remoto, pp. 6167– 6174.
Silva, W. B., Freitas, C. C., Sant’Anna, S. J. S. and Frery, A. C., 2012. PolSAR region classification by stochastic distance mini-mization between wishart distributions. IEEE Journal of Selected Topics in Applied Earth Observations and Remote Sensing.