Georeferencing on Synthetic Aperture RADAR imagery
KEY WORDS: Geometric calibration, Georeferencing, Foreshortening, Layover, Range-Doppler, Digital Elevation Model
ABSTRACT:
Due to the SAR1 geometry imaging, SAR images include geometric distortions that would be erroneous image information and the images should be geometrically calibrated. As the radar systems are side looking, geometric distortion such as shadow, foreshortening and layover are occurred. To compensate these geometric distortions, information about sensor position, imaging geometry and target altitude from ellipsoid should be available. In this paper, a method for geometric calibration of SAR images is proposed. The method uses Range-Doppler equations. In this method, for the image georeferencing, the DEM2 of SRTM with 30m pixel size is used and also exact ephemeris data of the sensor is required. In the algorithm proposed in this paper, first digital elevation model transmit to range and azimuth direction. By applying this process, errors caused by topography such as foreshortening and layover are removed in the transferred DEM. Then, the position of the corners on original image is found base on the transferred DEM. Next, original image registered to transfer DEM by 8 parameters projective transformation. The output is the georeferenced image that its geometric distortions are removed. The advantage of the method described in this article is that it does not require any control point as well as the need to attitude and rotational parameters of the sensor. Since the ground range resolution of used images are about 30m, the geocoded images using the method described in this paper have an accuracy about 20m (subpixel) in planimetry and about 30m in altimetry.
1. Introduction
Natural disasters such as floods, earthquakes, landslides and so on are the greatest threats to the life of human society. Detection and changes management caused by the destructive phenomena due to weather conditions is difficult. Microwave active sensors, due to independence on atmospheric condition and climate changes, are useful tools to overcome this problem but needs to obtain accurate results and correct data (Curlander and McDonough, 1992). In synthetic aperture RADAR imagery, by using qualitative analysis on the SAR images, specific information extracted that is used for a variety of applications. In fact, in high altitude areas and rough surfaces, the incidence angle deflects from geoid and the accuracy of image geometry as a function of the height that is dependant to geoid model decreases. So obtaining the correct information from image geometry or on the other hand geometric calibration is important (Choo et. All, 2012)
Rational function models is used widely in the geometric calibration of optical images but were not used in SAR sensors until RFM3 is used for geometric calibration of SAR data. The advantage of RFM model versus RD4 model is that RFM model is speedy in conversion of 2D image space into 3D object space without reducing the accuracy of the calculations significantly. RFM uses simple calculations but needs to know the detailed information such as sensors
Wave propagation delay and error in time measurement are two major sources of errors in SAR geometric accuracy. Another introduced method was based on SAR image simulation using DEM and registering original image to simulated image for compensating these errors. Then, RPC model is used but still aware of sensor attitude and GCPs were problematic (Zhang et. all, 2012)
The Range-Doppler model is used to develop a mathematical model to locate the SAR image pixels but due to the lack of another information source, this method was unable to eliminate foreshortening and layovers (Xiao et. all, 2012). In addition, it can be said that the reviewed methods for SAR georeferencing, need sensor attitude parameters and GCPs and they are unable to remove topography errors while proposed method in this article do not use any GCP and uses DEM for SAR georeferencing and it is able to eliminate errors caused by topography.
2. Topography errors
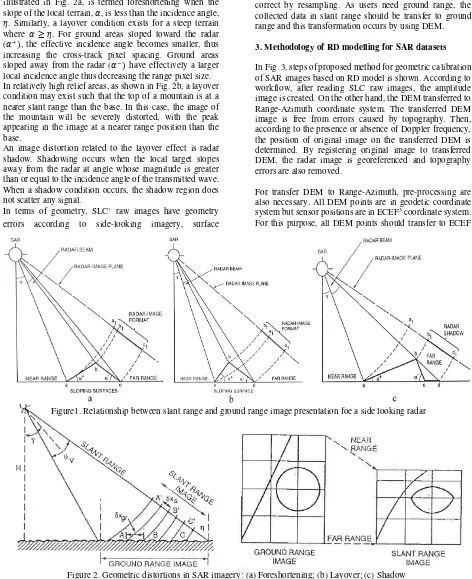
For a smooth surface, there is an inherently nonlinear relationship ( / � �)between the sensor to target range and the cross-track target position in the image. Since for a side-looking radar the angle of incidence � varies across the swath, the ground distance represented by each sample is not uniform. The effect is that features in the near range appear compressed with respect to the far range (Fig 1). Only for smooth surfaces can the slant range spacing and the ground range spacing be related by � � (Oliver and Quegan, 2004).
4 Range-Doppler 5 Ground Control Point
As the local terrain deviates from a smooth surface, additional geometric distortion occurs in the SAR image relative to the actual ground dimension. This effect, illustrated in Fig. 2a, is termed foreshortening when the slope of the local terrain, �, is less than the incidence angle, �. Similarly, a layover condition exists for a steep terrain where � ≥ �. For ground areas sloped toward the radar (�+ , the effective incidence angle becomes smaller, thus increasing the cross-track pixel spacing. Ground areas sloped away from the radar (�− have effectively a larger local incidence angle thus decreasing the range pixel size. In relatively high relief areas, as shown in Fig. 2b, a layover condition may exist such that the top of a mountain is at a nearer slant range than the base. In this case, the image of the mountain will be severely distorted, with the peak appearing in the image at a nearer range position than the base.
An image distortion related to the layover effect is radar shadow. Shadowing occurs when the local target slopes away from the radar at angle whose magnitude is greater than or equal to the incidence angle of the transmitted wave. When a shadow condition occurs, the shadow region does not scatter any signal.
In terms of geometry, SLC1 raw images have geometry errors according to side-looking imagery, surface
1 Single Look Complex
2 Universal Transverse Mercator
topography, sampling errors and platform instabilities. Assuming that each pixel location can be determined to a fixed network such as UTM2, geometric distortion can be correct by resampling. As users need ground range, the collected data in slant range should be transfer to ground range and this transformation occurs by using DEM.
3. Methodology of RD modelling for SAR datasets
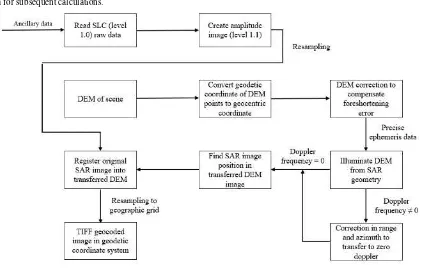
In Fig. 3, steps of proposed method for geometric calibration of SAR images based on RD model is shown. According to workflow, after reading SLC raw images, the amplitude image is created. On the other hand, the DEM transferred to Range-Azimuth coordinate system. The transferred DEM image is free from errors caused by topography. Then, according to the presence or absence of Doppler frequency, the position of original image on the transferred DEM is determined. By registering original image to transferred DEM, the radar image is georeferenced and topography errors are also removed.
For transfer DEM to Range-Azimuth, pre-processing are also necessary. All DEM points are in geodetic coordinate system but sensor positions are in ECEF3 coordinate system. For this purpose, all DEM points should transfer to ECEF
3 Earth Centered – Earth Fixed
Figure1. Relationship between slant range and ground range image presentation foe a side looking radar
coordinate system to both type of data have same coordinate system for subsequent calculations.
To convert coordinate from geodetic to ECEF coordinate system, the following equations is used:
= √ − ⁄ (1)
= ⁄√ − � � (2)
= + ℎ � � (3)
= + ℎ � � � (4)
= [ − + ℎ] � � (5)
Where is first eccentricity and , are semi-major and semi-minor axes. After coordinate conversion, main point is transferring DEM to Range-Azimuth coordinate system. For this process, the Range-Doppler equation is used. The (6) is Range equation and (7) is Doppler equation. = | − | (6)
=� � − � . − (7)
Where is slant range between sensor to target, is target position vector, is sensor position vector, is Doppler centroid frequency, � is wavelength and � , � are sensor and target speed vectors (Fig. 4).
To be able to transfer DEM in Range-Azimuth, a distance to find Range position and a time to find Azimuth position are needed. At first, the distance for each pixels in DEM to all points on satellite orbit are calculated by (8).
=
√ �− + �− + �− (8)
The minimum distance between DEM and satellite orbit is
desired range and the time orbit that tha satellite has a minimum distance is desired time . This process is done for all DEM points do that each pixel has a distance and a time. After that, if the Doppler frequency is zero, coordinates in Range-Azimuth system is calculated by (10) and (11).
Figure 3. Workflow of proposed method for SAR georeferencing
= ⁄ (9)
= − � ⁄ (10)
� ℎ = ∗ − (11)
Where � is minimum range, is beginning time of imagery, is pulse repetition frequency, is range sampling rate and is light speed.
If the Doppler frequency is not zero, corrections should be applied in range and azimuth direction. Corrected range and azimuth expressed by (12) and (13). is satellite Doppler frequency.
=
+
�2 �2 ��4 �2 (12)
� ℎ = � ℎ + � � ��
�2 (13)
The above equations transferred DEM to Range-Azimuth coordinate system. In fact, this image is DEM that has coordinate in range and azimuth in addition to longitude, latitude and height from ellipsoid which the errors caused by earth surface such as foreshortening and layover are removed.
Thus, for each point in DEM, the geodetic coordinates converted to ECEF coordinates and then a distance and a time belongs to specific point in DEM calculated. At the end, the position of each DEM point determined in Range-Azimuth coordinate system. The procedure of geolocation can be sketched as the following transformation chain:
φ, �, ℎ → , , → , → � ℎ,
Finally by registering original image that has geometric
errors into transferred DEM, the output image is georeferenced image which all errors are eliminated.
4. Experiment and result analyses
ALOS satellite images of the PALSAR sensors are used. The images are in level 1.0 at SLC format. PALSAR sensor images are usually at processing level 1.0, 1.1 and 1.5. Level 1.0 images are the result of processing of raw data in level 0 which each pixel is expressed as a complex number I+jQ. I and Q are real and imaginary parts of SLC images in level 1.1. Level 1.1 images are amplitude images which are not georeferenced. Magnitude of each pixel is obtained by (14).
� � = √ + (14)
Level 1.5 images are amplitude images which are georeferenced. The aim of this article is to apply the processes to convert images from level 1.0 to level 1.5. With ALOS images in level 1.0, there are two files with the .PRM and .0__A extensions. PRM file contains information about sensor parameters such as earth radius, earth equatorial and polar radius, Doppler frequency, pulse duration, wavelength, range sampling rate and image dimensions. 0__A file that is called leader file, contains the time of imaging with an accuracy of millisecond as well as precise ephemeris data such as position and velocity state vectors of the satellite. Although both files are required for SAR georeferencing.
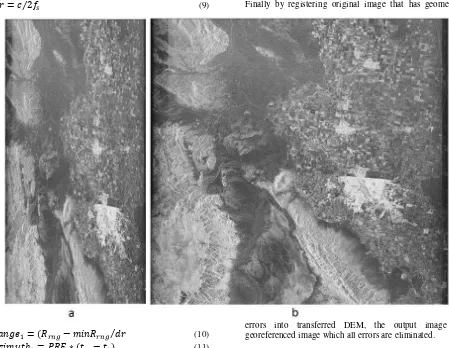
Consequently, the results of implementation of the proposed method on the image of the region in Mexico that were taken on September 11, 2009 is provided. Using (14), the single-look amplitude image is shown at Fig. 5a. To reduce the speckle noise, multi-look image is shown at Fig. 5b. The
spatial resolution of the image in range and azimuth direction are approximately equal. The obtained multi-look image has 30 meters spatial resolution.
SRTM DEM is used with 1 are-second (30m) spatial resolution. The DEM covered latitude from 32.1N to 33.2N and longitude from 115.1W to 116.2W.
Now, the original image should register to transferred DEM. For registering, 2D projective transformation which has 8 parameter is used. The transformation expressed in (15) and (16).
=
+ ++ℎ + (15)=
+ ++ℎ + (16)Where , are coordinates in transferred DEM and , are coordinates in original SAR image. To determine the { , , , , , , , ℎ} coefficients, need to be at least 4 known points in both images. 4 corners of both images can be used as known points.
1 Root Mean Square Error
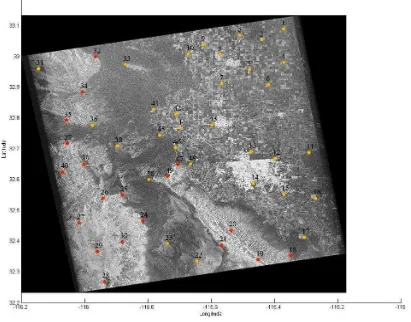
Fig. 6. Shows georeferenced SAR image which the geometric errors are removed.
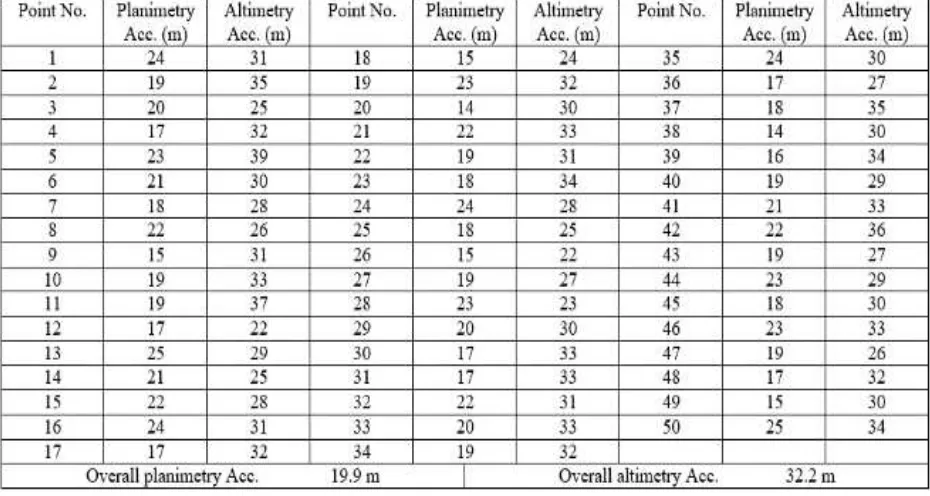
For accuracy evolution, 50 points (seen in Fig. 6) chose to determine planimetry and altimetry accuracy. Each points has two sets of coordinates. Coordinates obtained by using
the method presented in this study and points coordinate from Google Earth which is considered as a reference. For accuracy determination, the planimetry and altimetry RMSE1 of each point is calculated by (17) and (18).
� √ [∑�= �− � + ∑�= �− � ]
(17)
� = √ ∑�= �− ℎ� (18)
Where , , are longitude, latitude and height of georeferenced image and , , ℎ are same items from Google Earth. The planimetry and altimetry accuracy of 50 points expressed in Table 1. All of RMSE values in table are expressed in meters. As the table shows, georeferencing image has planimetry accuracy of about 20 meters.
5. Conclusion
Geometric calibration and georeferencing are the most important processes of SAR raw images. Geometric distortions are caused by platform instabilities, error in determining the relative height and displacements origin from topography. The prominent errors that due to the SAR imaging geometry and target height changes are known as foreshortening and layover. For correct these errors, an independent source of information is required such as imaging from another angle, topographic map or DEM.
In this paper, for SAR image georeferencing and removing topography errors, the DEM is as independent source of information. In this procedure, by using DEM and precise ephemeris data of the sensor that determines the exact position of the satellite, the DEM transferred to range and azimuth direction. The transferred DEM is free of errors. Then, the original SAR image that contains errors registered to transferred DEM. The main advantage of proposed method is that do not require any GCPs.
To assess the accuracy of the georeferenced images, 50 points in different parts of the image is selected. By comparing the obtained coordinates in georeferenced image and reference points in Google Earth, the RMSE is calculated for these points. Planimetry accuracy is about 20 meters and altimetry accuracy is about 30 meters. Since the ground resolution of multi-look image is 30 meters, thus planimetry accuracy achieved in this research will be acceptable.
References
Choo, L., Y. K. Chan, and V. C. Koo., 2012. "Geometric Correction on SAR Imagery. “Progress in Electromagnetics Research Symposium Proceedings, KL, MALAYSIA.
Curlander John C. and Robert N. McDonough., 1992.
“Synthetic Aperture Radar: Systems and Signal Processing”,
Wiley-Interscience.
Lu Zhang, Timo Balz and Mingsheng Liao., 2012. “Satellite SAR geocoding with refined RPC model”.ISPRS Journal of Photogrammetry and Remote Sensing, Vol 69, April 2012, pp. 37–49.
Lu Zhang, Xueyan He, Timo Balz, Xiaohong Wei and
Mingsheng Liao., 2011. “Rational function modelling for
spaceborne SAR datasets”. ISPRS Journal of Photogrammetry and Remote Sensing, Vol 66, pp. 133–145.
OLIVER C., and Quegan S., 2004. “Understanding synthetic aperture radar images”, SciTech Pub.
Xiao Zhou, Qiming Zeng, Jian Jiao, Qing Wang and Sheng
GAO., 2012. “Geometric calibration and geolocation of
airborne SAR images”. Geoscience and Remote Sensing Symposium (IGARSS), IEEE International. 22-27 July 2012, Munich, pp. 4513-4516.
