Full Terms & Conditions of access and use can be found at
http://www.tandfonline.com/action/journalInformation?journalCode=vjeb20
Download by: [Universitas Maritim Raja Ali Haji] Date: 11 January 2016, At: 20:42
Journal of Education for Business
ISSN: 0883-2323 (Print) 1940-3356 (Online) Journal homepage: http://www.tandfonline.com/loi/vjeb20
Do Differences in GPA Impact Attitudes About
Group Work? A Comparison of Business and
Non-Business Majors
Volker Grzimek, Melanie Beth Marks & Eric Kinnamon
To cite this article: Volker Grzimek, Melanie Beth Marks & Eric Kinnamon (2014) Do Differences in GPA Impact Attitudes About Group Work? A Comparison of Business and Non-Business Majors, Journal of Education for Business, 89:5, 263-273, DOI: 10.1080/08832323.2013.872591 To link to this article: http://dx.doi.org/10.1080/08832323.2013.872591
Published online: 03 Jul 2014.
Submit your article to this journal
Article views: 107
View related articles
Do Differences in GPA Impact Attitudes About
Group Work? A Comparison of Business
and Non-Business Majors
Volker Grzimek
Berea College, Berea, Kentucky, USA
Melanie Beth Marks
Longwood University, Farmville, Virginia, USA
Eric Kinnamon
Berea College, Berea, Kentucky, USA
Using survey data the authors investigate the impact of grade point average (GPA) on students’ preferences for classroom group work and its structure. Topics range from general attitudes and beliefs (benefits to grades, impact on mastery of material, professors’ motives) to administration (group composition, grading, peer reviews, group leadership). It was hypothesized that students act as GPA maximizers (prefer higher grades if holding all else equal) and therefore high achievers would answer many of the questions differently than low achievers. Regression results suggest that, generally, GPA better explains survey results for non-business majors than for business majors.
Keywords: attitudes, cooperative learning, GPA, group work, learning teams
Classroom group work can help students improve commu-nication skills, learn to work with individuals who are dif-ferent from themselves, and prepare for employment in firms with a team-based organizational structure. Teams bring together individuals with different strengths that can result in outcomes not possible without everyone involved (Katzenbach & Smith, 2005). But working in teams can be frustrating. Members may shirk their responsibilities and high-achieving students may find themselves on teams with individuals of lesser ability.
In this study we investigated the impact of students’ grade point average (GPAs) on preferences and attitudes about classroom group work. We speculate that high- and low-achieving students have different attitudes. For exam-ple, high-achieving students, unlike low-achieving students, should prefer group compositions based on homogeneity
and having the right to expel shirkers. Hypotheses were developed under the assumption that students are GPA maximizers, assuming all other variables held constant (they want to maximize grades when there is no tradeoff). Furthermore, we investigate whether the impact of GPA on attitudes about group work differs for business and non-business majors.
LITERATURE REVIEW
Studies investigate how students feel about working in groups, but results are mixed. Shaw, Duffy, and Stark (2000) found that students’ preferences for group work pre-dicted the level of satisfaction later reported for a coopera-tive learning experience. Phipps, Phipps, Kask, and Higgins (2001) concluded that students had favorable impressions about some cooperative learning techniques but did not feel they led to increased study time or learning. Machemer and Crawford (2007) determined that students value any activ-ity that they think will improve their exam grades.
Correspondence should be addressed to Melanie Beth Marks, Long-wood University, College of Business and Economics, 201 High Street, Farmville, VA 23909, USA. E-mail: marksmb@longwood.edu
Color versions of one or more of the figures in the article can be found online at www.tandfonline.com/vjeb.
JOURNAL OF EDUCATION FOR BUSINESS, 89: 263–273, 2014 CopyrightÓTaylor & Francis Group, LLC
ISSN: 0883-2323 print / 1940-3356 online DOI: 10.1080/08832323.2013.872591
However, when exploring different teaching strategies, the group learning approach ranked the lowest. Hillyard, Gillespie, and Littig (2010) had 33% of survey respondents report group work experiences that were mostly negative or mixed. Students’ responses were more positive when they were exposed to more collaborative learning opportunities, but bad group experiences resulted in long-lasting, negative attitudes.
Schultz, Wilson, and Hess (2010) asked open-ended questions and found that 41% of students preferred to work in a group while 33% preferred to work alone. Students complained about giving up full control over grades, diffi-culties in getting group members together, and free-riding. In Bacon (2005), students working in pairs were contrasted with students working independently. Of students working alone, 44% believed that working in a group would have resulted in less learning; only 4% felt they would have learned more. Two thirds of the students responded that they preferred to work alone and 78% felt that coordinating with a group would have resulted in more work. Rassuli and Manzer (2005) surveyed students after com-pleting a cooperative learning activity. Students who felt that group work increased their learning had more favorable attitudes about group work. Students who felt that learning decreased indicated a preference for less group work and more lecture.
Some studies have suggested that students’ attitudes about group work are related to their level of academic achievement. Shaw et al. (2000) found a negative relation-ship between GPA and preference for group work. Chap-man and Van Auken (2001) surveyed classes at 32 institutions and found a weak (but significant) negative cor-relation between students’ GPAs and attitudes about group work. Su (2007) looked at students’ preferences for group work as a function of team composition. Low individual ability students had much stronger preferences for group work when matched with students having higher abilities. When students with medium or high abilities were matched with similar individuals, their preferences for group work did not change.
Attitudes about group work can be influenced by project design and the instructor. Chapman and Van Auken (2001) determined that students’ attitudes were more positive when instructors had active roles (helping them understand group dynamics, using group management techniques) and evaluated groups’ success (observing groups, peer evalua-tions, meeting reports). Pfaff and Huddleston (2003) found five significant predictors of favorable group experience ratings: no free-riding, good grades, perception of reason-able workload, use of peer review, and class time to work together. Hijzen, Boekaerts, and Vedder (2007) worked with Dutch secondary schools and found that teams highly unsatisfied with cooperative learning expressed concerns about the instructor (e.g., unclear instructions, lack of guidance, lack of assistance). Anderson (2005) studied
small groups that collaborated on a four-week simulation. Groups that were more cohesive (worked together easily) and more interdependent (members work better with others than alone) had increased affect for the cooperative learning activity. Degree of heterogeneity did not impact students’ levels of affect. Winter, Waner, and Neal-Mansfield (2008) studied teams of business majors with different concentrations and found that homogeneity/het-erogeneity (in discipline) did not impact students’ percep-tions about the experience.
There is little research that evaluates business majors or compares them to non-business majors. Rassuli and Manzer (2005) employed economics students and Chapman and Van Auken (2001) surveyed marketing majors (both dis-cussed previously). Yazici (2004) surveyed students in operations management after five group activities (presen-tation, computer exercise, exam, project, and case study). Mean responses suggest students generally agreed that collaborative learning benefited their learning. Gottschall and Garcıa-Bayonas (2008) studied differences in atti-tudes toward group work among light users (mathemat-ics majors), medium users (business majors), and heavy users (education majors). The groups had similar primary likes and dislikes but business majors identified more neg-ative aspects to group work. Marks and O’Connor (2013) compared survey results from business and non-business majors. Students were similar in their overall assessment of group work but showed some key differences. For example, business majors were more willing to be held responsible for errors of others and showed more support for terminating shirkers. The analysis reported in this study expands on this analysis.
SURVEY DESIGN
The idea for this research stemmed from an honor board case at one of our universities involving plagiarism on a team project. Only some were responsible for the plagiarism, yet the entire group was charged. This generated campus-wide discourse with no consensus. Hence, this survey was designed to measure students’ attitudes on topics including:
preferences for organization of group work,
impressions about the value of group work,
perceptions about professors’ motivation for using group work, and
overall impressions of group work.
In this analysis, 29 questions related to preferences and atti-tudes are explored. Questions related to past experiences are asked as well but are analyzed in another paper. A 5-point Likert-type scale ranging from 1 (strongly agree) to 5 (strongly disagree) was used. Prior to finalizing the survey, face validity was established through cognitive interviews
264 M. B. MARKS ET AL.
conducted with a sample of students. Minor changes were made and the instrument was deemed acceptable.
Sampling
We surveyed eight upper level business courses (average enrollment of 22.4 students and 19 sections of an upper level English class required for all students (average enroll-ment of 19.1 students). The response rate was 85% in busi-ness and 71% in English. Students appearing in both classes were asked to complete the survey once (explaining the higher response rate in business classes which were sur-veyed first). Culling incomplete surveys and those indicat-ing no major or a double major (business and non-business) yielded a final sample of 351 students.
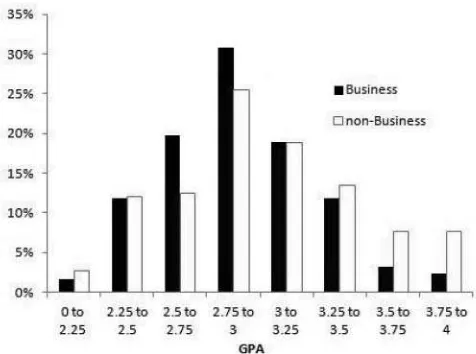
In the sample, 127 (36.18%) of students were business and 224 (63.82%) are non-business majors (combining arts and sciences and education & human services). Less than half were men (41.31%) and just over half were seniors (54.72%) with the balance being juniors. The mean GPA for business (2.92,SDD0.35) was slightly lower than for non-business majors (3.04,SDD0.45); the mean GPA for the overall sample was 3.00 (SD D 0.42). The standard deviation for GPA was higher for non-business (0.45) than for business majors (0.36). Figure 1 shows the distribution of GPA.
The distribution of responses for the 29 questions (and exact wording) is provided subsequently. Original question numbers are retained to reveal the order in which questions were asked. The survey is available upon request.
EXPECTED RESULTS
We start with the assumption that, holding all else constant, higher grades are preferred by students, and we hypothe-sized that higher and lower GPA students would differ in their beliefs about group work in the following ways:
Hypothesis 1 (H1): Students with higher GPAs would pre-fer that students be grouped by ability (ensures them higher performing group members). Students with lower GPAs would prefer a more heterogeneous mix (ensures higher performing group members).
H2: Students with higher GPAs would prefer smaller groups (maximizes the weight of their own presumably well done work). Students with lower GPAs would pre-fer larger groups (dilutes the impact of their presum-ably less well done work).
H3: Students with higher GPAs would prefer to expel shirkers (assuming it will never be them). Lower GPA students would not support this (are more likely to shirk).
H4: Students with higher GPAs would prefer differentiated grades within groups (graded only on their contribu-tion) and to not be held accountable for mistakes of others. Lower performing students would oppose grade differentiation.
H5: Students with higher GPAs would prefer peer reviews that impact individual grades (will likely benefit them). Lower performing students would oppose this (more likely reduces their grade).
H6: Students with higher GPAs would dislike group work as they see fewer benefits in it (it potentially threatens their GPAs, need to put in more than their share of the work to receive the grade they would have earned working independently). Lower GPA students would have a more positive attitude toward group work (they are more likely to benefit from it).
In all, we expected GPA to impact the responses for 14 of the 29 questions covered in the survey.
RESEARCH METHODOLOGY
We used a linear regression approach that allows us to con-trol for GPA, major, and interactions. The data are ordinal and an approach such as ordered logit would be seen as sta-tistically more accurate. However, Norman (2010) sug-gested that parametric estimation methods deliver robust results and we find that the two approaches do not differ in signs and significance. Because outcomes of the linear regression approach are easier to interpret, we present those results.
The model is:
RijDb0jCb1jGPAiCb2jSchooliCb3jGPAi £SchooliCeij
FIGURE 1 GPA distribution by school.
GROUP WORK ATTITUDES, MAJOR, AND GPA 265
where Rijis the response of student i to question j,GPAiis studenti’s GPA, andSchooliis a dummy variable showing studenti’s school (1Dbusiness).
Estimation Results
We report the estimated marginal effects and standard errors of the GPA for non-business majors (b1), business majors (b1Cb3), and the difference (b3). The differences in mean answers (business vs. non-business) are reported, giving us an idea about general differences in attitudes. Questions and results are divided into four themes.
Psychometrics Properties of the Measures
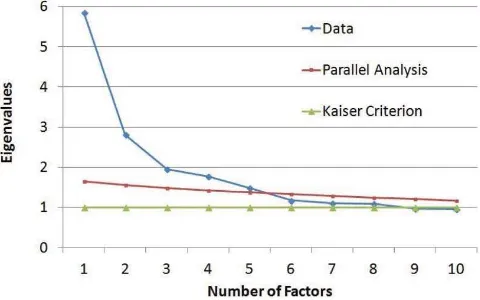
The questions were grouped and categorized a priori and principle component factor analysis (O’Connor, 2000) and reliability coefficients statistics (Cronbach’s alpha) were conducted on the grouping and measures post hoc to assess construct validity and reliability. For the factor analysis, three common methods for identify factors were used: Kai-ser criterion (K1), scree plot (SP), and parallel analysis (PA). The use of these three methods in conjunction with theoretical construction of the measures has robust empiri-cal support (Hayton, Allen, & Scarpello, 2004).
As seen in Figure 2, K1 suggest eight factors (eigenval-ues > 1 are considered factors). However, it is generally accepted that this method indicates too many factors. SP interpretation suggests five factors (indicated where the data line levels out minus one) and so does PA. A Monte-Carlo–based simulation method compared the observed eigenvalues with those obtained from uncorrelated normal variables. A factor is retained if the eigenvalue is greater than the 95th percentile of the distribution of eigenvalues derived from the data (indicated by the intersection of the PA line and data line). When evaluated in regards to the theoretical development of the categorizations, this sug-gests that several of the scales are multidimensional. As such, a high alpha value would not be expected, although three of four are in acceptable to excellent ranges.
Given the convergence of the factor interpretation meth-ods and the Cronbach’s alpha of the factors reported in Table 1, we feel our categorization has acceptable validity and reliability.
General attitude toward group work. Six questions measure students’ general assessment of group work (see Table 2). On average, students had a relatively neutral gen-eral opinion about group work (MD3.02 for Q25-B) and its impact on mastery of the subject (M D2.98 for Q27). However, business students liked group work significantly more than non-business majors (–0.307 difference for Q25-B). Students, on average, mildly agreed that group work benefits their course grade (MD2.69 for Q28), is enjoyable (MD2.57 for Q29), should be used more often (MD2.78 for Q30), and is socially rewarding (MD2.43 for Q31).
For five of six questions in this section, we hypothesized that GPA would have a specific impact on students’ responses. Note that expected signs (Cor -) are offered in the first column. Question marks (?) are used to indicate when we had no expectation. As expected, higher GPA stu-dents believe more strongly that group work is harmful for grades (Q28). Higher GPA students prefer individual work more (Q25-B), like group work less (Q29), and believe that it should be used less often (Q30). There were no significant differences in mean responses for business and non-busi-ness students.
Business and non-business majors with higher GPAs felt less strongly that group work results in better mastery of subject matter (Q27). However, this effect was not signifi-cant for business students. GPA did not signifisignifi-cantly influ-ence the response about social rewards from group work (Q31) for both either major.
Group composition. Nine survey questions address topics related to group composition (see Table 3). On aver-age, students preferred to select group members (MD1.95 for Q9) and somewhat disagreed with grouping by ability (M D 3.69 for Q10). They disliked grouping foreign stu-dents together (M D 3.82 for Q16) but business students were significantly less strongly opposed (difference of 0.73). Students were relatively indifferent to reassigning students when there are multiple group activities (MD3.15 for Q11). Non-business majors supported reassignment sig-nificantly more strongly (difference of 0.59 for Q11). FIGURE 2 Factor analysis: K1, SP, and PA.
TABLE 1 Cronbach’s Alpha Results
Category Cronbach’sa
General attitude toward group work .913 Peer review and grading .616 Group composition .545
Other topics .711
266 M. B. MARKS ET AL.
TABLE 2
General Attitude Toward Group Work
When working in a group
or team. . . SAD1 AD2 ND3 DD4 SDD5 M SD
Mean difference, business to non-business
majors
GPA non-business
(b1)
GPA business (b1Cb3)
Difference (b3)
R2 F
Mdiff SE Mdiff SE Mdiff SE Mdiff SE
Q25-B (C) I prefer to work in a group or team on class projects, as opposed to working independently.
13.1% 26.8% 21.9% 20.8% 17.4% 3.02 1.30 ¡0.307** 0.143 0.741*** 0.190 0.726** 0.315 0.0155 0.367 .068 8.474***
Q27 (C) Working in a group results in better mastery of course material.
8.6% 23.7% 37.9% 21.1% 8.8% 2.98 1.07 0.035 0.118 0.549*** 0.158 0.429 0.262 0.120 0.306 .041 4.945***
Q28 (C) Group work benefits my course grade.
11.4% 34.8% 33.6% 14.0% 6.3% 2.69 1.05 ¡0.080 0.116 0.672*** 0.153 0.684*** 0.253 0.0118 0.296 .073 9.076***
Q29 (C) I enjoy working in groups in my classes.
19.4% 33.3% 25.6% 13.1% 8.6% 2.57 1.19 ¡0.058 0.131 0.488*** 0.176 0.514* 0.291 ¡0.0260 0.340 .031 3.686***
Q30 (C) Group work should be used more often in classes.
13.7% 26.8% 35.9% 14.5% 9.1% 2.78 1.13 ¡0.112 0.125 0.578*** 0.166 0.531* 0.276 0.0467 0.322 .046 5.544***
Q31 (?) I find classroom group work socially rewarding.
18.0% 39.9% 26.5% 11.4% 4.3% 2.43 1.05 0.000 0.115 0.142 0.156 0.0536 0.259 0.0886 0.303 .002 0.290
Note: F(2, 348);*p.01.**p.05.***p.01.
267
TABLE 3 Group Composition
When working in a group
or team. . . SAD1 AD2 ND3 DD4 SDD5 M SD
Mean difference, business to non-business
majors
GPA non-business
(b1)
GPA business (b1Cb3)
Difference (b3)
R2 F Mdiff SE Mdiff SE Mdiff SE Mdiff SE
Q09 (?) I prefer to select my own group members (as opposed to the professor assigning them).
45.9% 26.2% 18.2% 6.0% 3.7% 1.95 1.10 0.120 0.122 0.216 0.166 ¡0.0743 0.275 0.290 0.321 .008 0.913
Q10 (¡) I believe that students should be grouped by abilities (strong students together, weaker students together.)
3.4% 12.8% 22.2% 34.2% 27.4% 3.69 1.11 0.000 0.123 ¡0.0687 0.167 ¡0.226 0.277 0.157 0.323 .002 0.278
Q11 (?) If there is going to be more than one group project, teams should be reassigned each time.
10.5% 18.0% 31.9% 24.8% 14.8% 3.15 1.19 0.590*** 0.129 ¡0.0728 0.175 0.242 0.291 ¡0.315 0.340 .059 7.210***
Q13 (?) Professors should assign a group leader.
4.6% 11.7% 32.5% 28.2% 23.1% 3.54 1.10 ¡0.107 0.123 ¡0.0578 0.167 ¡0.258 0.277 0.200 0.323 .005 0.584
Q14 (?) Professors should require the group to select a group leader.
14.5% 30.2% 29.6% 16.2% 9.4% 2.76 1.17 ¡0.406*** 0.128
¡0.00097 0.175 ¡0.0355 0.290 0.0345 0.339 .028 3.306***
Q15 (?) Professors should let groups decide whether or not they need a group leader.
20.2% 35.3% 30.5% 9.4% 4.6% 2.42 1.06 0.128 0.117 ¡0.258 0.159 0.0608 0.264 ¡0.319 0.308 .011 1.300
Q16 (?) Foreign students with weaker language skills should be grouped together in their own group.
8.0% 6.8% 17.7% 31.6% 35.9% 3.82 1.22 ¡0.553*** 0.131 0.160 0.179 ¡0.120 0.297 0.280 0.346 .051 6.176***
Q17 (¡) Smaller groups (2–3 people) are preferable to larger groups (4–6 people).
31.3% 34.5% 23.4% 8.8% 2.0% 2.16 1.03 0.346*** 0.112 ¡0.570*** 0.150 ¡0.0216 0.249 ¡0.550* 0.291 .065 8.078***
Q24 (¡) Groups should have the right to terminate members who do not do their share.
32.2% 39.0% 13.7% 12.0% 3.1% 2.16 1.10 ¡0.591*** 0.118 ¡0.204 0.160 0.120 0.265 ¡0.323 0.310 .072 8.963***
Note: F(2, 348);*p.01.**p.05.***p.01.
268
Students were somewhat supportive of smaller groups (MD2.16 for Q17), but business students are significantly less so (difference of 0.35). On average, students leaned toward agreeing with termination of shirkers (MD2.16 for Q24), with business students agreeing significantly more (difference of –0.59). Students, on average, opposed profes-sors assigning a leader (MD3.54 for Q13) and weakly pre-ferred to decide themselves whether to have a leader (MD
2.42 for Q15). There was even weaker support for having professors require selection of a leader (MD2.76 for Q14). On average, business majors showed more agreement with having professors require the selection of a leader (differ-enceD–0.41).
For three of nine questions (Q10, Q17, and Q24) we hypothesized negative correlations with GPA. We hypoth-esized that students with higher GPAs would prefer group-ing by ability (Q10) and students with lower GPAs would not. Regression results show the expected negative sign but no statistical significance. We also hypothesized that higher GPA students would prefer smaller groups compared to lower GPA peers (Q17). Surprisingly, a statistically significant result is only found for non-busi-ness students, although both results have the expected neg-ative sign. To explore this further, we ran an additional regression controlling for past group size experience but found results to be virtually unchanged. Finally, we hypothesized that higher GPA students would agree more with termination of shirkers (Q24). We found the expected negative sign when looking at non-business students but not for business students. Neither result was significant, however.
Not surprisingly, GPA had no significant impact on students’ desire to select their own group members (Q9) as all students, regardless of GPA, would want to pick the best qualified group members (or people they like). Also, GPA did not influence attitudes about whether group composi-tion should change for repeated projects (Q11), on issues related to group leadership (Q13, Q14, and Q15), and grouping of foreign students with weaker language skills (Q16).
Peer review and grading. Six questions focus on peer review and grading procedures (see Table 4). Business and non-business majors, on average, agreed that professors should use peer reviews (MD1.93 for Q18), trusted mem-bers to evaluate them fairly (M D 2.11 for Q19), and wanted professors to use the reviews when grading (M D
2.23 for Q20). Regardless of major, students were similarly opposed to group members receiving identical grades (MD
3.85 for Q21). Both non-business and business majors, on average, opposed being accountable for mistakes of others, but non-business majors were significantly more opposed (difference of 0.25 for Q22). Given these opinions, it is a little surprising that students are only weakly in favor of
being graded on just their individual work (M D 2.77 for Q23).
We expected GPA to impact students’ attitudes for five of six questions. Interestingly, our hypotheses were more correct for non-business than business majors. We also found that the difference in impact of GPA for non-business and business students is larger than what was seen in other question categories.
For non-business majors, a higher GPA resulted in stron-ger preferences for peer review processes (Q18) and for the results influencing grades (Q20). However, no significant effect is found for business majors. The results in question 19 may help explain this. Higher GPA for business majors translates into less trust about whether peer reviews will yield fair results (positive coefficient but lack of signifi-cance). The same is not true for non-business majors (nega-tive coefficient but lack of significance). We included the responses to question 19 in the regression specification for question 20 (results suppressed). The inclusion did not change the coefficient for non-business majors. But, the coefficient for business majors becomes virtually zero. This omitted variable bias may explain the positive coefficient found on GPA for business majors in the regression for question 20 but does not help explain the difference in coef-ficients on GPA for business and non-business majors.
In one question, GPA has opposite and significant effects for business and non-business majors. Whereas higher GPA non-business majors more strongly oppose having group members receive the same grade (Q21), higher GPA busi-ness majors more strongly support it. To further investigate, we added the responses from two questions on past experi-ence related to professors assigning differentiated grades and whether students felt grading processes were fair. The inclusion of these experience measures did not change the previously unexpected result.
Non-business majors with higher GPAs more strongly opposed being held accountable for mistakes of other (Q22) and were more supportive of being graded solely on their individual contribution (Q23). Among business majors, we only found weak and insignificant evidence of these effects. Looking into the past experience varia-bles may explain this surprising result for business majors. Higher GPA non-business students report worse experiences with group members shirking and have, themselves, shirked less often than higher GPA business majors.
Other topics. The remaining eight questions addressed topics that did not fit into other categories (see Table 5). We found no significant differences in the mean response for business and non-business majors. Students’ mean response fell in between agree and strongly agree for the ability to work in a group being an important skill (MD
1.44 for Q32) and one that employers value (MD1.34 for Q33). Students, on average, fall in between neutral and
GROUP WORK ATTITUDES, MAJOR, AND GPA 269
TABLE 4 Peer Review and Grading
When working in a group
or team. . . SAD1 AD2 ND3 DD4 SDD5 M SD
Mean difference, business to non-business
majors
GPA non-business
(b1)
GPA business (b1Cb3)
Difference (b3)
R2 F
Mdiff SE Mdiff SE Mdiff SE Mdiff SE
Q18 (¡) The professor should ask us to complete a peer review to evaluate the other group members.
41.9% 33.9% 17.4% 3.1% 3.7% 1.93 1.02 ¡0.044 0.114 ¡0.580*** 0.152 ¡0.0387 0.252 ¡0.541* 0.294 .041 4.919***
Q19 (?) I trust other group members to evaluate me fairly in a peer review.
26.5% 46.4% 17.7% 7.7% 1.7% 2.11 0.94 0.043 0.105 ¡0.0377 0.142 0.356 0.236 ¡0.394 0.276 .007 0.837
Q20 (¡) Professors should use the feedback in peer reviews when determining our grades.
24.8% 44.4% 16.8% 10.3% 3.7% 2.23 1.05 0.016 0.117 ¡0.500*** 0.157 0.221 0.260 ¡0.720* 0.304 .030 3.621***
Q21 (C) Every member of a group should receive the same grade.
3.4% 10.5% 16.0% 37.0% 33.1% 3.85 1.10 ¡0.096 0.122 0.586*** 0.162
¡0.450y 0.269 1.036*** 0.314 .045 5.494***
Q22 (C) I should be held accountable for errors made by other group members.
4.0% 10.0% 19.1% 30.5% 36.5% 3.85 1.14 ¡0.252* 0.126 0.536*** 0.169 0.167 0.280 0.369 0.327 .040 4.841***
Q23 (¡) My grade should reflect only the portions of the project that I completed.
15.7% 25.9% 27.6% 28.2% 2.6% 2.77 1.10 0.180 0.122 ¡0.620*** 0.163 ¡0.108 0.270 ¡0.512 0.316 .046 5.631***
Note: F(2, 348);*p.01.**p.05.***p.01.
270
TABLE 5 Other Topics
When working in a group
or team. . . SAD1 AD2 ND3 DD4 SDD5 M SD
Mean difference, business to non-business
majors
GPA non-business
(b1)
GPA business (b1Cb3)
Difference (b3)
R2 F Mdiff SE Mdiff SE Mdiff SE Mdiff SE
Q25 (?) Professors should teach us how to work in groups
effectively before projects are started.
20.5% 33.1% 30.5% 11.4% 4.6% 2.47 1.08 0.028 0.119 ¡0.237 0.162 0.0539 0.269 ¡0.291 0.314 .006 0.743
Q26 (?) Professors use group work to reduce their grading responsibilities.
6.6% 18.5% 33.6% 30.8% 10.5% 3.21 1.07 ¡0.054 0.119 ¡0.137 0.162 0.147 0.268 ¡0.284 0.313 .004 0.409
Q32 (?) Learning to work in a group is an important skill.
64.7% 28.8% 5.1% 0.9% 0.6% 1.44 0.69 ¡0.016 0.076 0.0642 0.103 0.0398 0.172 0.0244 0.200 .001 0.162
Q33 (?) Employers value individuals who can work effectively in a team environment.
71.8% 23.7% 4.0% 0.0% 0.6% 1.34 0.61 0.040 0.067 0.127 0.0915 ¡0.277* 0.152 0.403** 0.177 .016 1.871*
Q34 (?) Ability to work independently is more valuable than the ability to work in a group or team.
2.9% 14.0% 43.0% 34.8% 5.4% 3.27 0.87 ¡0.074 0.095 ¡0.193 0.129 ¡0.000671 0.215 ¡0.193 0.251 .008 0.945
Q35 (C) Ability to work in a team environment is as important as mastery of a specific field of study.
22.2% 39.0% 29.1% 7.1% 2.6% 2.29 0.97 0.091 0.108 0.170 0.146 0.419* 0.242
¡0.249 0.283 .014 1.687*
Q36 (?) Group work in the classroom is similar to group work in a professional business setting.
17.4% 42.7% 22.2% 12.5% 5.1% 2.45 1.08 0.059 0.119 0.112 0.162 0.119 0.269 ¡0.00683 0.314 .003 0.307
Q37 (?) Group work in the classroom does a good job of preparing me for group work in a professional business setting.
22.8% 43.6% 21.7% 8.3% 3.7% 2.26 1.02 ¡0.094 0.113 0.0516 0.154 0.209 0.255 ¡0.157 0.298 .004 0.491
Note: F(2, 348);*p.01.**p.05.***p.01.
271
agree when asked if professors should teach them how to work in groups (MD2.47 for Q25-A) and if ability to work in a team is as important as mastery of a specific field (MD
2.29 for Q35). They are fairly neutral toward the claim that professors use group work to reduce their grading (M D
3.21 for Q26) and the ability to work independently being more valuable than the ability to work in a team (MD3.27 for Q34).
We expected that students with a higher GPA would value mastery of a specific field relatively more than the ability to work in a team (Q35), placing more value on their relative strength. We found the expected positive sign on GPA for both business and non-business students, but the effect is only weakly significant for business majors. For the remaining seven questions, we conjectured that the GPA should have no impact on students’ opinions. For six, we found little evidence of the impact of GPA on student responses. The one exception was Q33, that higher GPA business students more strongly agreed that employers value teamwork ability, which can possibly be explained with (unobserved) differences in work experiences (e.g., internships) between higher and lower GPA business and non-business students.
SUMMARY OF RESULTS
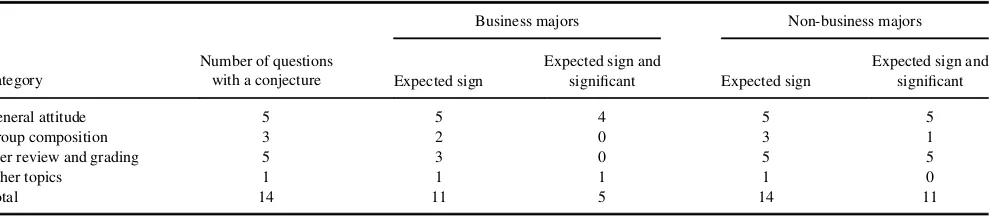
Initially we formulated six hypotheses about differences in attitudes toward group work between high- and low-achiev-ing students. From this, we expected GPA to have a specific impact on student responses in 14 of the 29 survey ques-tions investigated. Table 6 provides an overview of the results.
When comparing business and non-business majors, 11 questions and 14 questions, respectively, had coefficients with the expected sign. However, results are statistically significant in only five of 14 questions for business but 11 of 14 questions for non-business majors. The effect of GPA for business and non-business majors was in line with our expectations for the general attitude and other topic questions.
Our hypotheses were mostly well supported for non-business students but only partially and weakly supported for business students. Our research supports the hypotheses that students with higher GPAs dislike group work more and see fewer benefits than students with lower GPAs (H6). Also, higher achieving students prefer peer reviews and dif-ferentiated grading more than low-achieving students (Hypotheses 4 and 5). Interestingly, we found only partial and weak support for the hypotheses among business majors (question 21 only). The hypothesis that students with higher abilities would prefer smaller groups more than would students with lower abilities (H2) was supported only for non-business majors. The results for both majors show a lack of support for the hypothesis that students with higher ability are more in favor (than students with low abilities) of homogenous grouping by ability (H1) or for having the right to terminate shirkers (H3).
CONCLUSION
Using survey data we investigate the impact of GPA on students’ preferences for classroom group work and its structure. It is hypothesized that students act as GPA maxi-mizers (prefer higher grades if holding all else equal) and that high achievers (measured in self-reported GPA) would answer many questions differently than low achievers. For example, high-achieving students should prefer grouping by ability, smaller groups, to have the ability to expel shirkers, to have different grades on the same project, to be graded on their own individual work, and to generally dis-like group work. Low achievers should disagree.
Regression analysis was performed on the survey results in order to capture the effect of GPA, major (business vs. non-business), and their interaction. There was some gen-eral support for our hypotheses about impact of GPA on attitudes. However, results were much stronger when look-ing at non-business majors.
We can only speculate about the reasons for some of these somewhat unexpected results. Possibly, business stu-dents care less about the group work design because they TABLE 6.
Expected and Significant Results by Major and Question Category
Category
Number of questions with a conjecture
Business majors Non-business majors
Expected sign
Group composition 3 2 0 3 1
Peer review and grading 5 3 0 5 5
Other topics 1 1 1 1 0
Total 14 11 5 14 11
272 M. B. MARKS ET AL.
are taught to expect a variety of team-based organizational structures in their professional lives. Future researchers should attempt to link attitudes about group work with past experiences (inside and outside of the classroom) and students’ expectations about group work in their careers. Furthermore, it is possible that business professors structure group work assignments in a way that protects high-achiev-ing students. Last, it could be that the assumption about students’ objectives is flawed and they are not GPA maximizers.
There is more work to be done to investigate the impact of GPA and major on attitudes about classroom group work. With 351 participants at one school, this is a rela-tively small study but the first we know of to employ this approach. Expanding the sample to include more students across multiple institutions is another important step in the investigation.
REFERENCES
Anderson, J. R. (2005). The relationship between student perceptions of team dynamics and simulation game outcomes: An individual-level analysis.Journal of Education for Business,81, 85–90. doi:10.3200/ JOEB.81.2.85-90
Bacon, D. R. (2005). The effect of group projects on content-related learn-ing. Journal of Management Education, 29, 248–267. doi:10.1177/ 1052562904263729
Chapman, K. J., & Van Auken, S. (2001). Creating positive group project experiences: An examination of the role of the instructor on students’ perceptions of group projects.Journal of Marketing Education, 23, 117–127. doi:10.1177/0273475301232005
Gottschall, H., & Garcıa-Bayonas, M. (2008). Student attitudes toward group work among undergraduates in business administration, education and mathematics.Educational Research Quarterly,32, 3–28.
Hayton, J. C., Allen, D. G., & Scarpello, V. (2004). Factor retention decisions in exploratory factor analysis: A tutorial on parallel analysis.Organizational Research Methods,7, 191–205. doi:10.1177/ 1094428104263675
Hillyard, C., Gillespie, D., & Littig, P. (2010). University students’ attitudes about learning in small groups after frequent participa-tion. Active Learning in Higher Education, 11, 9–20. doi:10.1177/ 1469787409355867
Hijzen, D., Boekaerts, M., & Vedder, P. (2007). Exploring the links between students’ engagement in cooperative learning, their goal preferences and appraisals of instructional conditions in the classroom.
Learning and Instruction, 17, 673–687. doi:10.1016/j.learninstruc. 2007.09.020
Katzenbach, J. R., & Smith, D. K. (2005). The discipline of teams.
Harvard Business Review,83, 162–171.
Machemer, P. L., & Crawford, P. (2007). Student perceptions of active learning in a large cross-disciplinary classroom. Active Learning in Higher Education,8, 9–30. doi:10.1177/1469787407074008
Marks, M. B., & O’Connor, A. H. (2013). Understanding students’ atti-tudes about group work: What does this suggest for instructors of busi-ness?Journal of Education for Business,88, 147–158.
Norman, G. (2010). Likert scales, levels of measurement and the “laws” of statistics. Advances in Health Science Education, 15, 625–632. doi:10.1007/s10459-010-922-y
O’Connor, B. P. (2000). SPSS and SAS programs for determining the num-ber of components using parallel analysis and Velicer’s MAP test.
Behavior Research Methods, Instrumentation, and Computers,32, 396– 402. doi:10.3758/BF03200807
Pfaff, E., & Huddleston, P. (2003). Does it matter if I hate teamwork? What impacts student attitudes toward teamwork.Journal of Marketing Education,25, 37–45. doi:10.1177/0273475302250571
Phipps, M., Phipps, C., Kask, S., & Higgins, S. (2001). University students’ perceptions of cooperative learning: Implications for adminis-trators and instructors.Journal of Experiential Education,24, 14–21. Rassuli, A., & Manzer, J. P. (2005). “Teach us to learn”: Multivariate
anal-ysis of perception of success in team learning.Journal of Education for Business,81, 21–27.
Schultz, J. L., Wilson, J. R., & Hess, K. C. (2010). Team-based classroom pedagogy reframed: The student perspective.American Journal of Busi-ness Education,3(7), 17–24.
Shaw, J. D., Duffy, M. K., & Stark, E. M. (2000). Interdependence and preference for group work: Main and congruence effects on the satisfac-tion and performance of group members.Journal of Management,26, 259–279. doi:10.1177/014920630002600205
Su, A. Y.-L. (2007). The impact of individual ability, favorable team mem-ber scores, and student perception of course importance on student pref-erence of team-based learning and grading methods.Adolescence,42
(168), 805–826.
Winter, J. K., Waner, K. K., & Neal-Mansfield, J. C. (2008). Team climate and productivity for similar majors versus mixed majors. Journal of Education for Business,83, 265–269. doi:10.3200/JOEB.83.5.265-269 Yazici, H. J. (2004). Student perceptions of collaborative learning in
operations management classes.Journal of Education for Business,80, 110–118.
GROUP WORK ATTITUDES, MAJOR, AND GPA 273