L3 Vadose Zone Hydrology and
Groundwater Recharge
Tsutomu Yamanaka
TERC, Univ. of Tsukuba
The 20th IHP Training Course
“Groundwater as a key for adaptation to
changing climate and society”
Nov. 09, 2010 @ Nagoya University
Question
Question
What are the key variables in ensuring
sustainable use of groundwater resources ?
Sustainability of groundwater use
Sustainability of groundwater use
What are the key variables in ensuring sustainable use of groundwater resources ?
Storage
volume
Renewal
rate
Aquifer systems in arid regions
Aquifer systems in arid regions
(World Water Assessment Programme, 2006)
4
Renewable or non
Renewable or non--renewable ?renewable ?
5
Non-renewable groundwater
Huge storage volume
Very low renewal rate
Renewable
Groundwater in the hydrological cycle
Groundwater in the hydrological cycle
6
Recharge
Recharge
Gr o u n d wa ter
Gr o u n d wa ter
Vadose zone
Vadose zone
7
Definition
9
The depth-zone between
the
ground surface
and the
Question
Question
Is the vadose zone equivalent to the unsaturated zone?
Physical characteristics of vadose zone
Physical characteristics of vadose zone
9
Groundwater
Capillary fringe (saturated)
Soil
Water Air
Pressure potential
- 0 +
Wetting
Drying
Vadose zone Unsaturated
Role of vadose zone
Role of vadose zone
1. to partition the
precipitation input into
recharge flux as output to groundwater body and
evapotranspiration flux as loss
2. to damp down the
temporal variability of the output
10 Precipitation
Evapotranspiration
Literatures
Literatures
9Stephens, D.B. (1996): Vadose Zone Hydrology. Lewis Publishers, New York.
9Parlange, M.B., and Hopmans, J.W. (1999): Vadose
Zone Hydrology: Cutting Across Disciplines. Oxford
University Press, New York.
¾ Hydrology (e.g., Ward and Robinson, 1990; Brutsaert, 2006)
¾Soil physics (e.g., Hillel, 1980; Campbell, 1985)
Contents of this lecture
Contents of this lecture
Phenomenological aspects of individual processes
9 Infiltration & percolation
9 Evaporation (from soil surface)
9 Transpiration (through plant)
Unique characteristics of groundwater recharge
9 Under humid climate
9 Under arid climate
Practical methods for measuring or estimating groundwater recharge
Vadose zone hydrological processes
Vadose zone hydrological processes
13 Precipitation
Evaporation Infiltration
Groundwater recharge Surface runoff
Percolation
Infiltration
Infiltration
&
&
Percolation
Percolation
Terminology
Terminology
Infiltration
9Process of water entry into the soil across the ground
surface
Percolation
9Process of water penetration below the shallow
subsurface (e.g., root zone)
Infiltration capacity
9Maximum rate of infiltration for a given soil
¾It depends on soil hydraulic properties and varies with time during a storm event
Infiltration capacity
Infiltration capacity
16
Time
Infiltration capacity
Initial infiltration capacity
Atmospheric control phase
Atmospheric control phase
17
Time
Infiltration capacity
Rainfall intensity
Soil control phase
Soil control phase
18
Time
Infiltration capacity
Rainfall intensity
Infiltration
Final infiltration capacity
Final infiltration capacity
Land cover Final infiltration (mm/hr) n
Forest Coniferous (natural) Coniferous (artificial) Broad-leaved (natural) 211.4 260.2 271.6 5 14 15 Cutover area Slightly disturbed Heavily disturbed 212.2 49.6 10 5 Grassland Natural Artificial 143.0 107.3 8 6 Bare ground Collapsed Agricultural Paved 102.3 89.3 12.7 6 3 3 19
Examples of measured final-infiltration-capacity in Japan
Wetting front
Wetting front
20
Depth
Water content
Initial water content Saturated water content
0
Unstable wetting front
Unstable wetting front
21
Ground surface
Fingering
Preferential flow
Preferential flow
Unstable flow
¾ Fingering
Funneled flow
¾ Capillary barrier
Macropore flow
¾ Bypass flow
through rock fractures, cracks, and root tubules
22
Funneled flow
Funneled flow
23
Water content
Height above water table 0 0
Coarse sand
Fine sand
Macropore flow
Macropore flow
24
Stemflow
Stemflow--induced infiltrationinduced infiltration
25
Gross rainfall
Throughfall
Stemflow
Zero flux plain
Zero flux plain
26
Depth
Matric potential
Hydraulic potential Depth
Saturation
Equilibrium
X
Saturation to dry
Dry & rewet
DZFP
CZFP
Seasonal cycle of ZFP
Seasonal cycle of ZFP
27
Percolation
Percolation
28
(Zimmermann et al., 1967) 0 20 40
60 120 0 20 40 60 100 80
0 20 40
60 120 0 20 40 60 100 80 0 20 40
60 120 0 20 40 60 100 80
0 20 40
60 120 0 20 40 60 100 80
0 20 40
60 120 0 20 40 60 100 80 4 days 26 days
82 days 152 days
214 days
Percentage of D2O (%)
Depth (cm)
Advection (Pinston-like flow)
+
Evaporation
Evaporation
from soil surface
from soil surface
Evaporation and soil wetness
Evaporation and soil wetness
30
Soil wetness
Evaporation rate
Dry
Wet
1
st
stage
2
nd
Atmospheric control phase
Atmospheric control phase
31
Soil wetness
Evaporation rate
Potential evaporation
Dry
Penman equation Penman equation 32 a n p
E
l
G
R
E
γ
γ
γ
+
∆
+
−
+
∆
∆
=
Potential evaporationNet radiation Soil heat flux
Psychrometric constant Slope of saturation vapor pressure curve
Latent heat for evaporation
Radiative term Aerodynamic term
vpd E
a
C
Ue
p
E
=
ρ
0
.
622
Air pressure
Density of air Bulk coefficient for evaporation
Wind speed
Soil control phase
Soil control phase
33
Soil wetness
Evaporation rate
Dry
Dry Surface Layer (DSL)
Dry Surface Layer (DSL)
34
Turbulent diffusion
Dry surface layer Evaporation surface
Liquid transport Vapor transport
Atmosphere
Evaporation fl
ux
Molecular
Observed DSL
Observed DSL
35
DSL in coarse textured soils
DSL in coarse textured soils
36
DSL in fine textured soil
DSL in fine textured soil
37
Yamanaka et al. (2000)
Numerically simulated DSL
Numerically simulated DSL
38
Dependence on soil hydraulic properties
Dependence on soil hydraulic properties
39
Sand
Loam Clay
Va po r
Liquid
Total
Effect of gravel mulch
Effect of gravel mulch
40
Turbulent diffusion
Molecular diffusion
Liquid water flow
Localized DSL
Question
Question
Can evaporation occur directly from water table?
Evaporation from shallow water table
Evaporation from shallow water table
42
Hydraulic potential Depth
Saturation degree
Water vapor density
Day
Effect of shallow water table
Effect of shallow water table
43
Transpiration
Transpiration
through plants
through plants
Transpiration and root water uptake
Transpiration and root water uptake
45
Stomata
Transpiration
Root water
Two phases of transpiration process
Two phases of transpiration process
46
Soil wetness
Evaporation rate
Dry
Wet
1
st
stage
2
nd
stage
Bare
soil e vapo
ration
Trans pir
Soil
Soil--PlantPlant--Atmosphere Continuum (SPAC)Atmosphere Continuum (SPAC)
47 Transpiration Evaporation Rinterface Rsoil Rroot Rstem Rstomata 0 20 40 60 80 100 120 140 160
0 200 400 600 800 1000
De
p
th
cm
Uptake: low transpiration rate
Uptake: low transpiration rate
48 0 20 40 60 80 100 120 140 160
0 5 10 15
De p th cm Relative uptake % 0 20 40 60 80 100 120 140 160
‐4000 ‐3000 ‐2000 ‐1000 0
Matric potential
cm H2O
Uptake: medium transpiration rate
Uptake: medium transpiration rate
49 0 20 40 60 80 100 120 140 160
0 5 10 15
De p th cm Relative uptake % 0 20 40 60 80 100 120 140 160
‐4000 ‐3000 ‐2000 ‐1000 0
Matric potential
cm H2O
Uptake: high transpiration rate
Uptake: high transpiration rate
50 0 20 40 60 80 100 120 140 160
0 5 10 15
De p th cm Relative uptake % 0 20 40 60 80 100 120 140 160
‐4000 ‐3000 ‐2000 ‐1000 0
Matric potential
cm H2O
Mechanism of phase switching
Mechanism of phase switching
51
Transpiration
Evaporation
ψleaf
ψsoil1
ψstem
ψsoil2
ψsoil3
Water use strategy by plants (1)
Water use strategy by plants (1)
9 Non-streamside young trees
¾ Precipitation
9 Streamside young trees
¾ Stream water
9 All Mature trees
¾ Groundwater
9 Mature trees do not use
stream water even though they inhabit at stream side
9 Stream water is unstable
water resource
Mature (all)
Young
(streamside)
Young (non-streamside)
Riparian trees in semi-arid land
52
Water use strategy by plants (2)
Water use strategy by plants (2)
Deep rooted Shallow
rooted
Trees
Shrubs
9 Trees
¾ Summer rain
9 Shrubs
¾ Groundwater
9 Water uptake zone
corresponds root depth
9 Co-occurring plant species
utilize different water sources
Tree-shrub community in semi-arid land
53
Water use strategy by plants (3)
Water use strategy by plants (3)
-14 -12 -10 -8 -6 -4
1-Jun 2-Jul 2-Aug 2-Sep 3-Oct
2003
δ
18 O ( o /oo
)
Soil water 10cm Soil water 20cm Soil water 40cm Soil water 80cm Groundwater P. densiflora Q. myrsinaefolia Understory
54
Water source separation
Water source separation
P. densiflora
Q. myrsinaefolia
Understory
Hydraulic lift
Hydraulic lift
Day
Night
Evidence of hydraulic lift
Evidence of hydraulic lift
57
Inter
Inter--specific interaction through hydraulic liftspecific interaction through hydraulic lift
9 Herbaceous plants benefit from big tree through hydraulic lift !
Distance (m) 0.5 1 1.5 2.5 5
δD (‰)
Competition for water
Competition for water
9 Competition may overwhelm facilitative effects of hydraulic lift !
Trenching treatment Control
Growth of grasses
Low High
59
Role of plants in recharging groundwater
Role of plants in recharging groundwater
Positive role
¾ Water supply through stemflow-induced infiltration
Negative role
¾ Water loss through transpiration
Groundwater recharge
Groundwater recharge
under humid climate
under humid climate
Typical rates under humid climate
Typical rates under humid climate
Reference Location Soil Recharge (mm/yr) Precipitation (mm/yr) Recharge/ Precipitation Shimada (1983) Kanagawa,
Japan Loam 913 1670 0.55
Kayane et al. (1980)
Tokyo, Japan
Loam
885 1550 0.57
Yamanaka et al. (2005)
Ibaraki, Japan
Loam
399 1321 0.30
Yamanaka et al. (2005)
Hiroshima,
Japan Sand 523 1262 0.41
Anderson &
Sevel (1974) Denmark Till 358 780 0.46 Allison et al.
(1974) Australia Sandy loam 40-140 750 0.05-0.19 Sukhija &
Shah (1976) India Sand, loam 15-56 700 0.02-0.08 Vogel et al.
(1974) South Africa Sand 10 500 0.02
Sandy soils
Sandy soils
63
8 9 10 11 12 1 2 3 4 5 6 7
-100 0 100 200 300 400 500 600 Cu m rative i n filt ration flux (mm) 0 cm 5 cm 10 cm 20 cm 30 cm 50 cm 80 cm 1999 2000
8 9 10 11 12 1 2 3 4 5 6 7
-4 0 4 8 12 16 Monthl
y mean wate
r flux (mm/d)
P ET I
1999 2000
Loamy soil
Loamy soil
64
M
W
Precipitation
Evapotranspiration
Effect of storm event
Effect of storm event
65
Multiple recharge sources
Multiple recharge sources
66 Interruption
of river
Infiltration
of precipitation
Infiltration of paddy water
Revival
of river Springs
Recharge at alluvial fan
Recharge at alluvial fan
67
Effluent seepage from river Infiltration from paddy
A case of Nasu fan, Japan
A case of Nasu fan, Japan
68 Sabi R.
Houki R.
Naka R. g1
g30 g3 g31 g7
g4 g5 g6
g44 g45
5km A
B
Ground surface
Water table
H z
How to evaluate contribution ratio
How to evaluate contribution ratio
69 ) )( ( ) )( ( ) )( ( ) )( ( d p d r d p d r d p d g d p d g r C C c c c c C C C C c c c c C C R − − − − − − − − − − = ) )( ( ) )( ( ) )( ( ) )( ( d r d p d r d p d r d g d r d g p C C c c c c C C C C c c c c C C R − − − − − − − − − − = p r
d R R
R =1− −
Contribution of river water
Contribution of precipitation
Estimated contribution ratio
Estimated contribution ratio
70 g1 g30 g3 g31 g7 g4 g5 g6 g44 g45 Otawara 5 km Naka River Kuma River Sabi River Houki River Paddy-field water Precipitation River water 400 300 200 400 400
Wakui and Yamanaka (2006)
Distribution of paddies
Possible changes in future
Possible changes in future
Climate change effects
9Changes in precipitation and air temperature (via
potential evapotranspiration) affect groundwater recharge
9Vegetation change due to climate change may slightly
affect groundwater recharge
Human impacts
9Land use/cover change remarkably modify
groundwater recharge
9Water use also affects recharge amount and its
distribution
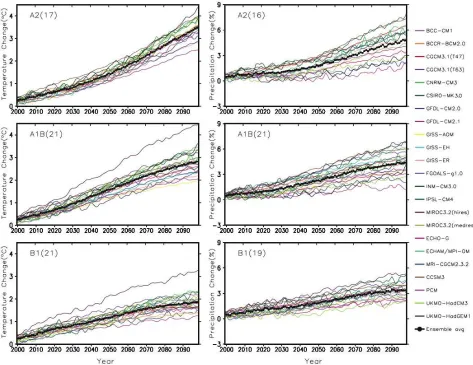
Change in temperature
Change in temperature
72 AR4-WG1_Figure 10.5. Time
series of globally averaged (left) surface warming (surface air temperature change, °C) and (right) precipitation change (%) from the various global coupled models for the scenarios A2 (top), A1B (middle) and B1 (bottom). Numbers in parentheses following the scenario name represent the number of simulations shown. Values are annual means, relative to the 1980 to 1999 average from the corresponding 20th-century simulations, with any linear trends in the
corresponding control run simulations removed. A three-point smoothing was applied. Multi-model
Change in precipitation
Change in precipitation
73
2080s mean - 1961-1990 mean SRES GCM change fields The IPCC Data Distribution Center
-2.25 -1.75 -1.25 -0.75 -0.25 0.25 0.75 1.25 1.75 2.25 (mm/d)
180 150W 120W 90W 60W 30W 0 30E 60E 90E 120E 150E 180
Groundwater recharge
Groundwater recharge
under arid climate
under arid climate
Typical rate under arid climate
Typical rate under arid climate
75
0 100 200 300 400 500
Precipitation (mm yr-1)
0 50 100 600
Pe
rcolation (mm y
r
-1 )
sinkhole
sand dune
sand dune sand dune
fractured rock
playa lysimeter
crater
With vegetation Without vegetation
Example of Mongolian grassland
Example of Mongolian grassland
76
Yamanaka et al. (2007)
0 40 80 120 0 40 80 120 MGS 0 40 80 120 Cum u la ti ve wate r flux (mm) 0 40 80 120 Water s torage (mm) DGS 0 40 80 120 0 40 80 120 DRS
1-Jun 1-Jul 1-Aug 1-Sep
2001 -40 0 40 80 120 0 40 80 120 BTS
Evaporation, soil moisture and vegetation
Evaporation, soil moisture and vegetation
77 0 40 80 120 160 5 10 15 20 25 MGS 0 40 80 120 160 Ene rgy fl ux (W/m 2) 0 2 4 6 8 Volum e tr ic wa ter c o n tent (% ) DGS 0 40 80 120 160 4 8 12 16 20 DRS
1-Jun 1-Jul 1-Aug 1-Sep
2001 -40 0 40 80 120 160 0 4 8 12 16 BTS
lE θ3
0 0.1 0.2 0.3 0.4
Vegetation cover (m2/m2)
0 5 10 15 ∆lE / ∆
θ(W 3
Question
Question
In spite of negligibly small recharge, why can people use groundwater ?
Two modes of groundwater recharge
Two modes of groundwater recharge
Distributed recharge (or diffuse recharge)
9Continuously occurring over widely distributed,
normal land covers
¾i.e., grassland, forest, agricultural land, etc.
Concentrated recharge
9Transiently occurring at a limited, specific areas
¾i.e., wadi, playa, fractured rock outcrop, etc.
Temporal variability of precipitation
Temporal variability of precipitation
80
1890 1900 1910 1920 1930 1940 1950 1960 1970 1980 1990
Year 0 10 20 30 40 50 Re ch a rge (mm /y r) 800 600 400 200 0 Rainfall (mm/y r)
Future change in rainfall intensity
Future change in rainfall intensity
81
(Kimoto et al., 2005)
No-rain days Moderate-rain days (1-20 mm/d)
Possible changes in future
Possible changes in future
Climate change effects
9Changes in not only precipitation amount but also
precipitation pattern (e.g., intensity, frequency, duration) remarkably affect groundwater recharge
9Vegetation change due to climate change also affects
recharge amount
¾Increase in precipitation enhances vegetation growth with more evapotranspiration, introducing no change in
groundwater recharge?
Human impacts
9Human activities except for agricultural land/water
use may less affect groundwater recharge
Practical methods
Practical methods
for measuring or estimating
for measuring or estimating
groundwater recharge
groundwater recharge
1. Water balance method
1. Water balance method
84
P E
T
∆S
GR
G
R= P – E
T–
∆
S
Advantage:
¾ Accurate under humid climate
¾ Areal average
Disadvantage:
¾ Relatively expensive
¾ less-accurate under arid climate
Measurement of precipitation
Measurement of precipitation
Measurement of evapotranspiration (1)
Measurement of evapotranspiration (1)
Eddy correlation method
86
q
w
Measurement of evapotranspiration (2)
Measurement of evapotranspiration (2)
Energy balance/Bowen ratio method
87
(
n o)
T
B
l
G
R
E
+
−
=
1
(
)
(
q
11q
22)
l
T
T
c
B
o pMeasurement of soil water storage change
Measurement of soil water storage change
Methods to monitor soil water content
¾TDR (Time Domain Reflectometry)
¾TDT (Time Domain Transmissivity)
¾FDR (Frequency Domain Reflectometry)
¾ADR (Amplitude Domain Reflectometry)
¾Heat probe method
¾Neutron probe method
2. Darcian flux method
2. Darcian flux method
89
Advantage:
¾ Simple
¾ Cheap
Disadvantage:
¾ Non-applicable under arid climate
¾ Less accurate
9 difficulty in estimating K
9 spatial heterogeneity
3. Lysimeter method
3. Lysimeter method
90
Advantage:
¾ Direct
¾ Applicable for various climates
¾ Disadvantage:
¾ Expensive
¾ Disturbed
9 soil
9 vegetation
4. Tracer method
4. Tracer method
91
Advantage:
¾ Applicable for various climates
Disadvantage:
¾ Sometimes uncertain
9 spatial heterogeneity
9 macropore flow
9 time scale
5. Chloride mass balance method
5. Chloride mass balance method
92
Advantage:
¾ Applicable for various climates
¾ Relatively cheap
Disadvantage:
¾ Uncertainty
9 chloride deposition rate
9 potential chloride source
9 Lateral advection
g p r
C
C
P
G
=
⋅
p