EFFECT OF PYROLYSIS TEMPERATURES ON COMPOSITION AND ELECTRICAL
CONDUCTIVITY OF CARBOSIL PREPARED FROM RICE HUSK
Wasinton Simanjuntak
1,*, Simon Sembiring
2, and Kerista Sebayang
31
Department of Chemistry, University of Lampung, Jl. Prof. Soemantri Brojonegoro No 1, Bandar Lampung 35145 2
Department of Physics, University of Lampung, Jl. Prof. Soemantri Brojonegoro No 1, Bandar Lampung 35145 3
Department of Physics, University of North Sumatra - USU, Jl. Bioteknologi No.1, Kampus Padang Bulan, Medan 20155
Received February 17, 2012; Accepted May 7, 2012
ABSTRACT
The objective of this study was to evaluate the effect of pyrolysis temperatures on composition and electrical conductivity of carbosil produced from rice husk, by conducting pyrolysis experiments at three different temperatures of 200; 400; and 700 °C. The structure of the samples were characterized using Fourier Transform Infrared (FTIR) Spectroscopy and X-Ray Diffraction (XRD). The microstructure and elemental composition were characterized using Scanning Electron Microscopy/Energy Dispersive Spectroscopy (SEM/EDS), and the electrical conductivity was four probe method. The FTIR analyses revealed the existence of Si-O-Si and Si-OH functional groups, but no functional groups associated with carbon, confirming the formation of carbosil. This formation of carbosil is also supported by the results of EDS analyses which show the presence of only three elements of C, O, and Si, respectively. The XRD results indicate that the carbosils are amorphous, suggesting that no transformation of carbon and silica into crystalline phase to the limit of the temperatures applied. The carbosil formation decreased with increasing of pyrolysis temperature. The microstructure of the carbosils indicates that the higher the temperature, the smaller the grain size of the samples. The values of electrical conductivity of the samples are in the range of 1.13 x 10⁻³to 6.81 x 10⁻³/(Ω.m) with the application of 10 tones compression pressure, but the conductivities of the sample prepared at 200 °C were found to increase with increased compression pressure to six fold from 6.81 x 10⁻³to41.94x 10-3/(Ω.m) by increasing compression pressure to 80 tones. Based on these conductivity values, the samples are considered as semiconductor, suggesting the potential use of the carbosil in semiconductor devices.
Keywords:Carbosil; rice husk; pyrolysis; microstructure; electrical conductivity
ABSTRAK
Dalam penelitian ini dipelajari pengaruh suhu pirolisis terhadap komposisi dan daya hantar listrik karbosil yang dihasilkan dari sekam padi, dengan tiga suhu yang berbeda, yakni 200; 400; dan 700 °C. Sampel dikarakterisasi dengan beberapa metode meliputi spektroskopi inframerah (FTIR), difraksi sinar-x (XRD), mikroskop elektron (SEM), spektroskopi energi (EDS), dan metode empat probe untuk pengukuran daya hantar listrik. Gugus fungsi dalam sampel yang teridentifikasi adalah Si-O-Si dan Si-OH, dan tanpa gugus fungsi yang terkait dengan karbon, yang menunjukkan pembentukan karbosil. Pembentukan karbosil didukung oleh data EDS yang menunjukkan bahwa sampel terdiri hanya dari tiga unsur, yakni C, O, dan Si. Pembentukan karbosil juga didukung oleh hasil analisis dengan XRD, yang menunjukkan struktur karbon dan silika dalam fasa amorf. Hasil percobaan menunjukkan bahwa pembentukan karbosil berkurang dengan kenaikan suhu pirolisis, disertai dengan ukuran butir yang cenderung makin kecil. Nilai daya hantar listrik sampel dengan tekanan 10 ton berkisar antara 1,13 x 10⁻³– 6,81 x 10⁻³/(Ω.m), dengan nilai tertinggi dimiliki oleh sampel yang dibuat dengan suhu pirolisis 200 °C. Penambahan tekanan hingga 80 ton terhadap sampel suhu pirolisis 200 °C diketahui mampu meningkatkan daya hantar listrik sebesar enam kali lipat, yakni dari 6,81 x 10⁻³menjadi 41,94 x 10⁻³/(Ω.m). Berdasarkan nilai daya hantar, dapat disimpulkan bahwa karbosil yang dihasilkan bersifat sebagai semikonduktor, sehingga berpotensi untuk dimanfaatkan dalam piranti semikonduktor.
INTRODUCTION
Currently, porous-carboneous materials, a group of composite composed of carbon and minerals, are continuously attracting interest as these materials are potential candidates for various applications such as, catalyst supports [1], adsorbents [2], battery electrodes in electrochemical devices such as sensor and capacitors [3], methane gas storage [4], and biomedical engineering [5]. Various applications mentioned above are resulted from microstructural characteristics such as high surface area, micropore volume, and composition in which carbon acts as electrical conductor while mineral commonly as insulator. Moreover, microstructural and electrical properties of carboneous materials derived from organic precursors have been studied extensively and have been shown to vary widely depending on the nature of the precursor and the heat treatment temperature [6-7]. Among various carboneous materials known, carbosil, which is a composite of carbon and silica, has attracted great interest, and has been investigated intensively since this composite is a promising carbon-mineral material for a wide range of application due to the dual polar-nonpolar properties of its surface, resulted from the presence of carbon and silica. This material has very interesting characteristics, such as large density of the pores and defects, the existence of carbon as surface atoms, and amorphous crystallites as a contribution of both carbon and silica [8]. Commonly, carbosil is prepared using hydrothermal or thermal treatments from a mixture of silica and carbon source. In previous studies, it was reported preparation of carbosil using amorphous silica and methylene chloride as raw materials, by pyrolysis of methylene chloride at 550 °C [9], and at 1000 °C [10], to release carbon, followed by deposition of the carbon on the silica. In another study [8], carbosil was prepared using hydrothermal or thermal treatments from a mixture of porous silica and styrene. In the context of carbosil production, rice husk is a very interesting raw material to explore. This highly abundant agriculture residue is known to contain organics and silica. It has been reported that on the weight basis, rice husk is composed of 80-85% organic components, primarily cellulose, hemicelluloses, and lignin, and 15-20% mineral ash, in which silica is the major constituent with the quantity of 94-98% [11-13]. On the basis of its composition, rice husk can be used as a single raw material for production of carbosil. Pyrolysis of rice husk under anaerobic condition is expected to result in carbonation of the organics and the carbons produced will combine with the silica to form carbosil. This potential is supported by the finding of previous study [14], which demonstrated that amorphous carbon and silica can be derived from rice husk by thermal process. Moreover, it is reported that
rice husk ash with carbon content around 45% can be obtained by thermal treatment of the husk [15]. Production of porous carbon composite from rice husk using phosphoric acid activation has also been reported [16].
As previously mentioned, carbosil is an interesting material because it composes of elemental carbon, which is known as electrical conductor, and silica which is known as electrical insulator. Hence, this study attempted to produce carbosils at different pyrolysis temperatures and investigated the effect of pyrolysis temperatures and on the composition of the carbosil produced. In addition, the effect of compression pressures on the electrical conductivity of the carbosil was also investigated. Since carbon sources and silica are both contained in the husk, preparation of carbosil from this raw material is expected to be achieved at relatively low temperatures, which is a significant advantage from practical point of view.
EXPERIMENTAL SECTION
Materials
Rice husk used in this study was obtained from a local rice milling industry. Before use, the husk was soaked in distilled water overnight to clean it from dirt and to separate the husk that contains high silica from the low one. The floating husk was discharged and sinking husk was collected as sample. The sample was dried in an oven at 110 °C overnight.
Instrumentation
The main equipments used in this study are laboratory scale pyrolysis unit and four-probe unit for electrical conductivity measurement. The instruments used are Perkin Elmer Fourier Transform Infrared (FTIR) Spectrometer, an automated Shimadzu XD-610 X-ray diffractometer with CuKαradiation
( = 0.15418 Å, produced at 40 kV and 30 mA), a Philips-XL scanning electron microscopy (SEM) associated with energy dispersive spectrometry (EDS).
Procedure
Preparation of carbosil
ground into powders by mortar and pestle, and then sieved with 200 mesh, for characterizations. Electrical conductivity of the samples was studied at ambient temperature by the four-probe method. Measurement was carried out on a sample in the form of plate with the size of 2 cm x 2.5 cm, prepared by pressing 1.5 g of the sample placed in a stainless steel dice using hydraulic pressing with the power of 10, 30, 60 and 80 tones. The conduction was ohmic in nature and the electrical
conductivity was given by the equation: σ= L R.A [17], where R is the resistance (), A is the area of the sample (cm2) and L is the sample thickness (cm).
Characterization of Carbosil
A Perkin Elmer Fourier Transform Infrared (FTIR) Spectrometer was used to study the functional group of the carbosils. For measurement, sample was prepared by grinding together approximately two mg of carbosil powder with 300 mg potassium bromide (KBr) in a mortar, and the mixture was pressed to obtain a KBr pellet. The FTIR spectrum was generated by scanning the sample over the wave number range of 4000 to 400 cm-1at a resolution of 4 cm-1. The XRD pattern was collected using an automated Shimadzu XD-610 X-ray diffractometer with CuKα radiation ( = 0.15418 Å, produced at 40 kV and 30 mA), a Philips-XL scanning electron microscopy (SEM) and associated with energy dispersive spectrometry (EDS). The diffractogram was recorded over the goniometry (2θ) ranging from 5-75° with step size of 0.02 and counting time of 1 sec/step, and post-diffraction graphite monochromator with NaI detector. Microstructure and elemental composition were analyzed using scanning electron microscopy (SEM) associated with energy dispersive spectrometry (EDS).
RESULT AND DISCUSSION
Preparation of carbosil
Typical photographs of carbosil produced at different temperatures are shown in Fig. 1, display practically black color, confirming that the carbonization of the organic compounds of the husk was achieved with the pyrolysis temperatures applied. As can be seen, the intensity of the black color decreases with increasing pyrolysis temperature, suggesting that more carbons are released from the rice husk, following the temperatures. Very intense black color exhibited by the sample produced using pyrolysis temperature of 200 °C (Fig. 1a) is most likely due to the domination of the carbon in the sample. In the other two samples (Fig. 1b and c), which were produced at higher pyrolysis temperatures, more carbons were released as carbon dioxide or carbon monoxide, leading to decrease relative amount of carbon
Fig 1. Photographs of carbosil powder prepared at different pyrolysis temperatures. a. 200, b. 400, and c. 700 °C
Fig 2. FTIR spectra of carbosil samples prepared at different pyrolysis temperatures. a. 200, b. 400, and c. 700°C
in the sample, while silica is presumably remained in the sample because of its very high thermal stability. In order to get more specific characteristic, the samples were characterized using FTIR, XRD and SEM/EDS.
Functionality study using FTIR
FTIR spectra obtained for the carbosil samples produced at different temperatures are presented in Fig. 2.
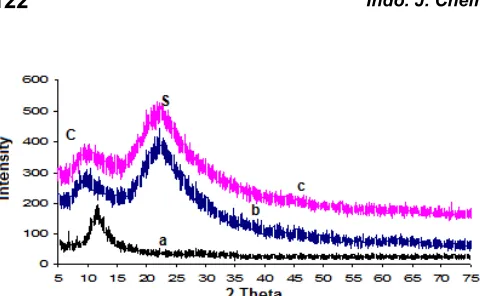
Fig 3. X-ray diffraction patterns of carbosils prepared at different pyrolysis temperatures. a. 200, b. 400, and c. 700 °C. The peaks are labeled S for silica (SiO2) and C
for carbon
Another absorption band observed in the spectra is located at around 3400-3500 cm-1is due to the vibration of –OH group, which indicates the attachment of –OH to the silica to form silanol (Si-OH) group [19]. The spectra is marked by the absence of absorption bands associated with carbon compounds, indicating that the organic components of the husk was completely carbonized to produce elemental carbon, which was then combined with the silica to produce carbosil. The formation of carbosil is supported by the results of XRD analysis, described in the following section, which clearly indicate the existence of carbon and silica phases
Despite of the simplicity of the FTIR spectra of the samples, with only a few bands observed, the spectra of the samples provide some evident of the presence of several functional group moieties associated with silica commonly reported in the literatures [18-19]. Three main absorption bands observed are a strong broad band at 1120 cm-1, accompanied with a medium band at 815 cm-1, and a strong band at 475 cm-1. The band at 1120 and 815 cm-1 are assigned to the asymmetric stretching vibration of Si-O-Si, while the band at 475 cm-1is due to the deformation of Si-O. Clearly, all of the spectra suggest an increase in the relative amount of silica with increasing pyrolysis temperature, demonstrating the possibility of less carbon on the surface of the carbosils. Another absorption band observed in the spectra is located at around 3400-3500 cm-1 is due to the vibration of –OH group, which indicates the attachment of –OH to the silica to form silanol (Si-OH) group [19]. The spectra is marked by the absence of absorption bands associated with carbon compounds, indicating that the organic components of the husk was completely carbonized to produce elemental carbon, which was then combined with the silica to produce carbosil. The formation of carbosil is supported by the results of XRD analysis, described in the following section, which clearly indicate the existence of carbon and silica phases.
The effect of pyrolysis temperatures on the formation of carbosil is quite evident in the spectra. Evidently, the band associated with the Si-OH group decreased in intensity while the intensity of the band associated with Si-O-Si bond increased with temperature. This trend indicates that polycondensation of Si-OH took place more intensively to produce Si-O-Si bonds following an increase in temperature. In overall, increased proportion of the bands assigned to silica with temperature also indicate that less carbosil was produced, and the sample is dominated by the silica. This effect of temperature is in accordance with the results of EDS analyses, described in the following section, which demonstrate the reduction of carbon content in the samples following the increase in pyrolysis temperatures.
X-ray diffraction studies
Characterization of the samples using X-ray diffraction technique was carried out to evaluate the crystallographic structure of the sample which signifies whether the sample is amorphous or crystalline phase. Identification of the phases was conducted with the aid of the PDF diffraction pattern database published by the International Centre for Diffraction Data (ICDD). This was done by comparing the diffraction lines with the standard PCPDF files using search-match method [20]. The XRD patterns of the samples are shown in Fig. 3.
Fig 4. The scanning electron microscopy (SEM) images of carbosil samples prepared at different pyrolysis temperatures. a. 200, b. 400, and c. 700 °C
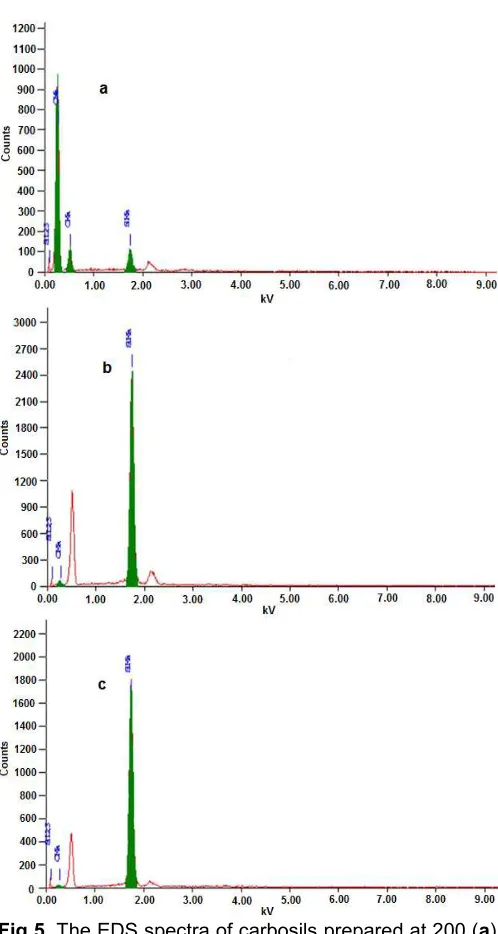
Fig 5.The EDS spectra of carbosils prepared at 200 (a), 400 (b), and 700 °C (c)
EDS analyses, described in the following section.
Microscopic (SEM/EDS) studies
It is generally known that carbon is an electrical conductor, while silica is an electrical isolator. For this reason, the electrical conductivity of carbosil is determined by the ratio of carbon and silica composing the sample. In addition, surface homogeneity is another important factor to determine the electrical conductivity of the material. In recognition of the role of these two factors, the carbosil were characterized using SEM/EDS technique. The SEM permits the observation of the samples in macro and submicron ranges, and when used in conjunction with EDS, the technique can provide information on elemental composition of the sample. The scanning electron microscopy micrographs for the sample carbosil are shown in Fig. 4 and the corresponding EDS spectra are presented in Fig. 5. As displayed by the images in Fig. 4, the surface morphology of the samples is marked by different grain size and distribution. The sample prepared at 200 °C (Fig. 2a), is marked by larger grains with more evident grain boundaries, compared to those observed for the other two samples (Fig. 4b and c). In addition, it is obvious that the clusters in the sample prepared at 200 °C are surrounded by fine grains. The large clusters are most likely composed of carbon, while the fine grains are silica. The surface of samples prepared at higher temperatures (400 and 700 °C) is most likely dominated by fine grains composed of silica, and covered some of the carbon clusters.
The EDS spectra of the samples presented in Fig. 5 showing evident presence of carbon, silicon, and oxygen. The presence of these three elements suggests the formation of carbon and silica, confirming the transformation of organic carbons in the husk into elemental carbons, as reflected by the XRD results described previously. One possible reason for this trend is promotion of infiltration/diffusion of more carbons into silica pores with increased temperature because the atomic size of carbon is much smaller than the molecular size of silica.
Table 1.Composition of the samples according to the EDS analyses. Pyrolysis Temperature (°C) C (% relative) SiO2(% relative)
200
Table 2.Electrical conductivity and resistivity of the carbosil prepared at different pyrolysis temperatures. Pyrolysis Temperature (°C) Conductivity,σ, 1/(Ω.m) x 10-3 Resistivity, ρ (Ω.m)
200
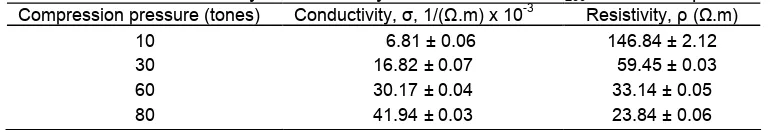
Table 3.Electrical conductivity and resistivity of the carbosil for C200at different pressures
Compression pressure (tones) Conductivity,σ, 1/(Ω.m) x 10-3 Resistivity, ρ (Ω.m) 10
Decreased carbon content of the carbosil with increased pyrolysis temperature is in agreement with the results reported by Saman et al. [11], who carried out the pyrolysis experiments of rice husk at temperature range of 700 to 1000 °C.
Electrical conductivity measurement
Electrical conductivity and resistivity of the samples C200, C400, and C700 at different temperatures with
compression pressure of 10 tones are presented in Table 2.
As shown in Table 2, increased temperatures resulted in smaller electrical conductivity, which is in agreement with the reduction of the relative amount of carbon as seen by the EDS (Table 1). Reduction of the amount of carbon caused the samples tend to act as electrical insulator because silica is known as good electrical insulator. This means that the electrical conductivity contributed by the silica component can be assumed to be negligible, and therefore, electrical conductivity by the samples can be considered as fully due to elemental carbon. From this result, it could be concluded that the electrical conductivity of the carbosils is governed by the ratio of carbon to silica. From practical point of view, this finding demonstrates that the conductivity of carbosil could be controlled by controlling the ratio of carbon to silica, to adjust the conductivity for specified application, such as electrode and conducting element in electronic device. Another factor is probably the homogeneity of the carbon and particles arrangement in the samples as a result of higher pyrolysis temperatures applied, which is in accordance
with the surface morphology of the samples, as seen in Fig. 4.
As can be seen, the sample with the highest electrical conductivity is the samples C200. This
particular sample was investigated further by increasing the compression pressures up to 80 tones to study the effect of pressure on the electrical conductivity. The results are presented in Table 3.
As shown in Table 3, increased compression pressures resulted in significant increased of the electrical conductivity, with an approximately six fold increase as a result of increased compression pressure from 10 to 80 tones. This electrical conductivity increase is most likely due to refolding of the components into more dense packing and closer contact between carbon particles created by increasing the compression pressure. Also, more dense packing of the material, collapse of pores and decrease in air gap between the carbon particles are likely to contribute to the increased electrical conductivity. In general, it can be seen that according to the values of the conductivity, the three samples are considered as semiconductor [22], suggesting the potential use of the carbosil in semiconductor devices.
CONCLUSION
200 °C, and silica in the samples obtained at 400 and 700 °C. Surface morphology and elemental composition of the samples are strongly influenced by the pyrolysis temperatures, in which the higher the temperature, the smaller the grain size of the samples, and the relative amount of carbon sharply decreased from 84.70 to 7.25% while silica increased from 15.30 to 92.75%. Decreased relative quantity of carbon led to decrease in electrical conductivity of the samples from 6.81 x 10⁻³to 1.13 x 10⁻³/(Ω.m), while increased of compression pressure from 10 to 80 tones was found to lead to an increase in electrical conductivity from 6.81 x 10⁻³ to 41.94 x 10⁻³(Ω.m). Based on the conductivity values, the samples are considered as semiconductor, suggesting the potential use of the carbosil in semiconductor devices.
REFERENCES
1. Clark, J.H., Budarin, V., Dugmore, T., Luque, R., Macquarrie, D.J., and Strelko, V., 2008, Catal. Commun., 9, 8, 1709–1714.
2. Puziy, A.M., Charmas, B., Poddubnaya, O.I., Mel’gunov, M.S., Leboda, R., and Trznadel, B.J., 2003,Colloids Surf., A, 213, 1, 45–57.
3. Apetrei, C., Apetrei, I.M., De Saja, J.A., and Rodriguez-Mendez, M.L., 2011, Sensors, 11, 2, 1328–1344.
4. Lozano-Castello, D., Alcañiz-Monge, J., de la Casa-Lillo, M.A., Cazorla-Amoro, D., and Linares-Solano, A., 2002,Fuel, 81, 14, 1777–1803.
5. Kowalczyk, P., Gun’ko, V.M., Terzyk, A.P., Gauden, P.A., Ryu, Z., and Do, D.D., 2003, Appl. Surf. Sci., 206, 67–77.
6. Kennedy, L.J., Vijaya, J.J., and Sekaran, G., 2005, Mater. Chem. Phys., 91, 471–476.
7. Rhim, Y.R., Zhang, D., Fairbrother, D.H., Wepasnick, K.A., Livi, K.J., Bodnar, R.J., and Nagle, D.C., 2010,Carbon, 48, 4, 1012–1024. 8. Xu, L., Long, T., and Guo, Q., 2010,Mater. Manuf.
Processes, 25, 654–657.
9. Gun’ko, V.M., Seledets, O., Skubiszewska-Zięba, J., Ozark, V.I., Leola, R., Janusz, W., and Chibowski, S., 2005,Langmuir, 16, 374–382. 10. Zieba, J.S, Charmas, B., Leboda, R., Staszczuk,
P., Kowalczyk, P., and Oleszczuk., P., 2002,Mater. Chem. Phys.,78, 2, 486–494.
11. Saman, M.M., Hani, N., Naina, M., and Mat, A., 2007,Solid State Sci. Technol., 15, 1, 49–55. 12. Liou, T-H., 2004, Mater. Sci. Eng., A, 364, 1-2,
313–323.
13. Nayak, J.P., and Bera, J., 2009, Phase Transitions, 82, 12, 879–888.
14. Katsuki, H., Furuta, S., Watari, T., and Komarneni, S., 2005,Microporous Mesoporous Mater., 86, 1-3, 145–151.
15. Sing, S.K., Mohanty, B.C., and Basu, S., 2002, Bull. Mater.Sci., 25, 6, 561–563.
16. Kennedy, L.J., Vijaya, J.J., and Sekaran, G., 2004, Ind. Eng. Chem. Res., 43, 8, 1832–1838.
17. Pantea, D., Darmstadt, H., Kaliaguine, S., Summchen, L., and Roy, C., 2001, Carbon, 39, 8, 1147–1158.
18. Daifullah, A.A.M., Girgis, B.S., and Gad, H.M.H., 2003,Mater. Lett., 57, 11, 1723–1731.
19. Adam, F., Kandasamy, and Balakrishnan, S., 2006, J. Coll. Interf. Sci., 304, pp 137-143.
20. Powder Diffraction File (Type PDF-2), Diffraction Data For XRD Identification, International Centre For Diffraction Data, 1997, PA, USA.
21. Trassl, S., Motz, G., Rossler, E., and Ziegler, G., 2001,J. Non-Cryst. Solids, 293-295, 261–267. 22. Corderail, J., and Greil, P., 2000, J. Eur. Ceram.