INDONESIAN CRUDE OIL PRICE AND COST (RECOVERY) BEHAVIOUR:
A longitudinal Analysis on The Indonesian Production Sharing Contract
Parulian Sihotang
BINUS Business School1
Bahtiar Saleh Abbas
BINUS Univeristy
Abstract
Oil and gas industry has been for decades a strategic sector in Indonesian economy. More than 40% of the state revenue come from the sector. In addition, the sector has also contributed significant trickle down impact such as high employment absorbtion as well as the use of local goods and services. Oil companies in the Indonesian up-stream oil and gas industry has been operating under the Production Sharing Agreement regimes where the government of Indonesia and the contractor share the oil profits using the 85/15 formula for the benefit of the government. Cost of oil consisting of exploration, development and production has to be deducted first from the gross revenue before profit sharing between the government and the production sharing contractor. Deducted cost of oil-widely known as cost recovery-has been blamed by the public at large to be the main source of inefficiency in the industry that has significantly costed the government revenue.
The main objective of this research study is to investigate how the cost recovery reacts to the changes in international crude oil prices. The research is expected to analysise the extent to which volatility in international crude oil prices has something to do with changes in exploration, development as well as production cost of companies operating under the Indonesian production sharing agreements. The relationships among those variables are examined using multiple regression analyses.
Exploration, development and production expenditures of all oil companies in Indonesia covering the period 1998 – 2007 will be quantitatily analysed. The expenditures data will be then compared to the international crude oil prices in order to see whether there is significant relationship.
There are several benefits of that come out from this exploratory study. First, to see the extent to which international crude prices could have an impact on the cost behavior of the oil companies. Secondly, if there is a relationship between international crude oil price with the cost behavious, which type cost of oil will be affected the most. Finally, to identify whether cost recovery could be used as a valid tool to measure the efficiency of the up-stream oil and gas sector in Indonesia.
Key words :Cost recovery, crude price, multiple regression analysis, Indonesian production sharing contract
1.1. Introduction
This article analyzes the expenditures of the Indonesian Production Sharing Contractors since 1998 up to 2007 in order to shed some light on (1) the extent to which volatility in the Indonesian crude price (ICP) could influence the level of petroleum expenditures; (2) assuming there is a significant relationship between the ICP and the petroleum expenditures, which type of petroleum expenditures will be most affected; (3) whether cost recovey under PSCs could be used to measure the efficiency of up-stream oil and gas sector in Indonesia. Before analysing the the petroleum expenditures behaviour, good understanding on the main characteristics of Production Sharing Contract in relation to cost recovery scheme needs to be explained. What follows is the theoretical framework of Production Sharing Contract applied in Indonesia (Sihotang, 2003;Bindenmann, 1999; Johnston, 1994)
1.2. The Theory of Petroleum Contractual Agreements
Rochmat (1981) revealed that the development of contractual arrangements in the oil and gas sector in Indonesia can be divided into three eras: the era of concessionary contract, that of contract of work (CoW) and that of
production sharing contracts (PSC). Each has different characteristics in treating petroleum expenditures or cost. What follows is the brief explanation of the production sharing agreement.2
The production-sharing agreement was devised by Dr. Ibnu Sutowo (Rochmat, 1981; Bee,1982; Johnston, 1994). There are several differences between the CoW and PSC. If the CoW was signed by the government, the PSCs were signed by the National Oil Company. PSCs are not subject to ratification by the parliament but must be approved by the president of Indonesia. The National Oil Company, is therefore, active in all fields and phases of the operations.
Indonesia is believed to be the first country to apply production sharing to petroleum operations (Barrow, 1993).3 The first production sharing agreement was signed in 1966 with International Indonesian American Petroleum Company (IIAPCO) a small independent company compared to the big former concession holders in Indonesia. The basic structure of the Indonesian PSCs reflects the following features:4 (1) Management is vested in the National Oil Company, Pertamina. Contractors, mainly foreign oil companies, are the operators who are responsible to Pertamina for operations in accordance with agreed Work Programs and Budget; (2) The contractor provides all financial and technical assistance for petroleum operations, and carries the risk of operating costs. (3) The Contractor prepares a work program and budget of operating costs annually to be agreed with Pertamina; (4) All equipment purchased by the
contractor becomes the property of Pertamina when landed in Indonesia,
although leased equipment is exempt; and (5) The contractor is to supply Indonesia’s domestic
requirement for crude oil, called the Domestic Market Obligation (DMO);
Barrow (1993) argued that Indonesian PSCs have evolved over three generations; PSCs generation-1 lasted for 10 years from 1966 to 1976, PSCs generation-2 lasted for 11 years up to 1987, while those of generation-3 lasted from 1988 to 1999.5Each generation has different characteristics.
1.3. Petroleum Expenditures and Indonesian Crude Price (ICP)
As previously explained, one main characteristic of the production sharing contract is the implementation of cost recovery concept. Under the concept, the oil companies can recover its operating cost out of the gross revenue before the revenue being shared between the government and the contractor. In other words, only after deducting cost recovery, the revenue will be share between the contractor (contractor share) and the government (government share). The higher the cost recovery is, the lower government share will be. Therefore, determining the exact amount of cost recovery is very crucial to the government revenue. That is why the question of how much cost recovery being deducted from oil gross revenue has always been the crucial issue to be resolved as well as the object of public criticism especially during the increasing international oil price for the last 10 years.6
Cost recovery consists of operating expenditures (OPEX) and the depreciation of capital expenditures (CAPEX). It includes exploration, development, production and administrative expenditures as defined in the accounting rules and procedures stipulated in Exhibit C of the Production Sharing Contracts (see also Johnston 1994;Barrow, 1993; Bindemann, 1999).
2
Johnston (1994) argued that: “Concessionary systems, as the term implies, allow private ownership of mineral resources”. Under these systems the government transfers the title of the minerals to a company if they are produced. The company is then subject to payment of royalties and taxes. The CoW is based on the principle that sovereignty over natural resources is vested in the state until the point of sale. This type of agreement also obliged the companies to relinquish their existing concessions to the government and turned them into contractors for the state companies.
3
Production sharing was actually implemented earlier in Venezuela, but not in the petroleum sector (Barrows, 1993).
4
PSC characteristics are also used in such petroleum agreements as TEA (Technical Evaluation Agreements), the TAC (Technical Assistance Contract), the PSC/JOA (Joint Operating Agreements), the EOR (Enhanced Oil Recovery Agreement), and the LA (Loan Agreement). For detail explanation see Sihotang (2003) and (Oon, 1986; Barnes, 1995).
5
However, Johnston (1994) classified the Indonesian PSCs into four generations. The first generation started from 1966 up to 1976 (10 years), the second one from 1977 up to 1987 (10 years), the third one from 1988 up to 1993 (6 years) and the fourth one from 1993 up to 1999 (6 years). He seemed to classify the PSCs generations based on changes to tax rate applied to the oil and gas sector, while Barrow put more emphasis on the changes to PSCs’ terms and conditions.
6
The exploration cost is concerned with finding new reserves, the assessment of commercial viability of discoveries and drilling activities. These costs include further G&G costs; costs from drilling of initial exploratory wells and further test-wells. Exploration costs are costs “involves identifying areas that may warrant examination and examining specific area, including drilling exploratory wells” (Gallun et al., 1993; Brock et.al 1996). Development costs are “costs incurred in preparing proved reserves for production, i.e. costs incurred to obtain access, to provide reserves and to provide facilities for extracting, treating, gathering, and storing oil and gas” (Gallun et al., 1993). Production costs are costs “incurred in lifting the oil and gas to the surface and gathering, treating, and storing oil and gas” (Gallun et al, 1993). Administrative expenses are overhead costs supporting all up-stream activities from exploration to production.
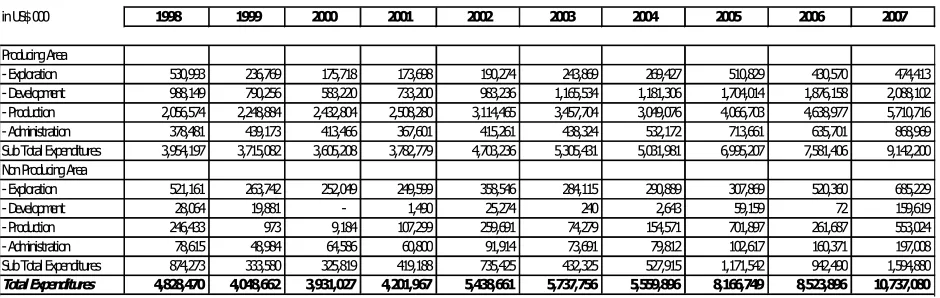
During 1998 – 2007, the total expenditures (OPEX and CAPEX) incurred by all companies operating in both producing and non-producing area in Indonesian up-stream oil and gas industry are explained in the following table.7There are 50 producing companies, and more than 100 non-producing ones (Ditjen Migas, 2007).
Table 1: Total Expenditures (1998 – 2007)
source: Dirjen Migas (2008)
During the same period the level of Indonesian crude price (ICP) is shown in the following table:
Tabel 2: Indonesian Crude Price US$ per Barrel (1998 – 2007)
Year US$/barrel
1998 12.48
1999 17.52
2000 28.39
2001 23.88
2002 24.58
2003 28.77
2004 37.58
2005 53.40
2006 64.26
2007 72.31
Source: Ditjen Migas (2008)
In order to control the level of cost recovery, petroleum operation and activities conducted for exploration, development and production need to be properly managed and controlled. That is a simple logic behind what is commonly known the activity-based costing. Unfortunately, the logic could not be taken for granted when dealing with oil and gas industry. There could be other uncontrollable factors
influencing the petroleum expenditures
such as the level of oil price which is the topic of this exploratory research.
7Non-producing areas mean that neither crude nor gas has been commercially produced from the areas. The areas are most likely in the exploration stage. Producing areas, on the other hand, are those where either gas or crude has been commercially produced.
inUS$000 1998 1999 2000 2001 2002 2003 2004 2005 2006 2007
ProducingArea
-Exploration 530,993 236,769 175,718 173,698 190,274 243,869 269,427 510,829 430,570 474,413
-Development 988,149 790,256 583,220 733,200 983,236 1,165,534 1,181,306 1,704,014 1,876,158 2,088,102
-Production 2,056,574 2,248,884 2,432,804 2,508,280 3,114,465 3,457,704 3,049,076 4,066,703 4,638,977 5,710,716
-Administration 378,481 439,173 413,466 367,601 415,261 438,324 532,172 713,661 635,701 868,969
SubTotal Expenditures 3,954,197 3,715,082 3,605,208 3,782,779 4,703,236 5,305,431 5,031,981 6,995,207 7,581,406 9,142,200 NonProducingArea
-Exploration 521,161 263,742 252,049 249,599 358,546 284,115 290,889 307,869 520,360 685,229
-Development 28,064 19,881 - 1,490 25,274 240 2,643 59,159 72 159,619
-Production 246,433 973 9,184 107,299 259,691 74,279 154,571 701,897 261,687 553,024
-Administration 78,615 48,984 64,586 60,800 91,914 73,691 79,812 102,617 160,371 197,008
SubTotal Expenditures 874,273 333,580 325,819 419,188 735,425 432,325 527,915 1,171,542 942,490 1,594,880
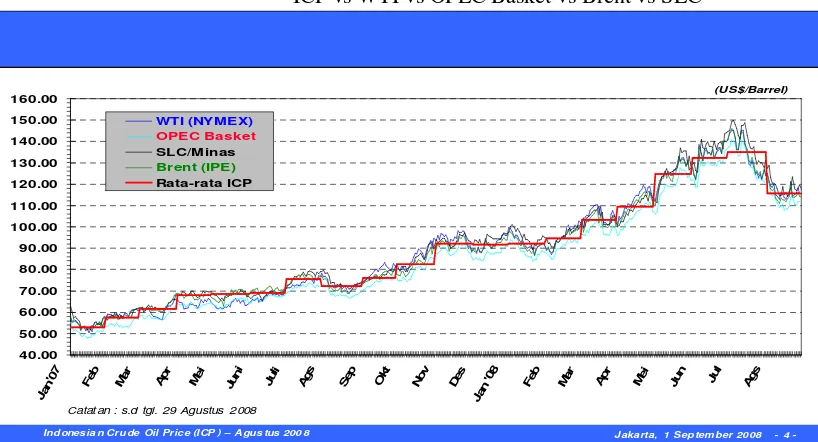
As far as the oil price is concerned, the Indonesian Crude Price is currently calculated based on the following formula: ICP = 50% PLATT’s + 50% RI.8There are 8 official Indonesian crude from producing blocks which are posted in the two official publications. They include: SLC (Sumatran Light Crude), Arjuna, Attaka, Cinta, Duri, Widuri, Belida, and Senipah Condensate. The prices of the other 40 Indonesian crude are calculated with the reference to the official 8 crude. For examples, the price of Anoa crude = Attaka + 0.4; Arimbi = Arjuna – 1.15; Geragai = SLC + 0.19; Kerapu = Belida – 0.34 and Rimau = SLC – 0.1. The following figure compares the average ICP with other main international price references such as WTI (NYMEX), Brent (IPE) and OPEC Basket for the last 20 months since Jan 2007.
Figure 1
ICP vs WTI vs OPEC Basket vs Brent vs SLC
Source: Ditjen Migas, Tim Harga
1.4. The Statistical Techniques and Results
Multiple regression technique is used to identify the relationship between the petroleum expenditures and the Indonesian crude price. What follows are the statistical results of the regression analysis.
1.4.1. Expenditures of Non-Producing Areas vs Indonesian Crude Price
Output Listing 1
NP1. Regression Analysis: NPEXPEXP versus ICP(Ind) -- Quadratic
The regression equation is
NPEXPEXP = 716521 - 25749 ICP(Ind) + 350.4 ICP(Ind)**2
R-Sq = 86.3% R-Sq(adj) = 82.3%
Analysis of Variance
8
Platts, a division of The McGraw-Hill Companies, is a leading global provider of energy and metals information. Platts serves the oil, natural gas, electricity, nuclear power, coal, petrochemical and metals markets. RIM Intelligence Co, which is estabilsed in 1984 is Japan's independent Oil Market Reporting Service. RIM provides up-to-date news on the Asia-Pacific and Arabian Gulf oil markets
Catat an : s.d tgl. 29 Agustus 2008
Source DF SS MS F P
Regression 2 1.74299E+11 8.71493E+10 21.99 0.001
Error 7 2.77417E+10 3.96309E+09
Total 9 2.02040E+11
Sequential Analysis of Variance
Source DF SS F P
Linear 1 6.90841E+10 4.16 0.076
Quadratic 1 1.05215E+11 26.55 0.001
From the statistical result, it could be concluded that there is a significant relationship between the ICP and the exploration expenditures incurred by non-producing oil companies as shown by both the linear and quadratic regression equation9.Change in Indonesian crude price is a strong explanatory power on the change in exploration expenditures as indicated by R-square (adjusted) = 82.3%.
Output Listing 2
NP2. Regression Analysis: NPDEVEXP versus ICP(Ind) -- Quadratic
The regression equation is
NPDEVEXP = 92748 - 5506 ICP(Ind) + 81.12 ICP(Ind)**2
S = 37510.3 R-Sq = 59.9% R-Sq(adj) = 46.5%
Analysis of Variance
Source DF SS MS F P
Regression 2 1.26025E+10 6301270566 4.48 0.065
Error 6 8.44215E+09 1407025063
Total 8 2.10447E+10
Sequential Analysis of Variance
Source DF SS F P
Linear 1 7271852232 3.70 0.096
Quadratic 1 5330688901 3.79 0.100
From the statistical result, it could be concluded that there is a significant relationship between development expenditures and the Indonesian crude price. It is shown by both linear (P<0.096) and quadratic (P<0.100) regression components of the equation.
Output Listing 3
NP3. Regression Analysis: NPPRODEXP versus ICP(Ind) -- Linear
The regression equation is
NPPRODEXP = - 42519 + 7694 ICP(Ind)
S = 178773 R-Sq = 46.2% R-Sq(adj) = 39.4%
Analysis of Variance
Source DF SS MS F P
Regression 1 2.19238E+11 2.19238E+11 6.86 0.031
Error 8 2.55679E+11 3.19599E+10
Total 9 4.74917E+11
From the statistical result, it could be concluded that there is a significant relationship between the ICP and the production expenditures incurred by non-producing companies. It is shown by the linear regression equation.
Output Listing 4
NP4. Polynomial Regression Analysis: NPADMEXP versus ICP(Ind) Quadratic
The regression equation is
NPADMEXP = 96798 - 2528 ICP(Ind) + 53.78 ICP(Ind)**2
S = 13626.8 R-Sq = 93.5% R-Sq(adj) = 91.6%
Analysis of Variance
Source DF SS MS F P
Regression 2 1.86050E+10 9302499849 50.10 0.000
Error 7 1.29983E+09 185690022
Total 9 1.99048E+10
Sequential Analysis of Variance
Source DF SS F P
Linear 1 1.61266E+10 34.15 0.000
Quadratic 1 2.47838E+09 13.35 0.008
From the statistical result, it could be concluded that there is a significant relationship between the ICP and the administrative expenditures of non-producing companies. It is shown by both linear and quadratic regression equation. The explanatory power of changes in ICP towards changes in administration expenditures seem to be really strong as indicated by R-square (adjusted) = 91.6%.
1.4.2. Expenditures of Producing Areas vs Indonesian Crude Price
Output Listing 5
P1. Regression Analysis: PEXPEXP versus ICP(Ind)
The regression equation is PEXPEXP = 191871 + 3629 ICP(Ind)
S = 133433 R-Sq = 25.5% R-Sq(adj) = 16.2%
Analysis of Variance
Source DF SS MS F P
Regression 1 4.87665E+10 4.87665E+10 2.74 0.137
Error 8 1.42434E+11 1.78043E+10
Total 9 1.91201E+11
From the statistical result, it could be concluded that there is a linear relationship between the ICP and the exploration expenditures incurred by producing companies. However, the relationship is less significant, with P < 0.137.
Output Listing 6
P2. Regression Analysis: PDEVEXP versus ICP(Ind) -- Linear
The regression equation is
S = 216713 R-Sq = 84.1% R-Sq(adj) = 82.1%
Analysis of Variance
Source DF SS MS F P
Regression 1 1.98297E+12 1.98297E+12 42.22 0.000
Error 8 3.75717E+11 4.69646E+10
Total 9 2.35869E+12
From the statistical result, it could be concluded that there is a significant relationship between the ICP and development expenditures of companies in producing areas. It is shown by linear regression equation. With 82.1% R-square (adjusted), it means that change in international crude price could explain well that of development expenditures of producing companies.
Output Listing 7
P3. Regression Analysis: PPRODEXP versus ICP(Ind) -- Linear
The regression equation is
PPRODEXP = 1327274 + 55102 ICP(Ind)
S = 369378 R-Sq = 91.2% R-Sq(adj) = 90.0%
Analysis of Variance
Source DF SS MS F P
Regression 1 1.12447E+13 1.12447E+13 82.42 0.000
Error 8 1.09152E+12 1.36440E+11
Total 9 1.23362E+13
From the statistical result, it could be concluded that there is a significant relationship between the ICP and the production expenditures incurred by companies in producing areas. It is shown by the linear regression equation with R-square (adjusted) = 90.0%.
Output Listing 8
P4. Regression Analysis: PADMEXP versus ICP(Ind) -- Linear
The regression equation is PADMEXP = 239869 + 7721 ICP(Ind)
S = 62051.5 R-Sq = 87.8% R-Sq(adj) = 86.2%
Analysis of Variance
Source DF SS MS F P
Regression 1 2.20792E+11 2.20792E+11 57.34 0.000
Error 8 3.08031E+10 3.85038E+09
Total 9 2.51595E+11
From the statistical result, it could be concluded that there is a significant relationship between the ICP and the administration expenditures of companies in producing areas. It is shown by the linear regression equation with R-square (adjusted) = 86.2%.
Output Listing 9
P.5. Regression Analysis: NPEXPTOT versus ICP(Ind) -- quadratic
The regression equation is
NPEXPTOT = 981595 - 33203 ICP(Ind) + 568.3 ICP(Ind)**2
S = 233618 R-Sq = 75.4% R-Sq(adj) = 68.4%
Analysis of Variance
Source DF SS MS F P
Regression 2 1.17316E+12 5.86582E+11 10.75 0.007
Error 7 3.82042E+11 5.45774E+10
Total 9 1.55521E+12
Sequential Analysis of Variance
Source DF SS F P
Linear 1 8.96460E+11 10.89 0.011
Quadratic 1 2.76705E+11 5.07 0.059
From the statistical result, it could be concluded that there is a significant relationship between the ICP and the total expenditures incurred by companies in non-producing areas. It is shown by both the linear and quadratic regression equation R-square (adjusted) = 68.4%.
Output Listing 10
P6. Regression Analysis: PEXPTOT versus ICP(Ind)
The regression equation is
PEXPTOT = 3514639 + 6207 ICP(Ind) + 971.8 ICP(Ind)**2
S = 556003 R-Sq = 93.4% R-Sq(adj) = 91.5%
Analysis of Variance
Source DF SS MS F P
Regression 2 3.05358E+13 1.52679E+13 49.39 0.000
Error 7 2.16398E+12 3.09139E+11
Total 9 3.26998E+13
Sequential Analysis of Variance
Source DF SS F P
Linear 1 2.97266E+13 79.99 0.000
Quadratic 1 8.09181E+11 2.62 0.150
From the statistical result, it could be concluded that there is a significant relationship between the ICP and the total expenditures incurred by companies in producing areas. It is shown by both the linear and quadratic regression equation with R-square (adjusted) = 91.5%.
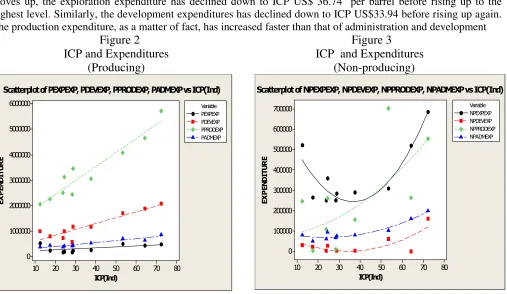
moves up, the exploration expenditure has declined down to ICP US$ 36.74 per barrel before rising up to the highest level.Similarly, the development expenditures has declined down to ICP US$33.94 before rising up again. The production expenditure, as a matter of fact, has increased faster than that of administration and development
Figure 2
Figure 3
ICP and Expenditures
ICP and Expenditures
(Producing)
(Non-producing)
Scatterplotof PEXPEXP, PDEVEXP, PPRODEXP, PADMEXPvsICP(Ind)ICP(Ind) Scatterplot of NPEXPEXP, NPDEVEXP, NPPRODEXP, NPADMEXPvs ICP(Ind)
Figure 4 shows the correlation between total expenditures and Indonesian crude price for both producinig and non-producing areas. From the graph it can be seen that oil companies in the non-producing stage, as the ICP increases, have spent much faster than those in the non-producing stage. So far as the the total expenditures of non-producing oil companies, as the ICP increases, it will decrease down to ICP US$ 29.21/barrel before rising up.
Figure 4
Total Expenditures and ICP for both Producing and Non-producing Areas
ICP(Ind)
1.5. Discussion and Interpretation
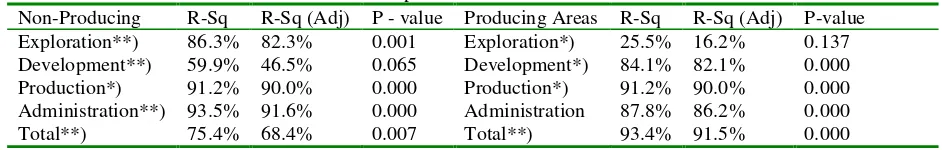
Table 3 summarizes the extent to which the level of Indonesian Crude Price (ICP) could have an influence on that of expenditures incurred by oil companies operating in either non-producing or producing areas under the Indonesian Production Sharing Contract.
Table 3 Expenditures vs ICP
Non-Producing R-Sq R-Sq (Adj) P - value Producing Areas R-Sq R-Sq (Adj) P-value Exploration**) 86.3% 82.3% 0.001 Exploration*) 25.5% 16.2% 0.137 Development**) 59.9% 46.5% 0.065 Development*) 84.1% 82.1% 0.000 Production*) 91.2% 90.0% 0.000 Production*) 91.2% 90.0% 0.000 Administration**) 93.5% 91.6% 0.000 Administration 87.8% 86.2% 0.000
Total**) 75.4% 68.4% 0.007 Total**) 93.4% 91.5% 0.000
*) linear relationship; **) quadratic relationship
From the table it can be concluded that the level of expenditures could be significantly influenced by the level of Indonesian Crude Price, with expenditures behavior of non-producing companies being generally quadratic, while that of producing-companies being linear in nature. What follows is the proposed explanation to make sense of this finding.
In the period of increasing oil price, all companies are looking for the opportunity to take the maximum benefit out of the price. Oil companies in the producing stage will pump-up as maximum oil as possible to deliver to the market in order to maximize its profit. More exploration, development and producing wells will be drilled. More facilities will be built and more equipment needs to be procured. More staff will be hired to manage the projects. The same story applies to the non-producing companies, even in a faster rate as indicated by the quadratic regression. In other words, more activities will be executed by oil companies due to the increasing oil price. And these activities will logically drive the level of expenditures: exploration, development, production and administration. In other words, cost recovery will significantly increase!
However, not only the volume of petroleum operation increases due to the increasing oil price, but also the unit cost of doing the work. The basic economics law - that of supply and demand – could easily explain the phenomena. As the demand for goods and services needed by the oil and gas companies is significantly increased, while the supply of the goods and services is relatively stable, then the price of the goods and services will be increased. In other words, the cost of doing exploration, development, production and administration expenses per unit produced will significantly increase.
As indicated by the following graph, the level of steel price over the last 5 years has been significantly increased from time to time due to the increasing oil price. Steel is the dominant material used for drilling equipment as well as platform construction for exploration activities. As the demand for drilling activities is significantly increased, the supply for steel from its manufacturer is relatively stable. As a result, the steel price is skyrocketing.
1.5. Conclusion
Based on the previous discussion on the relationship between the ICP and the level of petroleum expenditures incurred by both non-producing and producing oil companies, there are some points to be tentatively concluded as follows:
There is a significant relationship between the Indonesian Crude Price and the level of petroleum expenditures: exploration, development, production and administration expenditures both in producing and non-producing areas.
The increasing trend of expenditures in non-producing areas is faster than that of producing areas. One interpretation from the phenomenon could be that companies in non-producing seems to intensify their petroleum activities more compared to producing companies in order to get commercial crude as soon as possible
Controlling the cost recovery to get the maximum revenue for both government and production sharing contractor seems to be difficult to conduct when dealing with the increasing crude oil price which is uncontrollable to the companies.
1.6. Limitation of the research
There could be limitations of the research:
Cost recovery under the Production Sharing Agreement is not exactly defined as total expenditures, since cost recovery consists of operational capital (opex) plus depreciation of capital expenditure (capex_ plus non-recovered cost from previous years. Expenditures are only proxy of cost recovery
There could be grey area when defining expenditures for exploration and development activities
1.7.Avenue for further research
Extend the research by interviewing relevant stakeholders to get their opinion and perception
Include other relevant factors closely related with correlated with the ICP
References
Barnes, Philip, (1995),Indonesia : The Political Economy and Energy, Oxford: Oxford University Press for the Oxford Institute for Energy Studies.
Barrows, Gordon, (1993), Production Sharing in Indonesia, 1966 to 1993 : Evolution and Trends, Institute for International Research, Houston.
Bee, O.J. (1982). The Petroleum Resources of Indonesia, Oxford University Press, Kuala Lumpur.
Bindemann, Kirsten, (1999), Production Sharing Agreements: An Economic Analysis, Oxford Institute for Energy Studies, Oxford.
Brock, H.B., Jennings D.R., Feiten, J.B (1996), Petroleum Accounting: Principles, Procedures, & Issues, PDI University of Texas and PriceWaterhouseCoopers.
Direktorat Jenderal Migas (2007), various unpublished documents
Gallun R.A., Stevenson J.W., Nichols L.M. (1993), Fundamentals of oil and gas accounting, PennWell Publishing Company, Tulsa, Oklahoma
Johnston, D. (1994b). “International Petroleum Fiscal Systems: Production Sharing Contracts”, Petroleum Accounting and Financial Management, Vol.13, No.2, pp. 24-75.
Oon, K.C. (1986), The politics of oil in Indonesia: Foreign company – host government relations, Cambridge University Press, Cambridge
Rochmat, Rudioro,(1981), Contractual Arrangements in Oil and Gas Mining Enterprises in Indonesia, Sijthoff & Noordhoff, The Netherlands.