Full Terms & Conditions of access and use can be found at
http://www.tandfonline.com/action/journalInformation?journalCode=tbeq20
Biotechnology & Biotechnological Equipment
ISSN: 1310-2818 (Print) 1314-3530 (Online) Journal homepage: http://www.tandfonline.com/loi/tbeq20
Molecular study of intraspecific differences among
Sauropus androgynus (L.) Merr. from Indonesia
revealed by ITS region variability
Oeke Yunita, Ike Dhiah Rochmawati, Nur Aini Fadhilah & Njoto Benarkah
To cite this article: Oeke Yunita, Ike Dhiah Rochmawati, Nur Aini Fadhilah & Njoto Benarkah
(2016) Molecular study of intraspecific differences among Sauropus androgynus (L.) Merr. from Indonesia revealed by ITS region variability, Biotechnology & Biotechnological Equipment, 30:6, 1212-1216, DOI: 10.1080/13102818.2016.1224978
To link to this article: https://doi.org/10.1080/13102818.2016.1224978
© 2016 The Author(s). Published by Informa UK Limited, trading as Taylor & Francis Group
Published online: 09 Sep 2016.
Submit your article to this journal
Article views: 350
View related articles
ARTICLE; PHARMACEUTICAL BIOTECHNOLOGY
Molecular study of intraspeci
fi
c differences among
Sauropus androgynus
(L.) Merr.
from Indonesia revealed by ITS region variability
Oeke Yunitaa, Ike Dhiah Rochmawatia, Nur Aini Fadhilahaand Njoto Benarkahb
aDepartment of Pharmaceutical Biology, Faculty of Pharmacy, University of Surabaya, Surabaya, Indonesia;bInformatics Engineering
Department, Faculty of Engineering, University of Surabaya, Surabaya, Indonesia
ARTICLE HISTORY Received 10 November 2015 Accepted 12 August 2016 ABSTRACT
DNA sequence analysis of the nuclear ribosomal internal transcribed spacer (ITS) region was exploited for its applications in the authentication ofSauropus androgynus(L.) Merr. as raw-material herbal medicine and supplement. Leaf samples from 12 different geographic locations in Indonesia were collected. Twelve DNA sequences from the samples were analysed. The sequences were trimmed before sequence alignment. The sequences ranged from 626 to 664 bp in length after trimming. Based on the multiple sequence alignment, a phylogenetic tree was generated using the MrBayes program. It consisted of two groups: one group comprised sequences from Trawas and the other one comprised sequences from Batu, Trawas and Surabaya. These results strongly suggest that ITS sequence analysis is a valuable tool for distinguishing intraspecific differences amongS. androgynuscultivars from Indonesia.
KEYWORDS
Internal transcribed spacer; Sauropus androgynus; molecular study; sequencing
Introduction
Sauropus androgynus (L.) Merr., originally described as
Clutia androgyna Linnaeus [1], is a South-East Asian
indigenous plant belonging to the Euphorbiaceae family, widely cultivated for traditional medicinal purposes [2]. Indonesian people traditionally useS. androgynus (com-monly known as ‘katuk’, ‘sweet shoot leaves’ and ‘star gooseberry’) for increasing human breast milk produc-tion. The dark green leaves have various nutritive values and are commonly used for human consumption in South-East Asia. The leaves ofS. androgynusare effective as an antioxidant [3–5]. Several studies report positive antioxidant activity of S. androgynus. For example, Andarwulan et al. [5] found that it has the highestfl avo-noid content among 11 vegetables of Indonesian origin. Rahmat et al. [3] showed that the antioxidant activity of fresh and boiled shoot samples of S. androgynus was higher than that of alpha-tocopherol.S. androgynushas also been reported to have significant antimicrobial activity againstKlebsiella pneumoniaeandStaphylococcus aureus [6]. Yu et al. [7] showed that an isolated com-pound from S. androgynus extract has a potential to become an antiobesity agent by reducing the body weight of Wistar male rats.
Accurate identification of herbal medicine species is a prerequisite for chemical and pharmacological investiga-tion. At present, S. androgynus is identified using
morphological characters or based on its phytochemical content, such as rutin. However, these approaches are inappropriate because the morphological characters of this plant are not specific and rutin concentration largely varies in many other plant species. Given the difficulties in distinguishing this plant, there is a need to establish a reliable method for its authentication of the plant as a raw material. One of the most reliable methods for iden-tification of herbal medicine materials is DNA analysis based on three types of techniques: polymerase chain reaction (PCR), hybridization and sequencing [8,9].
The sequences of the internal transcribed spacer (ITS) regions of nuclear ribosomal DNA are frequently used for molecular identification of crude herbs. Nuclear ribo-somal genes in plant genomes are constituted of individual 18S ¡ 5.8S ¡ 26S tandem repeats, which make this region easy to amplify. The ITS regions in angiosperms vary within approximately 500–700 bp in length [10].
Phylogenetic studies have shown the close relationship between Phyllanthus niruri and S. androgynus based on several DNA regions such as ITS, matK, PHYC, accD-psal, trnS-trnG[11–15]. S. androgynusITS (ITS1C 5.8SCITS2) ranges from 557 to 599 bp, whereas the ITS region DNA sequence alignment is reported to be 708 bp long [14].
In this study, we investigated the intraspecific differ-ences among S. androgynus accessions from Indonesia
CONTACT Oeke Yunita [email protected]
© 2016 The Author(s). Published by Informa UK Limited, trading as Taylor & Francis Group.
This is an Open Access article distributed under the terms of the Creative Commons Attribution-NonCommercial-NoDerivatives License (http://creativecommons.org/licenses/by-nc-nd/4.0/), which permits non-commercial re-use, distribution, and reproduction in any medium, provided the original work is properly cited, and is not altered, transformed, or built upon in any way.
VOL. 30, NO. 6, 1212–1216
revealed based on the variability of the ITS region. To the best of our knowledge, this is the first report showing sequence analysis of the ITS region ofS. androgynus cul-tivars from different geographic locations in Indonesia.
Materials and methods
Plant materials
Fresh leaves ofS. androgynuswere used as materials. The accessions and locations are listed in Table 1. All the samples were authenticated by the Center of Informa-tion and Development of TradiInforma-tional Medicine (PIPOT), Faculty of Pharmacy, University of Surabaya, East Java, Indonesia. Young green leaves of S. androgynus were collected, washed, mopped dry and quickly stored at
¡80C until use.
DNA sequencing and analysis
Total DNA was isolated from leaf samples ofS. androgy-nususing NucleoSpin® Plant II, according to the manu-facturer’s instructions. The ITS regions were amplified by using primers of ITS-5 (50
-TAGAGGAAG
GAGAAGTCG-and 71C for 2 min in a T100 PCR thermal cycler (BioRad,
Hercules, CA, USA). Thefinal extension cycle allowed an additional incubation for 5 min at 71 C. The PCR
products were visualized by 2% agarose gel electropho-resis under ultraviolet (UV) light to check the presence of amplified bands using gel documentation system Uni-versal Hood II (BioRad). The ITS region of each sample was sequenced in a DNA sequencer (Applied Biosystems 3730XL, Foster City, CA, USA). Purification and sequenc-ing of ITS rDNA was conducted by Macrogen (Seoul, Korea). ITS sequences of S. androgynus were retrieved
from GenBank and analysed together with the
sequences acquired in the present study. The ClustalW method was used to align the DNA sequences after gen-eration of the .ab1 files. The sequences had been checked and trimmed before being aligned. Chromato-grams were analysed with FinchTV. Analysis of nucleo-tide sequences was done using BLAST (Basic Local Alignment Search Tool,http://ncbi.nlm.nih.gov/blast) to search for highly similar sequences in the National Cen-ter for Biotechnology Information (NCBI) database.
Phylogenetic analysis
Phylogenetic analysis and phylogenetic tree construc-tion were done using the MrBayes 3.2 program based on Bayesian inference using the Markov Chain Monte Carlo (MCMC) method. Bayesian inference and MCMC used for phylogenetic construction were considered computa-tionally more efficient than the standard maximum likeli-hood method [16].
Results and discussion
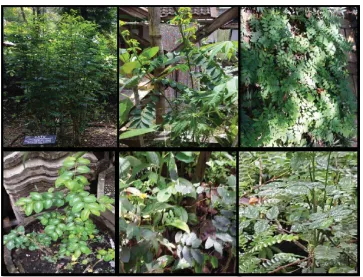
The studied samples were collected from various loca-tions with different geographic condiloca-tions, including lowland (Surabaya), midland (Trawas) and highland (Batu) areas (Table 1,Figure 1). All samples were similar based on their morphological characters.
In this study, PCR and DNA-sequencing methods were used to obtain the ITS sequences ofS. androgynus acces-sions from several different geographic locations in East Java, Indonesia, and these sequences were compared to GQ503380.1, and annotated in NCBI as a reference sequence. The ITS region is characterized by moderate variability, which is why it is mainly used for the identifi -cation of species and varieties. To perform a comparative analysis of the ITS nucleotide sequences of all samples, BLAST analysis was performed. The electrophoresis pat-terns of the ITS fragments amplified using the ITS-4 and ITS-5 primers showed that these primers could clearly Table 1.Samples ofSauropus androgynusused in DNA sequence analysis.
Location Sample code Altitude (meters amsl) Temperature (8C) Relative humidity (%)
Surabaya East Surabaya ST 0 29.0–30.0 73–74
Central Surabaya K 0 32.0–32.7 55–56
West Surabaya SB 0 27.7–28.6 61–67
Seloliman, Trawas PPLH P1 320 25.1–32.1 61–72
Trawas UTC area 1, sample 1 U1-A 600 25.7–31.2 61–72
Note: PPLH,Pusat Pendidikan Lingkungan Hidup/Environmental Education Center; UTC, Ubaya Training Center; BMM, Materia Medica Batu.
amplify particular DNA fragments. PCR amplification using these primers specifically recognized the ITS region, as demonstrated by the agarose gel electropho-resis results.Figure 2 shows that a single clearly ampli-fied band of»700 bp was generated from all samples.
The ITS regions of the 12 samples were shown to range from 626 to 664 bp in size. The average length of the sequences obtained using the ITS-4 and ITS-5 pri-mers was 655.8 and 655.1 bp, respectively. The sequen-ces of all samples showed high-quality chromatograms.
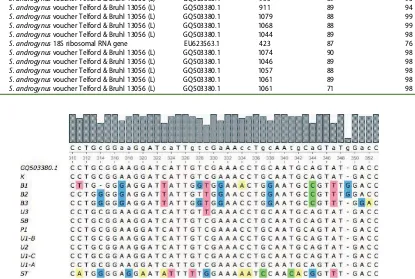
Nucleotide sequence analysis of the ITS region of the studied S. androgynus samples was done with known DNA sequences in the NCBI databases. When the homol-ogous nucleotide sequences of each sample were ana-lysed using BLAST (Table 2), the results showed that all sequences from the samples ofS. androgynushad 94%–
99% similarity with theS. androgynusvoucher Telford & Brubl 13056 (GQ503380.1), with the only exception of the sequence from Surabaya Timur (ST). There was no significantly similar sequence for ST because it did not meet the default threshold of NCBI’s BLAST algorithm, but there were some similar sequences which gave 76% similarity with the S. androgynus 18S ribosomal RNA gene (EU623563.1).
Figure 3 shows multiple sequence alignments of the ITS regions from the 12 samples ofS. androgynusby the ClustalW method. The results showed thatS. androgynus from ST had a unique base-pair variation which could distinguish it from the other 11 samples despite the fact that they share many morphological similarities.
The multiple sequence alignment was done by com-parison to a chosen reference sequence, GQ503380.1, which has the topmost identity values based on the NCBI’s BLAST searches of the 12 ITS-4 primer samples. The multiple sequence alignment of the fragments amplified using the ITS-5 primer was also compared to this reference sequence. All ITS-4 primer samples showed good matches with GQ503380.1. The multiple sequence alignment of the ITS-5-generated fragments gave several gaps, some from the insertion of samples from U3 and U1-C. The conserved regions in the ITS-5-based multiple sequence alignment were less than those based on the ITS-4-based multiple sequence alignment.
Figure 1.Sauropus androgynusfrom several locations in East Java, Indonesia.
For construction of a phylogenetic tree guided by par-simony values, the MrBayes method was used in a num-ber of recent studies [17,18]. For building the phylogenetic tree, only the sequences generated using the ITS-4 primer were used because the multiple
sequence alignment showed that all sequences
obtained with this primer were more conserved than those amplified with the ITS-5 primer.
The dendrogram presented inFigure 4shows that the samples from the 12 different geographic locations were
divided into two groups reflecting the relationships between the genetic characteristics and geographical distribution. The samples from the highland region (Batu), B1, B2 and B3, were shown to be related to each other. They formed thefirst group, with U3 from Trawas and SB from Surabaya. The second group included the samples P1, U1-B, U2, U1-C and U1-A, which are from the same region, midland (Trawas). Interestingly, one sample from Trawas (U3) showed close relationship with the samples from Batu and was away from its original group of midland regions. These sequence variations might be due to intraspecies polymorphism; however, more detailed investigations are needed to explain the reasons behind this polymorphism.
The samples from Surabaya (ST, SB, K) did not show close relationship. This observation is in accordance with the study of Yunita and Sulisetiorini [19], who reported the same results based on random amplified polymor-phic DNA analysis of the ITS region of S. androgynus leaves from Surabaya. Asmarayani and Pancoro [20] revealed that the process of wide domestication could cause high variation in ITS sequences because human interference in plant domestication could result in botanical evolution diversity. Genetic variation can be indirectly caused by dispersal by humans, while these Table 2.Homology search ofS. androgynusaccessions in the NCBI database.
ITS4 High similarity Accession number Total score Query coverage (%) Similarity index (%) B1_ITS S. androgynusvoucher Telford & Bruhl 13056 (L) GQ503380.1 909 89 94 B2_ITS S. androgynusvoucher Telford & Bruhl 13056 (L) GQ503380.1 933 89 95 B3_ITS S. androgynusvoucher Telford & Bruhl 13056 (L) GQ503380.1 911 89 94 K_ITS S. androgynusvoucher Telford & Bruhl 13056 (L) GQ503380.1 1079 88 99 P1_ITS S. androgynusvoucher Telford & Bruhl 13056 (L) GQ503380.1 1068 88 99 SB_ITS S. androgynusvoucher Telford & Bruhl 13056 (L) GQ503380.1 1044 89 98
ST_ITS S. androgynus18S ribosomal RNA gene EU623563.1 423 87 76
U1_A_ITS S. androgynusvoucher Telford & Bruhl 13056 (L) GQ503380.1 1074 90 98 U1_B_ITS S. androgynusvoucher Telford & Bruhl 13056 (L) GQ503380.1 1046 89 98 U1_C_ITS S. androgynusvoucher Telford & Bruhl 13056 (L) GQ503380.1 1057 88 98 U2_ITS S. androgynusvoucher Telford & Bruhl 13056 (L) GQ503380.1 1061 89 98 U3_ITS S. androgynusvoucher Telford & Bruhl 13056 (L) GQ503380.1 1061 71 98
Figure 3.Multiple sequence alignment of ITS regions from 12 samples ofS. androgynus(ClustalW).
Figure 4.Phylogenetic tree of 12 samples ofS. androgynusbased on the nucleotide sequence of the ITS locus.
variations may occur due to the ability of plants to sur-vive by adapting to their environment, breeding and passing their genes onto the next generation. The similar morphological characters of the studied S. androgynus samples demonstrated that some alteration in the DNA nucleotide bases may not directly change the morpho-logical characters of the plants. Thus, the use of ITS region sequences would be able to better distinguish any intraspecific differences amongS. androgynus culti-vars. The results from this study showed that ITS sequence analysis could be developed as a reliable method for authentication of S. androgynus as a raw material in the herbal medicine industry.
Conclusions
To the best of our knowledge, this is thefirst report show-ing sequence analysis of the ITS region ofS. androgynus cultivars from different geographic locations in Indonesia. The obtained results showed that the ITS sequence pro-vides a good and reliable indicator for geographical ori-gin. This strongly suggests that ITS sequence analysis is a valuable tool for distinguishing the genetic relationship among the cultivars ofS. androgynus.
Funding
This research was supported by the Ministry of Research, Tech-nology, and Higher Education, the Republic of Indonesia [grant number 027/ST-Lit/LPPM-01/Dikti/FF/IV/2015].
References
[1] Bingtao L, Gilbert MG. Sauropus. In: Bingtao L, Huaxing Q, Jinshuang M et al., editors. Euphorbiaceae. Flora of China. Vol. 11. St. Louis (MI): Missouri Botanical Garden Press; 2008. p. 202.
[2] Bunawan H, Bunawan SN, Baharum SN, et al. Sauropus androgynus (L.) Merr. induced bronchiolitis obliterans: from botanical studies to toxicology. Evid Based Comple-ment Alternat Med [Internet]. 2015 [cited 2016 Feb 15];2015:714158. Available from: http://www.hindawi. com/journals/ecam/2015/714158/
[3] Rahmat A, Kumar V, Fong LM, et al. Determination of total antioxidant activity in three types of local vegetable shoots and the cytotoxic effect of their ethanolic extracts against different cancer cell lines. Asia Pac J Clin Nutr. 2003;12:292–295.
[4] Benjapak N, Swatsitang P, Tanpanich S. Determination of antioxidant capacity and nutritive values of Pak-Wanban (Sauropus androgynusL. Merr.). KKU Sci J.2008;36:279–289. [5] Andarwulan N, Batari R, Sandrasari DA, et al. Flavonoid content and antioxidant activity of vegetables from Indo-nesia. Food Chem.2010;121:1231–1235.4
[6] Paul M, Anto KB. Antibacterial activity ofSauropus andro-gynus(L.) Merr. Int J Plant Sci.2011;6(1):189–192.
[7] Yu SF, Shun CT, Chen TM, et al. 3-O-b-D-glucosyl-(1!
6)-b-D-glucosyl kaempferol isolated fromSauropus androgy-nusreduces body weight gain in Wistar rats. Biol Pharm Bull.2006;29:2510–2513.
[8] Yip PY, Chau CF, Mak CY, et al. DNA methods for identifi -cation of Chinese medicinal materials. Chin Med [Inter-net].2007[cited 2016 Feb 15];2:9. Available from:http:// cmjournal.biomedcentral.com/articles/10.1186/1749-8546-2-9
[9] Joshi K, Chavan P, Warude D, et al. Molecular markers in herbal drug technology. Curr Sci.2004;87(2):159–165. [10] Alvarez I, Wendel JF. Ribosomal ITS sequences and plant
phylogenetic inference. Mol Phylogenet Evol. 2003;29:417–434.
[11] Samuel R, Kathriarachchi H, Hoffman P, et al. Molecular phylogenetics of Phyllanthaceae: evidence from plastid matK and nuclear PHYC sequences. Am J Bot. 2005;92 (1):132–141.
[12] Kathriarachchi H, Samuel R, Hoffmann P, et al. Phylo-genetics of tribe Phyllantheae (Phyllanthaceae; Euphorbiaceae Sensu Lato) based on nrITS and plas-tid matK DNA sequence data. Am J Bot. 2006;93 (4):637–655.
[13] Hidayat T, Kusumawaty D, Kusdianti, et al. Analisis Filoge-netik Molekuler padaPhyllanthus niruriL. (Euphorbiaceae) Menggunakan Urutan Basa Daerah internal transcribed spacer (ITS) [Molecular phylogenetic analysis of niruri PhyllanthusL. (Euphorbiaceae) using internal transcribed spacer (ITS) region DNA sequence]. Jurnal Matematika dan Sains.2008;13(1):16–21. Indonesian.
[14] Pruesapan K, Telford IRH, Bruhl JJ, et al. Delimitation of Sauropus (Phyllanthaceae) based on plastid matK and nuclear ribosomal ITS DNA sequence data. Ann Bot. 2008;102:1007–1018.
[15] Pruesapan K, Telford IRH, Bruhl JJ, et al. Phylogeny and proposed circumscription of Breynia, Sauropus and Synos-temon (Phyllanthaceae), based on chloroplast and nuclear DNA sequences. Aust Syst Bot.2012;25:313–330.
[16] Ronquist F, Huelsenbeck JP. MrBayes 3: Bayesian phyloge-netic inference under mixed models. Bioinformatics. 2003;19(12):1572–1574.
[17] Ronquist F, Teslenko M, van der Mark P, et al. MrBayes 3.2: efficient Bayesian phylogenetic inference and model choice across a large model space. Syst Biol.2012;61:539–
542.
[18] Tong YG, Shi WF, Liu D, et al. Genetic diversity and evolu-tionary dynamics of Ebola virus in Sierra Leone. Nature. 2015;524:93–96.
[19] Yunita O, Sulisetiorini. DNAfingerprinting on ITS region of Sauropus androgynus’nrDNA from East Java, by random amplified polymorphic DNA method. In: Scheer H, Prad-han B, Brotosudarmo THP, editors. International Confer-ence on Natural SciConfer-ences. Proceedings; 2011 July 9–11; Batu. Aachen: Shaker Verlag;2013. p. 251–257.