PAPER
FINAL PROJECT SEMINAR
THE EFFECT OF AIR FLOW VELOCITY IN COPING WOOD
GASIFICATION TOWARD COMBUSTION TEMPERATURE
AND EFFECTIVE COMBUSTION TIME
The Paper of Final Project Seminar is submitted as requirement to follow Final Project Examination in Automotive Engineering Department
Arranged by:
DHIMAS CAHYO ANINDITO
D200112006
MECHANICAL ENGINEERING DEPARTMENT
INTERNATIONAL PROGRAM
IN AUTOMOTIVE/MOTORCYCLE ENGINEERING
MUHAMMADIYAH UNIVERSITY OF SURAKARTA
THE EFFECT OF AIR FLOW VELOCITY IN COPING WOOD GASIFICATION TOWARD COMBUSTION TEMPERATURE AND EFFECTIVE COMBUSTION TIME
Dhimas Cahyo Anindito
Automotive Engineering Department Muhammadiyah University of Surakarta
Jln. A. Yani Tromol Pos I Pabelan, Kartasura, Surakarta 57102 Email : [email protected]
ABSTRACT
Nowadays, coping wood is one of the most reliable solutions for alternative energy. Coping wood can produce methane by using gasification technology. By those facts, this research has been held to find out the effect of air flow velocity toward combustion temperature in coping wood gasification.
The first step of this method applied four variation of air flow velocities such as, v=4.2m/s, v= 5.6 m/s, v=6.9 m/s, and v=7.6 m/s. Temperature measurement was recorded every minute. Thermocouple has been put at the centre-bottom of fire for recording temperature changing per minute. By the height of fire temperature measurement, the thermocouple put at the outer bottom, middle, and top of fire. Effective combustion process has been recorded with stopwatch. It is recorded from the gasification can be ignited until there is no flame on burner.
This experiment did not detect a significant effect among maximum combustion temperature and air flow velocity. The highest temperature was not gained at the fastest air flow but at v=5.6 m/s. Nevertheless, a positive correlation was found between air velocity and effective combustion time. The longest effective combustion was gained at the maximum air velocity v=7.6 m/s with 780 s. There is a clear trend of increasing effective combustion time while the air flow velocity was faster.
Keywords: coping wood, gasification, air flow velocity, effective combustion time, combustion temperature.
Background
In recent years, there has been an increasing problem for providing fuel in home industry. There is a high number of consumption of crude oil Indonesia meanwhile Indonesia s fuel reserves is less than 0.5% of world s fuel reserves. Debate continues about the best strategies for the management of our fuel reserves, but we know that crude oil is not renewable energy. This condition is forcing to discover another energy
resource which is easy to find and apply in Indonesia.
DEPHUT (1990) identifies more than 50.2% potential waste from coping wood industry. Based from that data, it shows a huge potential of coping wood to reuse as alternative energy. However, approaches of this potential carry with them various well known limitations. People only use coping wood as conventional combustion fuel resources which cause air pollution. Several studies about energy conversion have used to solve energy crisis. But those technologies still use direct combustion such as pyrolysis, anaerobic digestion, and gasification. Each has its advantages and disadvantages. The gasification technology was chosen because it relatively simple and easy to operate.
Methane gas can be produce from lumber by using gasification technology. Gasification is conversion process of solid fuel become gas fuel with high temperature. Gasification produces environmentally friendly gas product such as hydrogen and carbon monoxide. Moreover, gasification is easier to control than another biomass direct combustion because it is gasiform.
Nevertheless, there are only a few researches or utilizing of gasification in Indonesia. Whereas, gasification product is usable as useful as cooking, rotate turbine, power up internal combustion engine, and so on (Tasliman, 2008). By those facts, gasification technology is really suitable to be developed in Indonesia. Furthermore, it needs visceral research before this technology going to be mass production product.
c. This gasification furnace use glass wool as isolator.
d. This research do not discuss about heat transfer.
Objective of Study
According to background and statement that have been explained before, the objective of this research is as followed:
a. To find the influence of air velocity toward combustion temperature.
b. To invent the best air velocity for gaining the longest effective combustion of coping wood gasification.
Literature Study
In 2000, Reed et.al. examined wood furnace with gasification system and he found blower with 3 watt power can be produced 1-3kW heat. Moreover, it adds 30% more efficiency for cooking.
Belonio (2005) staked out Rice Husk Gasification Furnace with updraft system. Belonio designed the gasifier very simple by linking up ask chamber, fan chasing, reactor and burner into one body.
than husk. It proves that the root cause of solid fuel gasification is the design of gasification furnace. The design must be accord with the type of fuel.
Pathak et.al. (2008) evaluated down draft gasifier performance and he discovered the relation between temperature and air flow velocity. Temperature will be higher when the air flow is faster.
Nugraha (2010) gasified organic waste with anaerobic gasification with fermentation process. He heaped organic waste until seven days then the gas was flowed to the purifier. Finally, there was 70% of methane can be used as LPG substitution.
Combustion
Combustion is a chemical process where there is a superbly fast reaction between substances with oxygen then it gives off the heat and sometimes it comes along with flame.
The air is composed by 79% of Nitrogen and 21% of Oxygen where oxygen is the essential requirement in combustion process. By virtue of combustion waste gas, there are two kind of combustion, followed by:
a. Perfect combustion: this combustion process burn out all substances become gas form of CO2, SO2, and H2O(l). So there is no substance which can be burned again. The perfect combustion only will be happen if there is perfect mixture between fuel and air. b. Imperfect combustion: the
combustion which will be happen if there is CO, H2, N2,
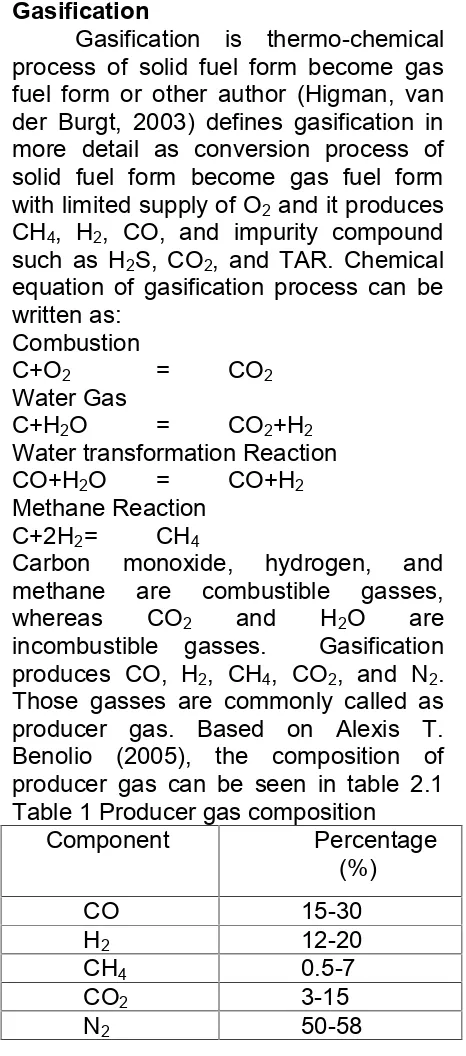
Gasification is thermo-chemical process of solid fuel form become gas fuel form or other author (Higman, van der Burgt, 2003) defines gasification in more detail as conversion process of solid fuel form become gas fuel form with limited supply of O2and it produces CH4, H2, CO, and impurity compound such as H2S, CO2, and TAR. Chemical equation of gasification process can be written as:
Carbon monoxide, hydrogen, and methane are combustible gasses, whereas CO2 and H2O are incombustible gasses. Gasification produces CO, H2, CH4, CO2, and N2. Those gasses are commonly called as producer gas. Based on Alexis T. Benolio (2005), the composition of producer gas can be seen in table 2.1 Table 1 Producer gas composition
1. Landfill gasification: Methane gas is extracted in garbage dump.
2. Thermal process gasification: this gasification process use closed system reactor and limited O2.
3. Anaerobic gasification: Anaerobic gasification use bacteria to produce the gas by fermentation.
Moreover, Thermal process gasification can be defined as:
1. Thermal gasification based from flow direction:
a. Downdraft gasification: the gas and solid material flow down.
b. Updraft gasification: the solid material flows in the up direction and the gas is flow contrary.
B. Downdraft.
2. Thermal gasification based on the types of gas:
a. Air gasification: Air is used to initiate gasification process.
b. Steam gasification: Gasification uses steam as the fuel in the process
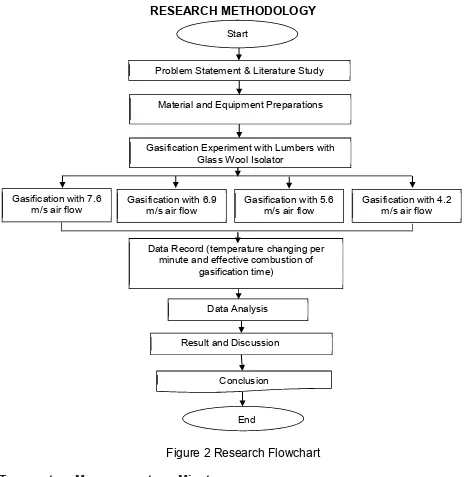
RESEARCH METHODOLOGY
Figure 2 Research Flowchart
Temperature Measurement per Minute
Figure 9 Thermocouple position for temperature changing measurement per minute
Gasification with 6.9 m/s air flow
Start
Material and Equipment Preparations Problem Statement & Literature Study
Gasification Experiment with Lumbers with Glass Wool Isolator
Gasification with 7.6 m/s air flow
Gasification with 5.6 m/s air flow
Gasification with 4.2 m/s air flow
Result and Discussion
Conclusion
End Data Analysis
Data Record (temperature changing per minute and effective combustion of
gasification time)
Result and Discussion
Coping Wood Experiment with 7.6 m/s Air Velocity
Figure 1 Correlation between time and combustion temperature at v=7.6 m/s
In Graphic 1 there is a trend of increasing temperature after gasification process was started. The maximum temperature is gained at minute 6 with 5710C. Thereupon after minute 6 until minute 8, the temperature is starting decreasing bitingly and it is going to be more stable until minute 10. Temperature slightly decreasing until the gasification process has been done at minute 13. Further analysis showed that the combustion temperature has a high increment because there is a high velocity of air. It boosts the combustion process fastly which makes the process has an extreme trend.
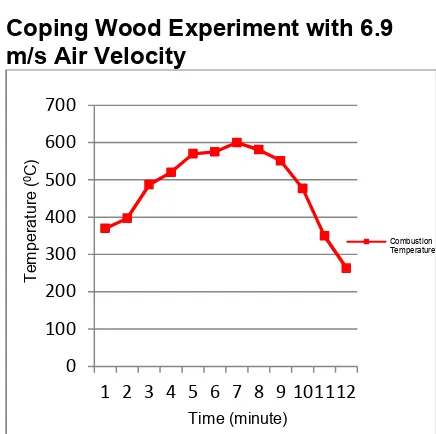
Coping Wood Experiment with 6.9 m/s Air Velocity
Figure 2 Correlation between time and combustion temperature at v=6.9 m/s
From the data in Graphic 4.2, it is apparent by using 6.9 m/s air velocity the combustion temperature has smooth temperature changing start from the gasification get started until it is finished. The maximum temperature has been recorded at minute 7 with 6000C. After that, the temperature of gasification was dying down because the coping wood was starting tapper off. The lowest temperature at this experiment is happened at minute 12. In the other word, the effective combustion was about to be done after minute 12. By the result, it indicates the gasification has enough air supply and it possess gasification become more stable. Moreover, it is an interesting to note that the temperature will be dropped extremely after the fuel is only a few because the combustion of gasification become out of trim.
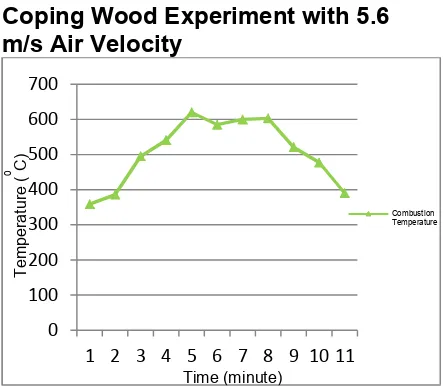
Coping Wood Experiment with 5.6 m/s Air Velocity
Figure 3 Correlation between time and combustion temperature at v=5.6 m/s
As can be seen from the graphic above, there is up and down trend of temperature changing at the top trend of graphic. Temperature starts increasing sharply after minute 2 then the gasification gains the maximum temperature at minute 5 with 6200C. It happened because the coping wood was already burned completely. The gasification process runs well while the fuel is burned perfectly and the high temperature can be gained. After minute 5, the temperature is oscillating until it gains the lowest temperature at minute 11 with 3900C. The curve goes down ploddingly because the combustion inside the reactor is not extremely fast by the air flow velocity. This finding proves that gasification needs enough air supply to runs the process and 5.6 m/s air supply is good enough to fulfil the needs of air in gasification process. Furthermore, the air flow velocity has a big impact toward temperature movement which posses the trend.
Coping Wood Experiment with 4.2 m/s Air Velocity
Figure 4 Correlation between time and combustion temperature at v=4.2 m/s
The graphic above illustrates the trend of temperature toward time of gasification. Temperature movement shows horseshoe trend. At minute 1 until minute 3, there is no significant increase of temperature. Nevertheless, start from minute 3, there is 1440 increment of gasification temperature from 3970C rise up until 5410C. Maximum gasification temperature gains at minute 7 with 6090C and then the temperature decreases ploddingly. The lowest temperature records on 3900C at minute 11. Surprisingly, the temperature was coming high at minute 12. A possible explanation from this phenomenon was instantaneous combustion from the residual gas product of gasification. It might cause the upswing temperature just before the gasification process is over.
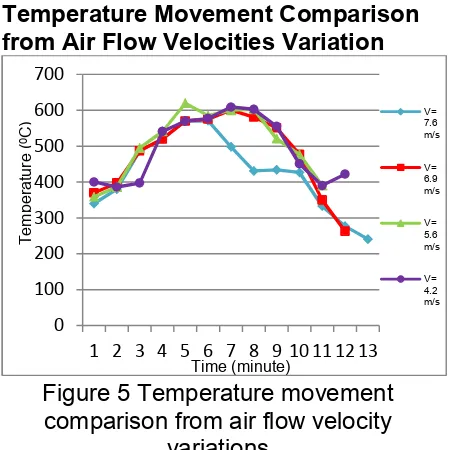
Temperature Movement Comparison from Air Flow Velocities Variation
Figure 5 Temperature movement comparison from air flow velocity
variations
Based from this graphic, there is a comparison between data in graphic 4.1, 4.2, 4.3, and 4.4. The highest temperature recorded at point 5 in the third experiments with 6200C. The lowest temperature is 2400C at the first experiment. Based on the maximum temperature, the best air flow velocity for coping saw gasification is 5.6 m/s causes it can reach the highest temperature more than another experiments. Strong evidence was found that the ideal air flow velocity has a big influence to gain the highest temperature. The highest temperature only can be reached in the process which has ideal air flow velocity. The ideal air flow is not always the fastest air flow velocity but it must be appropriate to the gasification needs.
Figure 6 Comparison Tiand Tt between those various air flow velocities
From the graph above, we can see that longest result of Tt(effective combustion time) is the first experiment which it uses 7.6 m/s air flow velocity. On the other hand, the third experiment has the shortest effective combustion time with 698 s. Moreover, Ti (ignition time) of the first experiment has the longest starting ignition time with 155 seconds and the third experiment has the fastest ignition time. The results of this study indicate that there is a positive correlation between air flow velocity and effective combustion time. Effective combustion time will be faster while the air flow velocity rises up. One unanticipated finding was that the 4.2 m/s air flow has much longer effective combustion time than 5.6 m/s and 6.9 air flow.
Conclusions
Based on analyzis of data result, there are some evidences about correlation between air flow velocities with combustion temperature on coping wood gasification, such as:
a. The highest temperature is not depends on the fastest air flow velocity. It needs the ideal air flow velocity to gain the highest temperature. It can be shown that the highest temperature
was gained at 6200C with v=5.6 m/s air flow velocity.
b. The longest gasification process is 780 s at v=7.6 m/s. Whereas, the fastest gasification process happened at v=5.6 m/s with 698 s. This study did not find a significant difference between those air flow variations, so there is no big influence between gasification time and air flow velocity.
Suggestions
After all of the research has been done, these findings suggest several courses of action in future studies:
a. Use only a homogeny isolate the air flow.
c. Do the experiment in indoor, so the is less wind to make an influece to the data record.
d. Mix the coping wood with another material which can add another benefit such as longer combustion process or higher temperature of gasification.
e. Use another isolator material which can reduce heat loss better than glasswool.
REFERENCES
[DEPHUT] Forestry Department, 1990, Research and Forestry Product Department, Annual Report, Bogor.
Eddy and Budi, 2000, Basic Combustion Engineering and Fuel, Mechanical Engineering, Industrial Technology Faculty , ITS, Surabaya.
Higman, C and van der Burgt, M, Gasification , USA.
Nugraha, 2010, Recycle Organic Compost by using Anaerobic Gasification Technology , South Sumatra University, Medan. P. S. Pathak, T. A. Khan, P. Sharma,
Biomass production, its
utilization and surplus for energy generation in India , SPRERI, VV Nagar, India.
Reed, TB and Larson, R A wood-gas stove for developing countries , Banff, Canada.
Subroto, 2007, Temperature
Distribution of Gasification from some Biomass Sample (husk, bagasse, and cob) using Husk Gasification Furnace ,
Muhammadiyah University of Surakarta, Surakarta.
Tasliman, 2008, Biomass Gasification Technology , accessed from http://tungkubiomas.blogspot.co.i d.
The Asian Biomass Handbook, 2008, A Guide for Biomass Production and Utilization , The Japan Institute of Energy, Japan. Wikipedia, 2008, Gasification ,
accessed from