INNOVATIV AIRBORNE SENSORS FOR DISASTER MANAGEMENT
M.O. Altan a*, G.Kemper b
a
ITU-Istanbul /Turkey - [email protected] b
GGS GmbH, Speyer / Germany – [email protected]
Commission VIII, WG WG VIII/1
KEY WORDS: Multi Sensor, Thermal, Disaster Management
ABSTRACT:
Modern Disaster Management Systems are based on 3 columns, crisis preparedness, early warning and the final crisis management. In all parts, special data are needed in order to analyze existing structures, assist in the early warning system and in the updating after a disaster happens to assist the crises management organizations. How can new and innovative sensors assist in these tasks?
Aerial images have been frequently used in the past for generating spatial data, however in urban structures not all information can be extracted easily. Modern Oblique camera systems already assist in the evaluation of building structures to define rescue paths, analyze building structures and give also information of the stability of the urban fabric. For this application there is no need of a high geometric accurate sensor, also SLC Camera based Oblique Camera system as the OI X5, which uses Nikon Cameras, do a proper job. Such a camera also delivers worth full information after a Disaster happens to validate the degree of deformation in order to estimate stability and usability for the population.
Thermal data in combination with RGB give further information of the building structure, damages and potential water intrusion. Under development is an oblique thermal sensor with 9 heads which enables nadir and oblique thermal data acquisition. Beside the application for searching people, thermal anomalies can be created out of humidity in constructions (transpiration effects), damaged power lines, burning gas tubes and many other dangerous facts.
A big task is in the data analysis which should be made automatically and fast. This requires a good initial orientation and a proper relative adjustment of the single sensors. Like that, many modern software tools enable a rapid data extraction. Automated analysis of the data before and after a disaster can highlight areas of significant changes. Detecting anomalies are the way to get the focus on the prior area.
Also Lidar supports Disaster management by analyzing changes in the DSM before and after the “event”. Advantage of Lidar is that beside rain and clouds, no other weather conditions limit their use. As an active sensor, missions in the nighttime are possible.
The new mid-format cameras that make use CMOS sensors (e.g. Phase One IXU1000) can capture data also under poor and difficult light conditions and might will be the first choice for remotely sensed data acquisition in aircrafts and UAVs.
UAVs will surely be more and more part of the disaster management on the detailed level. Today equipped with video live cams using RGB and Thermal IR, they assist in looking inside buildings and behind. Thus, they can continue with the aerial survey where airborne anomalies have been detected.
1.
INTRODUCTION
Disasters, either natural or man-made, happen more frequently and are often more intense due to the growth and densification of urban structures. Every year, many people either die or are injured by disasters, besides that a huge economic damage has to be handled. Big events like earthquakes and tsunamis do not necessarily cause a high-risk potential. Risk appears in places of human activity where nature is highly active and people e.g. build urban areas. This means that the risk for human live depends on the natural conditions in combination with the activities of the population and their society. There are many places on our
raised the risk level but also living and working in areas of high risk became a used fact.
Disasters can be based on climatic basis as there are storms, floods, arid periods, strong winters and others. Geological disasters are e.g. Earthquakes, Tsunamis, volcanic eruptions and rock falls and avalanches. In some cases we can be affected by biological disasters as direct epidemic or pandemic diseases or indirectly by plant diseases (forest dying), insect hyper population and others. We also have to take human made disasters into account as there are wars, economic crises, political and ethnological crises. Some of them affect each other and often accelerate the problems.
Modern technologies in combination with remotely sensed data in GIS environment open a wide field for assisting in Crisis Management. The most important component of any Crisis Management System is a Crisis Preparedness Plan where especially our disciplines of Photogrammetry, Remote Sensing and Spatial Information Science can contribute in many ways. Crisis Preparedness plays a key role in preventing the population against big disasters. All Crisis Management efforts need an interdisciplinary cooperation to receive a sustainable help for all citizens.
We have to be aware about possible disasters on our place and the neighbored environment. This awareness is the basis of any type of crisis preparedness. To be prepared means to have a clear knowledge about the geospatial structure, the mechanism of the disaster and scenarios to model and train disaster management plans. Geospatial data is one of the basic resources to e.g. detect the critical areas in case of a Tsunami, analyze areas that might be saver than others in case of an earthquake and to find most suitable places for camps with a prepared infrastructure for homeless people. There are many aspects in crises preparedness and each town, city, country or area hast to have beside basic data specific information to adjust the preparedness-plan to the regional needs. Remotely sensed data perfectly can assist in this part, nearly all type of sensors are useful to feed the database to generate a complex information basis.
Early warning as a second column of a crisis management system is very delicate task and in many cases makes use of special sensors that can give the relevant information to set up an alarm. E.g. satellite imagery already assists meteorologists to forecast hurricanes and other extreme weather phenomena. Satellite bases sensors also can monitor Tsunami waves and can help to set a tsunami warning more precisely. Environmental disasters e.g. oil spill, can be detected by hyper spectral sensors.
Rapid data capturing is required after a disaster had happened. To manage the crises, actual data are urgently needed to guide the rescue teams. All kind or remotely sensed data that have a rapid access are more than welcomed. This means that the data must be directly georeferenced in order to feed directly the data server of the crisis management teams. Direct referencing is a common task today and we have to use it for the benefit and health of our society.
Very common lessons learnt from the previous disasters has 3 main pillars; 1)
1. Build well to save life and property; a very good example in this context is the State of Chile who learned from previous earthquakes like they have had between21 May and 6 June 1960 starting with a magnitude of 8.1 Mw.
2. Invest in pre-disaster mitigation; Spending 5– 10% of the funds necessary for recovery after a disaster on mitigation saves lives and resources. 3. Be prepared; Emergency-management plans
should be practised long before a disaster occurs. Preparedness also entails warning systems, education, awareness raising and risk communication.
Linking disaster risk management to broader sustainable development goals can be achieved through pro-active and community based resilience efforts (Cutter 2014). However, this is only possible with the knowledge transfer generated through research and periodic assessments that are effectively communicated to society and governments. DRM decision-makers should be provided with evidences of economic, operational, and strategic benefits of using scientific knowledge and information, which address prevention, mitigation, and response actions (e.g., Altan et al., 2010, 2013).
1. SENSORS
1.1 Satellite images
In the past satellite images were mainly used to fill data-gaps in rural area, where aerial images were not available due to difficult areas or too expensive to get them aerial surveyed. But satellite images always had the advantage of multi spectral information (Landsat TM) to extract more complex information about the land use. In the last 15 years, the spatial resolution became better and with a GSD of 50 cm it can compete with aerial images. These data typically cover a big area and can be geometrically more easily processed (geo-referencing) than aerial images (AT and Ortho-rectification) can.
The radiometric resolution in many cases is higher or at least similar (RGB, NIR,) just the geometric resolution is worse. Also the 3D resolution is in most cases very poor. Nevertheless satellite images provide good information of the landscape and this often is the first input into a crisis preparedness plan. Land-use mapping is important to predefine sensitive structures in case of disasters.
After a disaster satellite images are one of the first data that are available for the management teams. We still remember the big Tsunami in 2004 where satellite images shown the situation with destroyed villages and the changes in the shore line.
Summarizing, satellite images provide data for crisis preparedness also in wider areas and can support a rapid update after a disaster took place. A use for early warning is very limited.
1.2 Radar and Hyperspectral Satellite data
Beside the optical satellite sensors, radar and hyper spectral sensors deliver data for specific use. Radar can penetrate clouds and can produce a sufficient terrain model. Typically terrain models generated from Lidar or aerial images have a higher density and better accuracy. Therefore, Radar data are not really used for a basic geodataset. However a frequently updated radar surveys are able to deliver small changes using interferometric analyses to highlight small changes in the DTM. These anomalies shows stress in the geological layers which indicates geological movements – might be an upcoming earthquake. Radar is a good early warning sensor to indicate geological shock waves. Also after a earthquake, Radar can highlight the changes in the terrain, a good information for the rescue teams.
Hyperspectral sensors have been developed for monitoring environmental and geological structures. Focused on this specific task, they can support a disaster management in all parts. Even the geometric resolution is not high, environmental disasters can be well monitored in order to provide early warning and disaster management.
As also satellite images are, they can be made accessible for the Disaster Management typically a day after capturing. However, the way of data preprocessing s more complex in order to get a first visible result for inspection.
1.3 Aerial nadir images
Aerial nadir images have been and are excellent data sources being frequently used in the past for generating spatial data. During the last 60 years aerial images have been the most dominant source for mapping and geodata management. Today’s digital medium and big format sensors have more less completely replaced the analogue technology and enable typically RGB and NIR in one flight and quick access for a rapid data update. While for the big format aerial cameras an aerial surveying aircraft is needed (about 150 kg sensor and equipment weight), the medium format mapping cameras can be used in UL aircrafts, Trikes and UAVs. This widens the range of use for aerial images due to an enhanced range of GSD (1-20 cm). Meanwhile for UAVs also SLR Cameras found their market to generate Orthophotos and aerial maps that have no need for highest accuracy.
Nadir aerial images show more details as satellite images do and the date for flight can be defined locally according to the expected quality of the data that have to be produced. That gives a higher flexibility, resolution and accuracy especially in the height. Big format digital mapping cameras have resolutions up to 250 MPix (upcoming is the DMC III with 375 MPix) that can cover wide area. Midformat cameras meanwhile also cover more than the old analog ones did, with 100 MPix they open the path for wide corridor mapping with a 3 Camera setup of 28.000 pixels cross. Besides that, mid-format mapping cameras have changeable lenses that make them more flexible.
Both type of cameras does an excellent job for preparedness mapping in 3D as well as monitoring the Disaster in order to assist the rescue teams. During the Sezuan earthquake 2008 in China, mid-format cameras mounted on a trike supported
the disaster management teams. Such a small and lightweight aircraft can start and land on a short grass-runway and can be transported in a small lorry or trailer.
The new midformat cameras that make use CMOS sensors (e.g. Phase One IXU1000) can capture data also under poor and difficult light conditions and might will be the first choice for remotely sensed data acquisition in aircrafts and UAVs. After a mission the images can be accessed immediately even there is just a core reference. Using direct referencing methods, the image data can be already overlaid in a GIS environment and build rapid access information.
1.4 Oblique images:
Oblique imaging became very popular within the last years even that way of capturing images was already used since many decades. Besides architectural oblique imaging, also for open mining and other special tasks oblique images were used for a long time. Since about 8 years, there was a higher request for such data, either for homeland-security issues or for internet applications as Bing, Virtual Earth, Google, city planning and others. With some exceptions, a core georeference to display the data on the approximate place over a map was sufficient. Besides that, the image quality and resolution of the cameras was low that time. The use of such data was in a specific segment only.
Today we can make use of cameras with medium format sensors that capture images with 50-100 MPIX. Not just the higher resolution, also the precise image geometry of such mapping cameras widened the range to use these data also for precise mapping and modeling. Cameras mounted between 30 and 50 degrees off nadir are typically named oblique.
The use of the today’s captured oblique images are in the field of precise 3D City models, to generate a high dense DSM with a extreme good high accuracy and a high redundancy of image data in order to texture the facades. Since 2 years, this generated a growing request for such setups.
Figure 1: Camera head based on 3 midformat cameras to generate nadir and 2 oblique views
There is also a certain need for such information after e.g. an earthquake in order to analyze the degree of damage on buildings. For this application there is no need of a high geometric accurate sensor, also SLC Camera based Oblique Camera system as the Aero OI N5, which uses Nikon Cameras, do a proper job. From these data, deformation analysis to estimate the remaining building stability can be produced.
Also these images can be accessed immediately even with a core reference. Using direct referencing methods, the nadir images data can be already overlaid in a GIS environment and build rapid access information. For the oblique images, special tools are required.
1.5 Thermal Cameras
Thermal cameras measure the emission of long wave infrared emissions which are linked to the surface temperature. Finally what we interpret are the anomalies in such data. Most common are the use of aerial thermal data for heat loss analysis and the determination of urban microclimate. It is used also for environmental monitoring of rivers and lakes/seas as well as an indication for water in soil or urban structures (Vasel et.al.2012). That way they can support a database with additional information about the environmental situation and the effect of urban structures.
In the monitoring in order to detect changes in the temperature, thermal cameras can be used as early warning sensors, e.g. in the warm up phases of a geological structure (volcanoes) or environmental disasters.
Beside the application for searching people, thermal anomalies can be created out of humidity in constructions
(transpiration effects), damaged power lines, burning gas tubes and many other dangerous facts. After a Disaster, Thermal images can help to identify people in the observed area. Thermal data in combination with RGB give further information of the building structure, damages and potential water intrusion. Even small cracks in a concrete can infilter water which itself reduces the thermal emission which is visible in a thermal sensor. Thermal data are complex to interpret but can give good additional information for the crisis mangers.
Better as just a nadir thermal camera is the survey of oblique thermal information. Under development is an oblique thermal sensor with 9 heads which enables nadir and oblique thermal data acquisition. That way, also facades and also a view inside the building is possible and widens the information.
A big advantage of a thermal sensor is the use in day and nighttime. This gives the possibility to fly e.g. during day in combination with RGB-NIR or hyperspectral and during nighttime in combination with Lidar.
Due to the small data volume of thermal images they can be accessed immediately after the flight or already down linked to a receiver. Using direct referencing methods, the thermal data can be part f the rapid access database.
1.6 Lidar
Lidar can generate a dense DSM and also DTM using last Pulse information and algorithms to remove artificial objects and vegetation. The height information is received by direct distance measurements and results in a very accurate and dense point cloud. This represents of the surface perfectly and builds an excellent data-source for the preparedness plan.
Dual frequency Lidar scanners can measure heights in water and can be used for bathymetry. This gives important information of the shoreline.
Lidar supports the disaster management by analyzing changes in the DSM before and after an “event” (Steinle et.al 1999). Advantage of Lidar is that beside rain and clouds, no other weather conditions limit their use. This enables aerial missions in nighttime also in combination with Thermal cameras.
After a mission the data can not directly be used, there is a certain level of preprocessing needed. Access can be roughly about one day after the flight.
As an upcoming innovation are lidar systems using RGB laser-beams that enable to generate point clouds that represent height and surface analysis. That way it becomes an image sensor that enable to capture also visible data in the night. Even not as an aerial image, it widens the surveying time-frame for capturing data dramatically.
2. PLATFORMS
are depended also on the weather conditions which. But they are always operational and are able to collect data when they are overflying the project area or rotate the sensor to that direction as long as the weather conditions are good. The resolutions is predefined, to achieve a higher GSD is not possible.
Aircrafts are a more flexible for selecting various sensors, resolution by the variation of flight altitude and flexible about the flight time. Nevertheless they need a certain infrastructure and have to be available together with equipment and crew for an aerial survey.
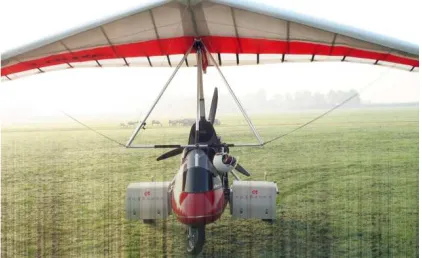
Figure 2. Microlighte-Trike as a platform for aerial surveying for monitoring earthquake disasters in China
Innovative platforms are UAVs for monitoring and mapping small areas. The advantages of such UAVs are that they can fly inside the urban canyons and might monitor the facades very detailed. Some of them are capable to fly inside a building and can assist in searching people. These UAVs can be transported to the project areas easily but you must have a certain access to these areas.
UAVs have a short endurance and are limited by their payload. But they can operate in areas which are not accessible by aircrafts or satellites and work that way complementary.
UAVs will surely be more and more part of the disaster management on the detailed level. Today equipped with video live cams using RGB and Thermal IR, they assist in looking inside buildings and behind. Thus, they can continue with the aerial survey where airborne anomalies have been detected.
2.
CONCLUSION
Today we have a good variation of sensors and carriers to support data-acquisition for Disaster Preparedness, Early Warning and Disaster Management. Some sensors can support better the preparedness while a few of them also can be used for an early warning assessment. The sensors became smaller and more powerful which widens the use of different carriers as UL Aircrafts or UAVs. We never have been so flexible in the way of capturing remotely sensed data beside that the data quality improved dramatically. The idea to join different sensors generates new strategies in analyzing the results. There is a big task in the data-fusion and Meta data management to be done on beforehand. Ones a proper Crisis Management System is established, all sensors nicely can assist to fill the database and cover remaining gaps. We
should make use of the technology to support our society in times of crises.
Figure 3. Tsunami Run-up simulation an area near Istanbul (Kemper et al., 2005) calculated by Land-use data (Kasanko
et al., 2000) and DTM by basic equations (Heitner, 1969)
2.1 References
Alpar, B., Gazioglu, C., Altinok, Y., Yücel, Z.Y., Dengiz, S., 2004. Tsunami hazard assessment in Istanbul using by high resolution satellite data (Ikonos) and DTM. In: The International Archives of the Photogrammetry, Remote Sensing and Spatial Information Sciences, Istanbul, Turkey, Vol. XXXV, Part B7.
Altan, O., Kemper, G., 2008. System Architecture for a Crisis Management System. In: The International Archives of the Photogrammetry, Remote Sensing and Spatial Information Sciences, Beijing, China, Vol. XXXVII, Part B4, pp. 1061-1071.
Altan, O., Kemper, 2010. Spatial Information for Disaster Management Using Examples for Istanbul. Geographic Information and Cartography for Risk and Crisis Management, LNG&C, Springer.
Cutter, S.R.. et al. 2015. Pool knowledge to stem losses from disaster. Nature, 522(7556), pp. 277-279.
Altan, O., Backhaus R., Boccardo, P., and Zlatanova S. (eds.), 2010. Geoinformation for Disaster and Risk Management: Examples and Best Practices. JB GIS and United Nations Office for Outer Space Affairs (UNOOSA).
Copenhagen, available at:
http://www.fig.net/jbgis/publications/jbgis_booklet_2010.pd (accessed on 06 April 2016).
Cutter, S. L. (2014). Building disaster resilience: steps toward sustainability. Challenges in Sustainability1(2), 72-79.
Kemper, G. Altan, O., 2009. System architecture for a crisis management system. In: Proceedings of the Joint Symposium of ICA Working Group on CEWaCW and JB GIS Gi4DM, Cartography and Geoinformatics for Early Warning and Emergency Management, Prague, Czech Republic.
and sensors for moistrure detection. In: The International Archives of the Photogrammetry, Remote Sensing and Spatial Information Sciences, Beijing, China, Vol. XXXVII, Part B8, pp. 17-22
Gerlach, F. , 2000. Characteristics of Space Imaging’s one-meter resolution satellite products. In: The International Archives of the Photogrammetry, Remote Sensing and Spatial Information Science, Amsterdam, The Netherlands, Vol. XXXIII, Part B1, pp.128-134.
Heitner, K. L., 1969. A mathematical Model for calculation of the Run-up of Tsunamis. California Institute of Technology. (unpublished), available at http://resolver.caltech.edu/CaltechEERL:1969.EERL.1969.0 01
Kasanko, M., Lavalle, C., Demicheli, L. McCormick, N., Niederhuber, M., 2000. The MOLAND method as a decision-making support tool in urban management. In:
Second International Conference on Decision making in Urban and Civil Engineering, Lyon, France.
Kemper, G. 2005. Tools of photogrammetry, Remote-Sensing and Geo-Information-Systems. In: The world between Developers and Endusers. Riyad, Saudi Arabia.
Kemper, G., Altan, O., Celikoyan, M., 2005. Tsunami-Gefährdungskarte für Istanbul. In: Angewandte Geographische Informationsverarbeitung, Vol XI, Wichmann, Heidelberg, Germany.
Lavalle, C., McCormick, N., Kasanko, M., Demicheli, L., Barredo, J. I., 2003. Monitoring and forecasting the dynamics of European urban areas - The territorial approach as key for urban development strategies. In: Urbanistica, 121, pp. 105-111.
Yildiz Technical University, 2000. International Mediterranean Project – Integration of Ground Truth & Spaceborne Sensor Data with a GIS for Coastal Zone Management of the Turkish Mediterranean Coasts. ESA demonstration Project final Report, MM.XXSF.
Kiremidjian, A.S., King, S. 1995. An integrated earthquake damage and loss methodology through GIS. In: VII International Conference on Soil Dynamics and Earthquake Engineering (SDEE 95), Boston, USA, p. 664.
Steinle, C., Bahr, H. P. 1999. Laserscanning for change detection for urban environments. In: Third Turkish – German Joint Geodetic Days “Towards A Digital Age”, Istanbul, Turkey, Vol I, pp. 147-156,
Tazir, T. Z. H., Gavarini, C. 1989. AMEDEUS, A KBS for the Assessment of Earthquake Damaged Buildings, Report of the IABSE Colloquium on Expert Systems in Civil Engineering, Bergamo, Italy, pp. 141-150.
Weindorf, T., Vogle, T., Bahr, H. P. 1999. An approach for the Detection of Damages in Buildings from Digital Aerial
Information. In: Vrancea Earthquakes: Tectonics, Hazard and Risk Mitigation, Bucharest, Rumania, pp. 341-348.