RGB-D Indoor Plane-based 3D-Modeling using Autonomous Robot
N. Mostofi a, *, A. Moussa a, M.Elhabiby b, N. El-Sheimy a
aDepartment of Geomatics Engineering, Schulich School of Engineering, University of Calgary, Canada b
Public Works Department, Ain Shams University, Cairo, Egypt (nmostofi)@ucalgary.ca
Commission VI, WG VI/4
KEY WORDS: RGB-D Sensor, RANSAC, ICP, Visual odometry
ABSTRACT:
3D model of indoor environments provide rich information that can facilitate the disambiguation of different places and increases the familiarization process to any indoor environment for the remote users. In this research work, we describe a system for visual odometry and 3D modeling using information from RGB-D sensor (Camera). The visual odometry method estimates the relative pose of the consecutive RGB-D frames through feature extraction and matching techniques. The pose estimated by visual odometry algorithm is then refined with iterative closest point (ICP) method. The switching technique between ICP and visual odometry in case of no visible features suppresses inconsistency in the final developed map. Finally, we add the loop closure to remove the deviation between first and last frames. In order to have a semantic meaning out of 3D models, the planar patches are segmented from RGB-D point clouds data using region growing technique followed by convex hull method to assign boundaries to the extracted patches. In order to build a final semantic 3D model, the segmented patches are merged using relative pose information obtained from the first step.
* Corresponding author.
1. INTRODUCTION
3D indoor mobile mapping is a vital task in robotics, with wide range of potential applications, such as search and rescue, hazardous material handling, collision-free navigation, surveying remote sites or dangerous areas (such as underground mines, tunnels, caves, or channels), as well as exploration and inspection of infrastructure to compare it with original design drawings and Building Information Modelling (BIM), (Cheol et al, 2007).
Collecting 3D point clouds data from range sensors is the prerequisite requirement to begin the process of mapping and building dense 3D reconstruction. However, relying only on the range data will lead to losing rich information contained in images. In the other hand, it is hard to extract dense depth information from camera alone, for indoor environments with very dark or sparsely textured areas.
With the advent of RGB-D cameras, capturing RGB images along with per-pixel depth data provides rich information for 3D mapping. The working principal of RGB-D cameras is based on stereo techniques. Since RGB-D cameras estimate the depth by illuminating a scene with a structure of light pattern, it is highly suitable to use it in area where poor visual texture exists. The Kinect RGB-D camera used in this research captures 640 × 480 registered image and depth points at 30 frames per second (See Figure 1 for an example of the data captured by the camera). RGB-D camera provides depth and colour information
for a small field of view (60 degree in horizontal view) and with precision in depth of ~3cm at 3m depth. Kinect can produce up to ~300,000 colour point clouds in every frame by integrating depth and colour data. Point clouds can be generated from 3D projection of each pixel using camera calibration parameter and depth image.
Several researchers have used RGB-D camera for generating consistent maps of large scale indoor environment. Complete map solution requires registration of multiple images.
The first step in the modelling is to obtain the relative pose between RGB-D frames using visual odometry technique. Visual odometry is defined as the problem of tracking the position and orientation (pose) of a robot purely and directly from vision sensors. In Achtelik et al. (2009) and Davison et al. (2007) stereovision and monocular cameras are used for visual odometry. Recently, many approaches have been used for visual odometry, one common method is feature-based tracking and matching across consecutive image frames. Fast odometry from vision (FOVIS) is used in Huang et al. (2011) for visual odometry method based on fast feature extraction across RGB image frames. Another approach used in Tykkala (2011) is based on aligning the point clouds data instead of aligning image frames using ICP method. Recently, Kerl (2013) proposed photo-consistency method for visual pose estimation. According to the photo-consistency method, the intensity and depth of the first RGB-D frame should be equal to the transform location of intensity and depth in the second RGB-D frame. Photo-consistency can be formulated as a least square process to minimize the back-projection error. However, it should be mentioned that, the solution of relative pose from this method directly affected by the speed of camera motion.
Others work on real-time approaches for visual odometry such as, Dense Tracking And Matching (DTAM) proposed by Newcombe et al. (2011). The pose accuracy in this method is increased by matching a current image frame against a scene model instead of matching against previous image frames. None of the previous methods address the problem of inconsistency in a map solution when not enough features exist in the surrounding environment.
Figure 1. (Left) RGB image and (right) depth information captured by an RGB-D camera. RGB-D cameras can capture images at a resolution of up to 640 × 480 pixels at 30 frames per second.
This research work address this problem by proposing a switching/integrated method between ICP and visual odometry and using the ICP alone.The method used in this paper for indoor mapping follows three main steps: alignment of consecutive frames using information from visual odometry followed by Iterative Closest Point (ICP), loop closure detection and segmentation process to extract the planar structure.
In this research work, to perform visual odometry process for RGB-D sensor, features are extracted from RGB images and matched via random sample consensus (RANSAC). Lucas– Kanade (Lucas and Kanade, 1981) method is used as the features extraction technique. The resulting information (translation and orientation) from first alignment stage is directly used for the initialization of ICP algorithm (Henry et al., 2010) to refine the alignments between frames.
The registrations of the point clouds consist of two parts where the result of the first part (visual odometery) is used for the initialization of the next part, which is the ICP algorithm to register the point clouds. The key advantage of this method is the switching technique between using both visual odometry and ICP, and using ICP alone in case where no enough visual features can be extracted from the surrounding environment. It should be noted that, the result of transformation in the first stage (visual odometery process) has unbounded pose drift. In order to limit this drift, we employ loop closure technique, which is a common technique in simultaneous localization and mapping (SLAM) algorithms for detecting revisited locations (Engelhard et al, 2011). Various techniques exist for loop closure. One very common technique is based on graph optimization algorithm namely Tree-based netwORk Optimizer (TORO) (Grisetti et al, 2007), General Framework for Graph Optimization (g2o) (Kuemmerle, 2011), and Parallel Tracking and Mapping (PTAM) (Klein 2007), which globally minimize the error in the alignment procedure by solving a nonlinear least squares problem.
In this work, loop closure is detected by calculating the relative pose between first and last frames and re-updates the relative pose of previous frames using information from loop closure. Using loop closure, we can align the point cloud globally and bound the drift of visual odometry. The final step is to do a segmentation to extract the planar patches from accumulated point clouds data. The segmentation is followed by convex hull detection to extract boundary and non-boundary points. This representation offers a more semantic representation to the point
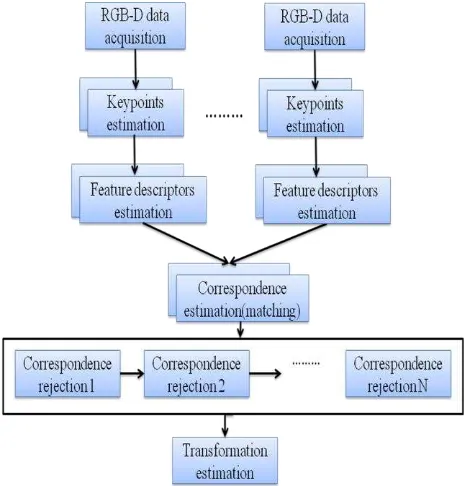
cloud data (Henry et al, 2013). The flowchart of the algorithm is illustrated in Figure 2.
Figure 2. 3D modelling using RGB-D sensor
2. RGB-D SCENE RECONSTRUCTION
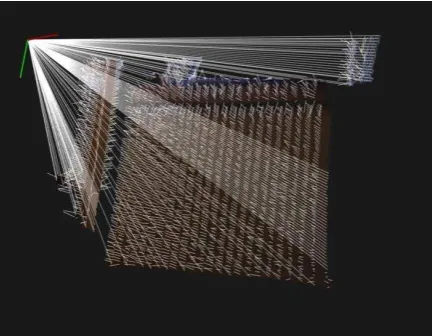
This section describes the alignment steps, which contain visual odometry step followed by the ICP algorithm. To estimate the relative transformation between two RGB-D frames, the relations between the camera captuered images are computed by matching the visual features. OpenCV (Bradski 2008) has been used for detection, description and matching part of the features. After matching the feature points of two frames, the transformation between these frames is computed using the minimum required set of matched features. It should be noted that the transformation is obtained between corresponding feature points in 3D space using depth information. Figure 3 illustrates the projection of 2D features in 3D space using depth information.
Figure 3. Left: the locations of features in the image. Right: the corresponding location of the 2D features in 3D space using depth information
A key advantage of pose estimation using visual features is that it can provide alignment without requiring initialization. The matching procedure is done after the feature extraction step with the aid of RANSAC for removing the outliers (Figure 4).
Figure 4.Visual odometry process
The transformation obtained from visual odometry is then fed into the ICP as an initial guess to enhance the registration of point clouds. The idea behind ICP is to find the transformation that minimizes the sum of squared spatial errorE R t( , ) between associated points whereR t are rotation and ,
translation. It is necessary for ICP algorithm to not only have good initialization parameter, but also have enough overlap between frames. Otherwise, it may converge at an incorrect local minimum. Hence, the role of visual odometry for ICP initialization is critical. Moreover, maximum distance and rotation threshold
d
max,
r
max are considered as an additionalconstrains to bound and weight (
w
i) the noise from visual odometry algorithm by replacing the current pose with the lastpose obtained from previous frame
R
pre,
t
pre. Algorithm 1 and 2, listed below, describes the pseudo code of visual odometry and ICP method.Algorithm 1: RGB-D visual odometry algorithm
1: For num=1 to size of frames do step 1:9 2:
i
p
Extract RGB feature -framei3:
1 i
p
Extract RGB feature -framei
1
4 Project the
1
,
ii
p p feature points in 3D space using depth information
5:
0 0
( ,
T R)
find transformation between 3D corresponding points1
,
i i p p 6: Initialize ICP with
0 0
(
R t, )
7:
( , )
R t
compute transformation from (ICP) 8: Accumulate point cloud using relative pose 9: Check for the loop closure10: Compute loop misclosure transformation
11: Update the global pose using misclosure transformation from loop closure
12: End
Algorithm 2: Iterative Closest Point (ICP)
Input : Two set of point clouds:
,
i i
A a B b and
Initial transformation
(
R t
0, )
0 from visual odometryOutput: The refine transformation
( , )
R t , that align two point cloudsA B,
1: while not converged do 2: For i
1
to N do3: If
(
R0,i
rmax) & &(
t0,i
dmax)
then4:
1
i
w
5: else
6:
0
i w
( , )
R t
(
R
pre,
t
pre)
7: end
8:
( , )
1
i i(
i)
22.1 Visual odometry using RANSAC
In this work, RANSAC is used to estimate the transformation between consecutive camera frames. In general, the use of RANSAC to optimize points cloud alignment involves the following steps: Select a sample set from cloud (minimum three pairs of feature points), next; use each sample set to compute the transformation, which maps one sample set onto the other. Score the estimated transformation by minimizing summing the square of the error between the closest points in the sets. Finally, repeat first three steps iteratively until the convergence criteria is met.
The input data to the algorithm is the corresponding 3D coordinate of the matched image points at times t and t
1
. The transformation using visual odometry is obtained by minimizing the sum of square error between the feature pointsapproximation is required to linearize the nonlinear function.
Equation (2) can be solved using least square, yielding
1 that have certain similarities. In this research work, the primary interests for segmentation are planar features including walls, ceiling, and doors. There are various existing methods that can be used to detect planar surface from points cloud data (A. Nurunnabi et al, 2012). This section briefly describes the used region growing technique, which aims to extract the planar regions in the point cloud data. The idea behind this algorithm is to start from a point and grow around neighbouring points segmentation process are homogeneous regions with respect to some similarity measures.
For boundary detection of different planar patches, convex hull (Jarvis, 1977) is used. Convex hull extraction can capture the rough shape of the point set and classify the points into two groups namely boundary points and non-boundary points. (Figure 10) shows the planar segmentation of RGB-D point cloud with convex hull boundary computed.
3.1 Calculation of surface normal
A common method to determine the normal to a point p on a i
surface is to use an approximation by fitting a plane to a set of neighbourhood points. Having
i
p , the normal to a surface can be computed by analyzing the Eigen vector of covariance matrix
cov(p ) normal vectors extracted from RGB-D frames.
Figure 5. Extracting normal vector
4. RESULT AND DISCUSSION
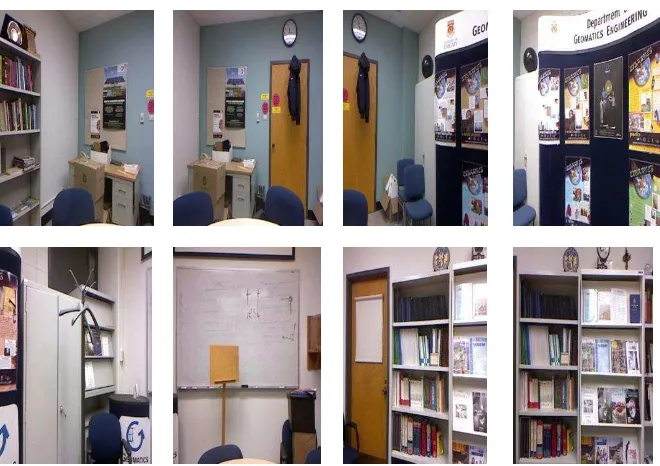
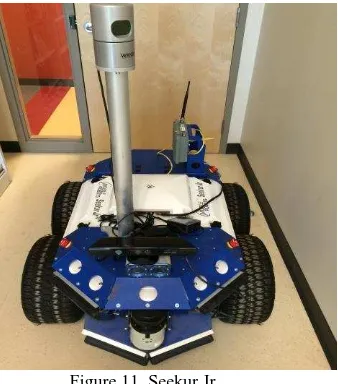
The performance of the RGB-D modelling algorithm has been evaluated by performing experiment inside a room with 360 degree rotation of RGB-D camera around the room and by capturing 590 frames (Figure 6). The experiments are done by placing the RGB-D camera on Seekur Jr (MobileRobot, 2014) (Figure 11) robot and autonomously capture the images. The Seekur Jr is equipped with an onboard microcontroller server, a
PC with SSD hard drive, DGPS, a laser range finder for obstacle avoidance, stereo camera and Velodyne HDL-32. The main software developed for the modelling consists of two main threads one handling the acquisition of the RGB-D data and the second handling the process of visual odometry, ICP and loop closure. Figure 7 shows the result of the modelling before the loop closure. It can be seen from the Figure 7 that the walls were deviated from the true pose because of the error in visual odometry caused by the error in features extraction and matching process.
In order to remove the error in the estimated pose, we added the loop closure where the relative pose between first and last frame was used as feedback to the algorithm and to update the global pose. Figure 8 shows the result after loop closure. The compensation error after loop closure is ~12 degree in yaw angle.
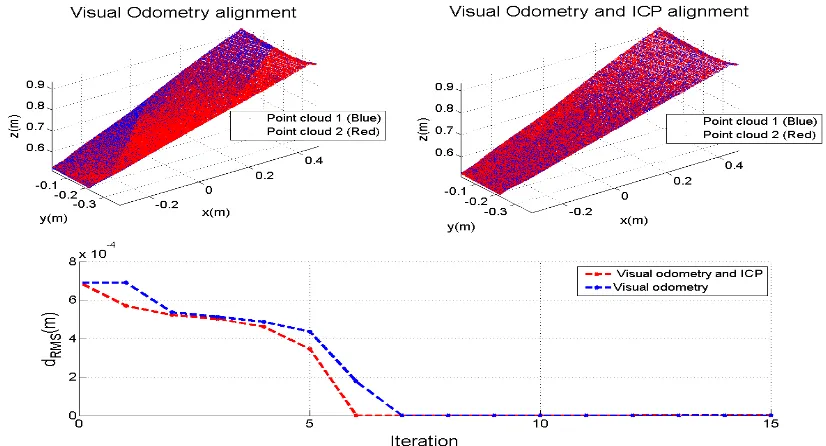
To analyze the performance of RGB-D visual odometry and ICP we compared the result of RMS error between two consecutive frames from visual odometry and visual odometry and ICP together. According to Figure 9 the RMS error and number of iteration for convergence of visual odometry and ICP is less than visual odometry alone. This fact is clearer in the final solution model Figure 7 and Figure 8 as the deviation of walls are removed and the point cloud are more aligned.
5. CONCLUSION
This paper presents a 3D indoor modelling approach using RGB-D sensor. The main idea of this work is to enhance the process of RGB-D point clouds registration by combining visual odometry and ICP methods. One of the faced problems during the test was the sensitivity of the visual odometry algorithm to the lack of features in the surrounding environment, which caused extract pose from visual odometry algorithm to deviate from true pose. This problem was solved using switching/integrated method between ICP and visual odometry and using the ICP alone. This approach allows the system to have consistent solution in short term when no enough features exist in the surrounding environment. To limit the error of visual odometry in the long run, we employ loop closure technique, which globally update the pose of the system and provide consistent solution. For future work we want enhance the final solution by adding a probabilistic filtering approach to the modelling algorithm.
6. ACKNOWLEDGMENTS
This work was supported in part by research funds from TECTERRA Commercialization and Research Centre, the Canada Research Chairs Program, and the Natural Science and Engineering Research Council of Canada (NSERC).
Figure 6. Images of the experiment room
Figure 7. 3D modelling before loop closure
Figure 8. 3D modelling after loop closure
Figure 9. The RMS error of visual odometry and ICP and visual odometery alone
Figure 10. Planar segmentation of Kinect point cloud using region growing technique
Seekur Jr Property Value Developer
Dimensions Weight Run time Speed Steering Tires Speciality
Mobile Robots inc 1050 x 840 x500 mm 77 kg
3-5 h 1.2 m/s 4 wheel skid 400 mm
50kg payload, IP54
Figure 11. Seekur Jr
REFERENCES
Achtelik, M., Bachrach, A., He, R., Prentice, S., & Roy, N. (2009, May). Stereo vision and laser odometry for autonomous helicopters in GPS-denied indoor environments. In SPIE Defense, Security, and Sensing (pp. 733219-733219). International Society for Optics and Photonics.
Bradski, G., & Kaehler, A. (2008). Learning OpenCV: Computer vision with the OpenCV library. " O'Reilly Media, Inc.".
Davison, A. J., Reid, I. D., Molton, N. D., & Stasse, O. (2007, June). MonoSLAM: Real-time single camera SLAM. Pattern Analysis and Machine Intelligence, IEEE Transactions on, 29(6), 1052-1067.
Engelhard, N., Endres, F., Hess, J., Sturm, J., & Burgard, W. (2011, April). Real-time 3D visual SLAM with a hand-held RGB-D camera. In Proc. of the RGB-D Workshop on 3D Perception in Robotics at the European Robotics Forum, Vasteras, Sweden (Vol. 180).
Grisetti, G., Stachniss, C., & Burgard, W. (2009). Nonlinear constraint network optimization for efficient map learning. Intelligent Transportation Systems, IEEE Transactions on, 10(3), 428-439.
Ham, N. H., Min, K. M., Kim, J. H., Lee, Y. S., & Kim, J. J. (2008, November). A study on application of bim (building information modeling) to pre-design in construction project. In Convergence and Hybrid Information Technology, 2008. ICCIT'08. Third International Conference on (Vol. 1, pp. 42-49). IEEE.
Huang, A. S., Bachrach, A., Henry, P., Krainin, M., Maturana, D., Fox, D., & Roy, N. (2011, August). Visual odometry and mapping for autonomous flight using an RGB-D camera. In International Symposium on Robotics Research (ISRR) (pp. 1-16).
Henry, P., Krainin, M., Herbst, E., Ren, X., & Fox, D. (2012, March). RGB-D mapping: Using Kinect-style depth cameras for dense 3D modeling of indoor environments. The International Journal of Robotics Research, 31(5), 647-663.
Henry, P., Fox, D., Bhowmik, A., & Mongia, R. (2013, June). Patch volumes: Segmentation-based consistent mapping with rgb-d cameras. In 3DTV-Conference, 2013 International Conference on (pp. 398-405). IEEE.
Jarvis, R. A. (1977, June). Computing the shape hull of points in the plane. In Proceedings of the IEEE Computing Society Conference on Pattern Recognition and Image Processing (pp. 231-241).
Klein, G., & Murray, D. (2007, November). Parallel tracking and mapping for small AR workspaces. In Mixed and Augmented Reality, 2007. ISMAR 2007. 6th IEEE and ACM International Symposium on (pp. 225-234). IEEE.
Kerl, C., Sturm, J., & Cremers, D. (2013, May). Robust odometry estimation for rgb-d cameras. In Robotics and Automation (ICRA), 2013 IEEE International Conference on (pp. 3748-3754). IEEE.
Kummerle, R., Grisetti, G., Strasdat, H., Konolige, K., & Burgard, W. (2011, May). g 2 o: A general framework for graph optimization. In Robotics and Automation (ICRA), 2011 IEEE International Conference on (pp. 3607-3613). IEEE.
Lucas, B. D., & Kanade, T. (1981, August). An iterative image registration technique with an application to stereo vision. In IJCAI (Vol. 81, pp. 674-679).
Robots.mobilerobots.com, (2014). MobileRobots Research and Academic Customer Support. [online] Available at: http://robots.mobilerobots.com/wiki/Main_Page [Accessed 16 Oct. 2014].
Newcombe, R. A., Davison, A. J., Izadi, S., Kohli, P., Hilliges, O., Shotton, J. & Fitzgibbon, A. (2011, October). KinectFusion: Real-time dense surface mapping and tracking. In Mixed and augmented reality (ISMAR), 2011 10th IEEE international symposium on (pp. 127-136). IEEE.
Newcombe, R. A., Lovegrove, S. J., & Davison, A. J. (2011, November). DTAM: Dense tracking and mapping in real-time. In Computer Vision (ICCV), 2011 IEEE Internationa l Conference on (pp. 2320-2327). IEEE.
Nurunnabi, A., Belton, D., & West, G. (2012, November). Robust segmentation for multiple planar surface extraction in laser scanning 3D point cloud data. In Pattern Recognition (ICPR), 2012 21st International Conference on (pp. 1367-1370). IEEE.
Tykkala, T., Audras, C., & Comport, A. I. (2011, November). Direct iterative closest point for real-time visual odometry. In Computer Vision Workshops (ICCV Workshops), 2011 IEEE International Conference on (pp. 2050-2056). IEEE.