INTEGRATING MULTI-SOURCE IMAGERY DATA IN A GIS SYSTEM
Qian Liu
Environmental System Research Institute (Esri) Redlands, CA, USA
KEY WORDS: Image registration, image integration, mosaic dataset, dynamic image processing, GIS
ABSTRACT:
More and more volumes of high quality imagery data are becoming available than ever and it brings a challenge to the industry on how to integrate data from multi-sources effectively and timely to extract information of improved accuracy for a widespread field of applications. Over the past decade, we have witnessed the advance of tightening integration of imagery data in a GIS system. Imagery data takes advantage of the geodatabase management architecture and enriches the GIS system. Empowered with intuitive user interface and advanced tools, ArcGIS provides a great platform for one-stop integration of multi-source, multi-resolution, and multi-temporal imagery data with pre-processing, managing, visualizing, analyzing and sharing functionalities. This paper will discuss some of the core imagery capabilities in ArcGIS including interactive and automatic data correction and registration, intelligent and versatile data models for data crawling, on-the-fly data processing, and data disseminating.
1. INTRODUCTION
Imagery data are everywhere now. They are no longer only pretty pictures as they used to be, they are valuable data sources for applications in a widespread of domains. Huge amount of imagery data that are made available everyday contains enormous useful information. The demand for quick and easy access to the information is increasing, especially for emergency applications where time is everything.
Imagery data captured from various sources possess different characteristics and may cause discrepancies among them when it comes to data fusion, in addition, considering the temporal aspect of imagery and data volumes, it complicates the situation even more. Integrating multi-source imagery data and other geospatial data requires a system that can handle large amount of different data efficiently and timely.
A GIS system is a platform that integrates hardware, software and data for capturing, managing, analyzing, visualizing all sorts of geographic information. Traditionally GIS is primarily focused on mapping vector data and managing tabular information, and imagery data are often left out or simply as a background. As imagery data are becoming more and more accessible we have seen a trend of integrating imagery data into a GIS system as a source of geospatial data. Imagery has become an integral part of GIS.
The benefit of this integration is two-fold, GIS enables quick access and visualization of imagery along with other geospatial data simultaneously, in the meantime imagery data can not only be used as background or base maps for mapping but also for spatial analysis with added value for better decision making.
Empowered with an intelligent data model of mosaic dataset for managing and disseminating imagery data, and powerful image processing functions, ArcGIS by Esri has become a comprehensive imagery system. Image collections scaled from small to massive can be managed with ease. Without touching the data source, imagery from virtually any sensor can be
quickly identified and valuable information are extracted. This maximizes the value of imagery by making it accessible to users and applications in a timely fashion and provides a one stop solution for data fusion.
2. INTEGRATING IMAGERY IN ARCGIS
ArcGIS is a complete system which provides a platform for managing, analyzing, visualizing and disseminating geospatial data. It provides a comprehensive system that integrates imagery into GIS workflows. The mosaic dataset data model is the solution to store and manage collections of imagery data of any size in a geodatabase, and provide fast and easy access to the data in raw form or as processed.
2.1 Geodatabase data model
One of the advantages of ArcGIS is its enterprise geodatabase management system for efficient data management. Geodatabase provides a framework for managing various types of data in addition to the power of an enterprise database in querying and cataloging. Mosaic dataset is a data model in Geodatabase for managing imagery data of any scale. It supports most existing imagery formats and imagery products which eliminates the need for data conversion. While taking advantage of the geodatabase’s capabilities for storing and retrieving attribute data, mosaic dataset also has built-in intelligence for handling large volumes of imagery data from various sources. The combination of imagery data and the attribute data can produce virtually unlimited possibilities of data products. Even though the source imagery data are more likely stored in multiple files or packages in different locations, a mosaic dataset can be accessed as a single dataset like a mosaicked view of the source.
A mosaic dataset consists of a series of related tables in the geodatabase and a catalog of imagery data which can reside on disk as files or in the geodatabase. References to the source imagery data are stored in the tables without any modification of the source data while metadata of the source imagery data are
International Archives of the Photogrammetry, Remote Sensing and Spatial Information Sciences,
stored in the tables as different fields. If any of the imagery data requires processing, the processing functions can be defined and stored within the tables along with the reference to the source. However the source data are not processed until they are accessed and the processing takes place on-the-fly at the level of detail as requested only Because of no pre-processing of the source data, a mosaic dataset can be quickly created and put into use right away. This approach reduces the time from data collection to data production tremendously. Since no data duplication is needed, it saves storage space as well.
2.2 Data Crawling
Mosaic dataset can identify most of existing imagery formats and imagery products from different data vendors, either raw or processed. Commercial satellite data vendors often distribute their sensor data in their proprietary formats. In order to support all types of sensor data, we generalized characteristics of various sensor data and implemented two important components, raster product and raster type. They are the key components for mosaic datasets to read and ingest required information from data while crawling.
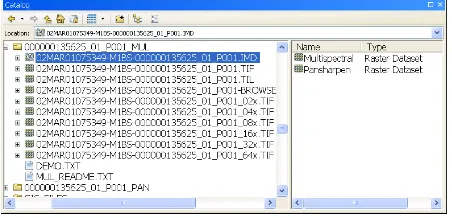
A raster product is a conceptual model for accessing single image scene that consists of imagery products of imagery files, metadata and other ancillary files. By using raster products, there is no need to know what specific processes are required to produce the scene from all member imagery files and metadata. As long as you know the product type, it just happens automatically. For example, when you access a QuickBird scene in ArcGIS, you will get two products, one single band panchromatic product and one multi-band multispectral product. How all the magic happens behind the scene is the implementation of raster types. Figure 1 shows the file structure of a QuickBird scene and raster products extracted from it by using QuickBird raster type.
Figure 1. QuickBird raster products
A raster type is a geodatabase object that specifies the properties and processes on a specific data type or source. It is the engine for mosaic dataset to properly ingest raster products. A raster type is normally coupled with a specific sensor data products or type except for the simple generic raster types. By utilizing raster types, mosaic dataset identifies metadata such as georeferencing, acquisition date, sensor type, sensor specific properties and processes, raster formats along with pixel data. Raster types can be as simple as for reading pixels only from pre-processed data without any processing capabilities, but they can be as sophisticated as well, especially for sensor data.
Currently ArcGIS supports most raster products from commercial satellite vendors such as IKONOS, LandSat, QuickBird, WorldView, and etc. Raster type provides an open
interface for extending the functionalities to handle any specific imagery products that are not currently supported. It is simple to create a custom raster type and add it to the collection of existing raster types. Once the custom raster type is implemented, you can use it to access the raster products from the specific data. As new satellites launch and data products are made available, we can work with vendors to create raster type for their products as well.
Aside from crawling well-known sensor data, mosaic dataset can also ingest collections of individual images either stored in file system or in geodatabase. Images can be added to mosaic data selectively by their attributes, data types, and formats. For example, an organization has already processed their imagery data collection to meet their needs and stored the processed data in TIFF format in a specific file folder and subfolders. To create a mosaic dataset with this collection, you simply browse to the top folder and specify the input format as TIFF with recursive option on, all TIFF files will be added to the mosaic dataset.
Mosaic datasets are designed to handle not only homogeneous data collections, but also heterogeneous collections. Data in a single mosaic dataset can contain data with varying resolutions in spatial, spectral and temporal domains. The member datasets in a mosaic dataset do not have to be aligned or overlapped.
2.3 Data Correction
Imagery data can be collected from scanned maps, aerial photos, and satellite images or aircrafts. Because of the nature of imagery data, distortions are inevitable. Geometric and radiometric distortions are common to most of imagery data collections. Even though some commercial data providers distribute their data products orthorectified, locational accuracy is still inadequate and there is room to improve.
2.3.1 Geometric Correction: Geometric correction is accomplished with georeferencing tools in ArcGIS to align imagery data to well-known ground locations and transform the data to correct geographical location.
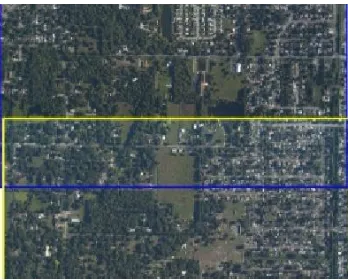
When georeferencing imagery data, depending on the availability of ground control points, you can either use graphic user interface to create links between distorted images to other georeferenced data with accurate location information or use geoprocessing tools to create transformation. Using existing georeferenced data source such as raster data or vector data involves collecting enough matching points that are distributed evenly across the whole geographic extent. Common types of features are good candidates for control points such as road intersection, corner of building, or boundary of fields. Figure 2 shows an example of control points(green cross) on a road intersection placed on the target vector data and its matching point(yellow cross) on the image.
International Archives of the Photogrammetry, Remote Sensing and Spatial Information Sciences,
Figure 2. Georeferecing with control points
Sometimes the source data and target georeferenced data are similar in nature and are in close proximity geographically. For these cases, auto registration can be used to eliminate control points selection process, instead, control points are generated automatically by matching spectral signatures between the source and the target. No matter how the control points are generated, they will be used to compute the transformation to apply to source data to fit to the target georeferenced data.
Transformation is a mathematical formula calculated from control points to fit imagery data to the target space. It can as simple as shift, scale or rotate, it can also be as complicated as high order polynomial transformation. Depends on the number of control points, you have the option to choose from different transformation models: polynomial, adjust, spline, and projective. As which one to choose to best fit your data, you need experiment, compare and decide.
The polynomial transformation uses least-square fitting(LSF) algorithm to generate the formulas, one for computing x coordinate and one for computing y coordinate for an input location (x, y). It favors global accuracy over local accuracy to derive a general formula that can be applied to all points. Image data can be transformed with polynomial transformation with orders from zero to third order. Zero order transformation is normally used to shift data; first order is used to shift, scale, and rotate. Higher order polynomial transformations require more non-correlated control points to fit more complex cases.
The spline transformation uses rubber sheeting fitting method to fit control points exactly from source to target, and in the meantime the continuity and smoothness between adjacent polynomials are maintained. It favors local accuracy over global accuracy. As a result points with distance to control points may not be as accurate.
The adjust transformation combines a polynomial transformation and triangulated irregular network (TIN) interpolation. The polynomial transformation is performed globally and local control points are adjusted using TIN interpolation. In return both global and local accuracy are achieved.
The projective transformation favors straight line features and tries to keep them straight after transformation. It is useful for oblique imagery data.
Transformations calculated from control points or auto registration can either be stored along with the imagery data as a property and be applied when accessed or persisted with the data by creating new data with transformation applied.
2.3.2 Radiometric Correction: Radiometric distortions can be corrected by adjusting the digital values of each pixels to make the whole dataset collection look continuous without abrupt boundaries between tiles. Image enhancement or stretching is one way to bring all images in a collection to a seamless appearance, and there are many image enhancement algorithm in existence for this purpose. However there are cases image enhancement only may not be enough to achieve the goal. Color correction in ArcGIS helps in rendering individual images in a collection to match each other and make a single seamless display by adjusting colors of each pixels.
There are two ways to conduct color correction for collections of imagery data in ArcGIS: color balancing and color matching.
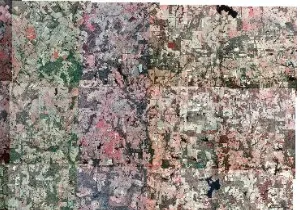
Color balancing is the process to change each pixel value to match a target color surface. Dodging balancing uses traditional photogrammetric dodging algorithm to change each pixel value to target color derived from target color surface. Depends on the size and variations in the source data, there are five target color surface to choose from, single color, color grid, first order surface, second order surface and third color surface. Target color surface can either be generated from the source data or derived from a target dataset. Other balancing methods change pixel values according to the statistics distributions of the target data source, for example histogram balancing and standard derivation balancing. Figure 3. shows the mosaic dataset with images of different color tones and Figure 4. shows the same mosaic dataset after applying color balancing.
Figure 3. Images before color balancing
Figure 4. Images after color balancing
When the images in an image collection overlap with adjacent images, color matching technique can be deployed. Color matching simply uses the overlapping pixels to compute color transformations from source image to target image. The
International Archives of the Photogrammetry, Remote Sensing and Spatial Information Sciences,
computation uses one of the three matching options: histogram matching, statistics matching and linear correlation. Once the transformation formula is calculated, all pixels in the source image will be transformed to match the target. Figure 5. shows the source data before color matching and Figure 6. shows the same data after color matching. The top data is to be matched to the bottom image which is the reference data.
Figure 5. Images before color matching
Figure 6. Images after color matching
2.4 Processing On-the-fly
Mosaic dataset does not move or alter source data collections, it stores references to the source data instead. The versatility of the mosaic dataset model allows multiple output presentations or products from a single source of data by applying image processes on-the-fly. The image processes are stored along with the source image data, either with individual images, a selection of images, or the whole collection of all images. The processes only get executed when the data are accessed, no intermediate data are saved. The image processes are generalized as raster functions.
A raster function is a geodatabase object that defines an image process algorithm and its arguments. For example, a pansharpening function contains information on input data sources for both pan image and multi-spectral image, the parameters (band weights, pansharpening method) and the algorithm to perform the process. An image can have more than one raster functions associated with it. Multiple raster functions are chained to form a raster function template which behaves like a single raster function with its input and arguments, but may contain multiple processes.
ArcGIS supports many image processes as raster functions including image enhancement, geometric transformation, image algebra. If certain image process is not available, a custom raster function can be implemented.
Sometimes raster functions are part of a raster type, when the image data are added to a mosaic dataset with that raster type, its raster functions are tied to the data, and will be applied when the data is retrieved. Upon request, data are only processed within requested extent at requested resolution.
As processing engine for mosaic dataset, raster functions makes dynamic image processing possible. No intermediate data creation reduces storage spaces and saves time.
2.5 Data Access And Visualization
Mosaic dataset manages collections of imagery data without modifying the source data and the data can be retrieved at various levels. The collections can be accessed as a whole, as subsets, or as individual images. Furthermore, Geodatabase provides an efficient mechanism for both attribute and spatial queries to access only images as requested. In addition, the build-in intelligence of a mosaic dataset enables data access based on spatial resolutions.
With the rich functionalities of a mosaic dataset, there are unlimited ways to utilize the imagery collections for different applications. For example, a state has a centralized location for all imagery data in the forms of aerial photos, elevation data, sensor data, and lidar data that are collected at different periods of time at different resolutions. One way to manage all the collections is to create a master mosaic dataset which contains all the collections and generate views of different products using queries, one view may be for elevation data, and another view may be for sensor data. The other way to organize the collocations is to create a few mosaic datasets of different data type, one for elevation data, one for panchromatic data, one for multispectral data, and etc. The benefit of multiple mosaic dataset is that it is easy to manage, and when there is a need to access multiple mosaic datasets as one dataset, you can combine them to generate one large mosaic.
Even with one single mosaic dataset, you can still get multiple products from it, a mosaic dataset with elevation data can generate a hillshade, a slope, and an aspect output using corresponding raster functions. There is no need to store the processed data, all processes are performed on-the-fly and data are generated dynamically.
A mosaic dataset can be viewed as a seamless mosaic with all or a subset of its member images. In most cases, a mosaic dataset stores overviews or reduced resolution data along with the full resolution source data. The viewing device resolution decides the level of details and only the data within that resolution range are fed to the display. If any raster function is associated, it will perform the operation on that specific resolution, not necessarily the full resolution.
2.6 Data Dissemination
Data collections can be shared at two levels, management level and use level. At management level, you have full access to the mosaic dataset and the sources, therefore you can add new data, modify existing data, or add raster functions. At use level, no modification can be made to the mosaic dataset or the source
International Archives of the Photogrammetry, Remote Sensing and Spatial Information Sciences,
data, however you can attach any image processes or raster functions to be operated on the source data to obtain specific products. This is normally configured by creating image service using ArcGIS Server through the web. A good example is the
world elevation service
(http://resources.arcgis.com/content/imagery/10.0/world_elevati
on) which is comprised of the best available public elevation data and provides application-oriented image services for online access.
3. CONCLUSION
ArcGIS system is a platform for managing large collections of imagery data. The mosaic dataset model creates a new paradigm for exploring, organizing, processing and sharing multi-source, multi-resolution, and multi-temporal imagery data in a GIS system. Raster types and raster products enable recognition of various data sources and types and extraction of useful metadata information to maximize the use of the data. User friendly interface for geometric and radiometric corrections makes data more accurate and ready to fuse with each other. Powered by raster functions, image processing operations are performed on-the-fly to produce a seamless mosaic to be used in analysis and visualization. All the sources and derived products can be accessed as data or services through the web. The imagery capabilities in ArcGIS makes it possible to discover, manage, and share large collections of imagery data effectively and timely with no intermediate processing and storages. The integration of imagery data in a GIS system is the future for one-stop imagery data management and data fusion.
4. ACKNOLEDGEMENT
I would like to thank Raster Team led by Peng Gao at Esri for their brilliant work to make these great imagery products and Peng Gao and Xiuguang Zhou for their support on this paper.
International Archives of the Photogrammetry, Remote Sensing and Spatial Information Sciences,