THE USE OF MOBILE LASER SCANNING DATA AND UNMANNED AERIAL
VEHICLE IMAGES FOR 3D MODEL RECONSTRUCTION
L. Zhu, A. Jaakkola, J. Hyyppä
Finnish Geodetic Institute, P.O. Box 15, FI-02431 Masala, Finland [email protected], [email protected], [email protected]
KEY WORDS: Mobile laser scanning, UAV images, Building wall detection, Building roof extraction, Pole extraction, 3D models, 3D building reconstruction
ABSTRACT:
The increasing availability in multiple data sources acquired by different sensor platforms has provided the great advantages for desired result achievement. This paper proposes the use of both mobile laser scanning (MLS) data and Unmanned Aerial Vehicle (UAV) images for 3D model reconstruction. Due to no available exterior orientation parameters for UAV images, the first task is to georeference these images to 3D points. In order to fast and accurate acquire 3D points which are also easy to be found the corresponding locations on UAV images, automated pole extraction from MLS was developed. After georeferencing UAV images, building roofs are acquired from those images and building walls are extracted from MLS data. The roofs and the walls are combined to achieve the complete building models.
1. INTRODUCTION
As the sensor technology development, multiple data sources acquired by different sensor platforms and different views have provided the great advantages for desired result achievement. For example, the use of both unmanned aerial vehicle (UAV) data and mobile laser scanning (MLS) data offers complete and detailed information for a 3D scene due to their complementary natures.
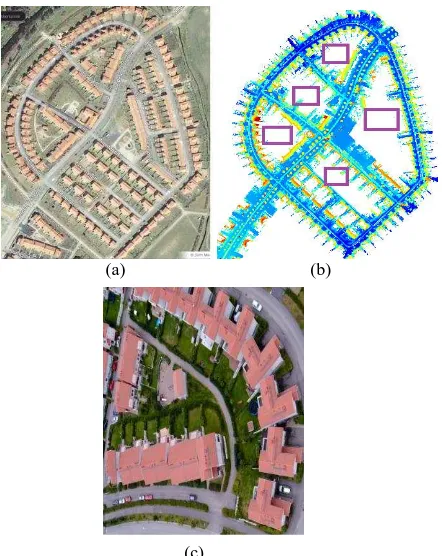
MLS has been commercialized for almost ten years. The advantages of MLS lie in its rapid, accurate and high resolution 3D data acquisition, especially for road environment modeling. For detailed building modeling from MLS, one of the challenges is the data completeness. For example, when a MLS moves along the street, only the building facades close to the street can be acquired, whereas the sides or backwards of the buildings are missing from the laser point cloud. One solution might be that the car with a MLS must drive around the buildings so that all building facades can be achieved. However, in practical, the difficulty rises when a car is not accessible to the scene e.g. small paths or some private yards (Figure 1(b)). Therefore, those cases would result in data incompleteness of a scene. However, the use of UAV offers an alternative complementary for the disadvantages of MLS. Current low cost UAV is widely utilized for survey field. The main reasons are: i) The survey cost consideration; ii) The safety factor: due to without pilot, it is convenient to collect data in disaster areas e.g. flood, earthquake and tsunami; iii) Low altitude data acquisition which fills the gap between high altitude flight view and close range ground based view; iv) its capability of data acquisition to the place which MLS cannot reach. Data fusion of MLS and UAV images can generate high resolution complete 3D models for both fly-through and walk-through views. Figure
1 illustrates different datasets from both of aerial view and ground-based view. Figure 1(a) is aerial image from Sundsburg, Kirkkonummi, Finland. Figure 1(b) shows MLS point cloud. Figure 1(c) gives an impression of UAV image.
(a) (b)
(c)
Figure 1. (a) The aerial view of a scene (from Google maps); (b) MLS data; (c) UAV image. The purple box in (b) shows the incomplete MLS data from the data acquisition.
Although current technology has offered the acquisition of position and poses of UAV system, low quality IMU or the weak GPS/ IMU signal quality and also the instability of platforms (e.g. vertical movement in UAV) results in the inaccuracy and inconsistent of data acquisition. Additionally in many cases, UAV system (e.g. camera-based or laser scanning based) is not synchronized with navigation systems: GPS/ IMU. This case usually happens in some in-house self-developed systems. When UAV images without any image exterior orientation information, the application of the images becomes difficulty, because most commercial software for data processing of UAV images require image orientation parameters (e.g. camera calibration, camera position and pose). In order to make images useful, it is fairly necessary to establish the corresponding relationship between 2D images and 3D scene, which is also called image orientation.
space. That is the relationship between 2D and 3D. Current automation level in relative orientation is high. Full automation can be achieved. However, absolute orientation is still low. Related research to image orientation methods can be found from Gruen (1985), Baumberg (2000), Zitová & Flusser (2003), Georgescu & Meer (2004), Lowe (2004), Goshtasby(2005),
Remondino & Ressl (2006), Barazzetti et. al (2009). Among these, Zitová & Flusser gave a review of image registration methods. The reviewed methods were classified according to four basic steps of image registration procedure: feature detection, feature matching, mapping function design, and image transformation and resampling (Zitová & Flusser, 2003). Latest research e.g. Barazzetti (2009) proposed automatic tie points extraction by exploiting operators like SIFT and SURF, which are invariant with respect to scale variations and rotations. However, the proposed methods showed their automation level only for relative orientation stage. Automation level for absolute orientation is still low.
After image orientation, images become useful for various 3D applications. Current especially highlight application is 3D city model. Single data source for 3D model reconstruction requires special configuration in data acquisition. For example, images were taken in a high overlap level: 80%, both in side overlaps and forward overlaps. Well known C3 technologies could full automatically generate 3D models from images. But there were very strict requirement in number of cameras, positions and angles of cameras. So far, 3D models from laser points provide an alternative solution. However single data source from laser scanning is still a challenge work for automatic 3D models. Complete and accurate model generation still needs existing software as assist. Multiple data sources could improve not only the accuracy and details of the models, but also in automation level.
This paper presents the use of MLS and UAV images for 3D model reconstruction. The UAV images are referenced to each other to form an image block and then 3D poles which are extracted from MLS are utilized as control points. The accuracy of the georeferencing UAV images will be presented and analyzed. After UAV images are georeferenced, building roofs can be acquired from the images. Building walls from MLS and roofs from images are combined to create the complete building models. This paper is organized as follows: section 2 introduced the work flow and the detailed methods; in the following section, the results about georeferencing UAV images to MLS and 3D model reconstruction will be presented. In addition, the analysis of the georeference accuracy will be covered in the same section. In the last section, conclusions and future work will be described.
2.
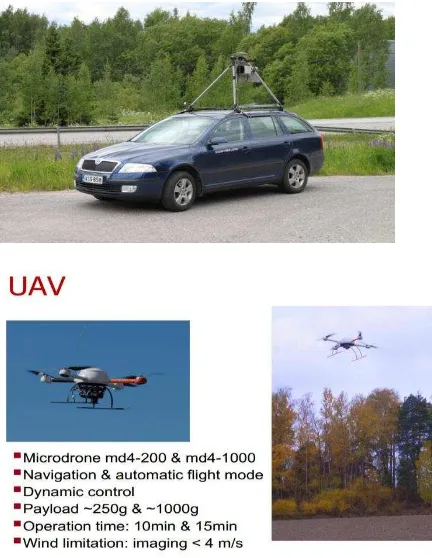
METHODSFigure 2. Sensors. UP: FGI Sensei mobile laser scanning system: consists of Ibeo Lux scanner, GPS, and INS, with a scanning speed of 38,000 Points/ second and with ranging accuracy of 10 cm as well as angular resolution of 0.25°. Right: FGI UAV imaging-based system (from T. Rosnell).
2.1 Data acquisition
The data sources include MLS data from Finnish Geodetic Institute (FGI) Sensei mobile laser scanning system and UAV images from FGI camera-based UAV system (Figure. 2). FGI Sensei consists of a laser scanner mounted on a car and integrated with GPS and IMU. The detail information about FGI Sensei MLS system can be found from Jaakkola et. al (2010). FGI camera-based UAV system consists of a quadrocopter type Microdrone md4-200 UAV and a Ricoh GR Digital II low-cost RGB compact camera. It can be operated in the flying height of 1~100 m with various flying speeds.
The test data are collected in Sundsburg, Kirkkonummi, Finland. This area covers dense buildings and some sparse middle-height (e.g. 4 or 5 m) trees along the roads. There are some yards which are not accessible for FGI Sensei due to narrow paths (Figure 1). Camera on UAV was setting in different views for different flight strips. The fly height is around 40 m above the ground. The time of the operation of UAV was in the beginning of August while FGI Sensei worked for it at the end of June. The weather was clear and no disturbance from sunlights. Both MLS data and UAV images were collected in around 1.5 months interval. Therefore, the changes of 3D scene during the time can suppose to be ignored.
MLS data from Sensei system include: point 3D coordinates (x, y, z), pulse width, profile number, echo number, timestamp for the profile, timestamp for the point and vertical angle of the point as well as GPS and IMU information. The return echoes of Sensei system can be up to 3. It indicates the capability to penetrate the vegetation. UAV images contain R, G, B channels. Exterior orientation parameters of images were not available.
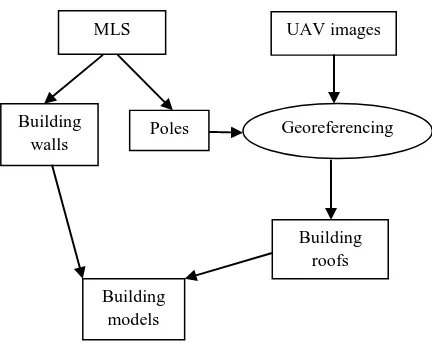
Figure 3. Work flow
After MLS point cloud was collected and UAV images were acquired, in order to achieve desired 3D models from these datasets, the following steps are proposed:
i) Building walls and poles are classified from MLS; ii) UAV image block setup;
iii) Georeferencing 2D UAV images to the poles from MLS; iv) Building roof extraction from UAV images;
v) Building geometry reconstruction from the data fusion of building walls and building roofs;
2.2.1 Object classification from MLS
MLS point cloud is a set of unorganized points. The point distribution is not even as airborne laser scanning (ALS) data. The point density is affected by the platform moving speed, the scanning angles, and object reflection nature and so on. Therefore the algorithm development considers these natures of MLS data. In the following description, we skip the step of ground point removal since many algorithms for ground extraction from ALS could also be used for ground extraction (e.g. Kraus & Pfeifer, 1998; Axelsson, 2000; Raber et al., 2002; Ma & Meyer, 2005; Shan & Sampath, 2005; Meng, et. al, 2010) from MLS. The building walls were extracted from MLS data by using the method proposed in Zhu et al. (2011). According to the proposed method, buildings were extracted by comparing the overlaps (those points with the same –x and –y coordinates but different –z values) between the different height passes and transforming the top view of the overlap data into a binary image and applying image processing technology to remove the non-building points, and finally transforming this image back into point clouds. This proposed method is well conducted in vertical wall extraction. And it is also suitable for our testing data.
Figure 4. The process of pole extraction (a) A binary image (-xy plane view) of a cutoff point cloud
from the data after removing ground and buildings; (b) Binary image after large objects filtered out; (c) Transform (b) to 3D points.
After removing ground and building points, poles are extracted from the rest of the data. The steps for pole detection are as follows:
i) Cut data from a height pass of Zmin+3~ Zmin+5 locally (grid by grid) in the rest data;
ii) Transform the cutoff data to a raster image with x, y coordinates; (Figure 4 (a))
iii) Constraint the object size in the binary image for rough pole detection; (Figure 4 (b))
iv) Transform the roughly detected poles back to 3D points; (Figure 4 (c))
v) Grid the 3D points into small blocks and calculate the number of the points and also the height difference in each block.
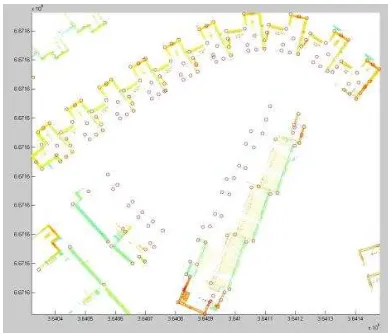
vi) Pole extraction by setting the thresholds for the number of the points and the height difference (Figure 5).
Figure 5. The result of pole extraction
The poles as reference points for UAV image are more accurate than manual pick up points from point cloud. And also the algorithm for pole detection is fairly high efficient. The run time takes only few seconds in the testing data. Additionally, people usually use building corners as referencing points. As we know, the building corners from laser data might be not accurate enough due to object scanned line by line. The laser hits on the corners do not exactly get the right returns. It depends on the size of laser footprint and the position of laser hits on the building corners. For example, when a laser footprint partly hits the building corner and partly hits the other close objects or ground, the laser return would not be exactly on the corner. Maybe the corner point is missing.
2.2.2 UAV image block and georeferencing to MLS
Figure 6. UAV image block
UAV images were taken in every second, with an overlap of 80% in both side overlap and forward overlap. These images were taken from different views. The images with known camera calibration parameters (focal length of camera, principal points of image and system errors: lens distortion and deformation) can be referenced to each other and be relatively UAV images
Georeferencing
Building roofs MLS
Building
walls Poles
oriented (the first image as reference image whereas other images oriented based on it). Current software (e.g. iWitness) has provided a good solution for it. We use iWitness software to form an image block (Figure 6) by importing camera calibration parameters and images. This software can be used for establishing an image block from multiple cameras settings and different image configurations (e.g. various views and scales of images). Therefore, it is suitable for our dataset which contains both vertical view and oblique view of images. Before control points are applied to the block, the images were referenced each other in a local 2D coordinate system. After the use of 3D poles from MLS as control points, the corresponding relationship between 2D images and 3D objects are established. This corresponding relationship can be described by photogrammetric equations e.g. collinearity equations or coplanarity equations. Our expectation from image block is to find solutions for exterior orientation parameters (camera position and pose during its exposure) of each image. It requires known camera calibration parameters and also at least four corresponding points from 2D images and 3D point cloud. The more corresponding points are applied, the more accurate result can be achieved. Finally the least square adjustment method is used to find the best solutions.
2.2.3 Building roof extraction from UAV images
After UAV images were oriented, the corresponding relationship between 2D images and 3D scene was established. Building roof vectors with the 3D coordinates were extracted from the image block. The left one of Figure 7 shows the building roof vectors from UAV image block.
Figure 7. Left one: Building roof extraction from UAV images;
2.2.4 Building geometry reconstruction
A complete building geometry includes building roofs and building walls, which also indicates different views of the objects, from fly-through view and from walk-through view. UAV images were acquired from fly-through view whereas MLS data were collected from walk-through view. Data fusion from both datasets ensures scene models to become complete. Figure 8 gives an illustration about the fusion of building roofs and walls. It can be seen that building roof points are the key points while walls from MLS still contain amount of points. Therefore, key points from walls need to be extracted. Several steps are required to achieve it: i) coplanar points detection; ii) extraction of the intersection line between two planes; iii) constraint right angle shapes for building planes; iv) key point extraction in each plane by local minimum or maximum.
Figure 8. Data fusion of building roofs from UAV image and building walls from MLS. The pink circles are the building roof points whereas the other points are from MLS.
3. RESULTS AND ANALYSIS
Test data were collected from the area located in Sundsburg, Kirkkonummi, Finland. FGI Sensei mounted on a car and FGI camera-based UAV were employed for test data acquisition. MLS data from FGI Sensei collected the data from the whole area of Sundsburg. UAV images were acquired by four flight strips with an overlap of 80%, from both vertical views and oblique views. However, due to a short flight time in each strip, it resulted in a small area coverage. Therefore, we chose a small area which both datasets cover as our test data. The methods presented in section 2 were implemented and the desired results were achieved. Building geometry reconstructed from UAV images and MLS data is shown in Figure 9. A complete 3D scene was achieved.
Figure 9. Building geometry reconstruction
The accuracy of georeferencing UAV images to MLS data (poles) is shown on Table 1. The shown error is an accumulating error from both systems and measurements of corresponding points.
Errors could be from the following factors:
i) FGI Sensei uses Ibeo laser scanner with a measurement accuracy of 10cm;
ii) Weak GPS/ IMU signals during MLS data collection; iii) Inaccurate UAV camera calibration parameters; iv) UAV image distortion;
Errors shown on Table 1 could be from the following factors:
i) FGI Sensei uses Ibeo laser scanner with an measurement accuracy of 10cm.
ii) Weak GPS/IMU signals during MLS data collection; ii) Inaccurate camera calibration parameters;
iii) UAV image distortion;
v) Inaccurate corresponding point position measurement from UAV images and MLS data;
4. CONCLUSIONS
This paper proposed the methods for the use of MLS data and Unmanned Aerial Vehicle images for 3D model reconstruction. Our methods have been conducted and desired results were achieved. Due to no available camera positions and poses during image exposures, it was necessary to georeference UAV images to 3D points for the extraction of exterior orientation parameters of images. And also it is benefit for consistent accuracy achievement from both datasets. Our methods started from UAV image block setup and georeferencing UAV images to the poles extracted from MLS. After UAV images were orientated and the corresponding relationship between 2D UAV image and 3D MLS was established, building roofs were extracted from images. Walls were obtained from MLS by our previous developed methods. Complete building models from the scene were achieved by both data fusion. The benefits from our methods can be seen: consistent accuracy achieved for both datasets fusion.
iv) A complete 3D scene was reconstructed by extracting building walls from MLS and building roofs from UAV images.
In future work, automated methods for georeferencing UAV image to MLS will be developed in order to save the time and cost.
References:
Axelsson, P., 2000. DEM generation from laser scanner data using adaptive TIN models. International Archives of the Photogrammetry, Remote Sensing and Spatial Information Sciences, Vol. XXXIII (Pt. B4/1), pp.110–117.
Barazzetti, L. , Remondino, F. , Scaioni F., Brumana, R., 2009. A fully automatic UAV image-based sensor orientation.
Proceedings of International Archives of the Photogrammetry, Remote Sensing and Spatial Information Sciences, XXXVIII,Commission I, ICWG I/V.
Bay, H., Ess, A., Tuytelaars, T., Van Gool, L., 2008. SURF: Speeded up Robust Features. CVIU, 110(3), pp. 346-359.
Baumberg, A., 2000. Reliable feature matching across widely separated views. Proc. of CVPR, pp. 774-781
Georgescu, B. and Meer, P., 2004. Point Matching under Large Image Deformations and Illumination Changes. PAMI, Vol. 26(6), pp. 674-688
Goshtasby, A., 2005. 2-D and 3-D Image Registration for Medical, Remote Sensing, and Industrial Applications, Wiley Press. measurements. ISPRS-J. Photogramm. Rem. Sens.;65:514–522.
Kraus, K.; Pfeifer, N., 1998. Determination of terrain models in wooded areas with aerial laser scanner data. ISPRS J. Photogramm. Remote Sens. 53, 193-203.
Lowe, D.G., 2004. Distinctive image features from scaleinvariant keypoints. IJCV, 60(2), pp. 91-110.
Ma, R.; Meyer, W, 2005. DTM generation and building detection from Lidar data. Photogramm. Eng. Remote Sens. 71, 847-854
Meng, X., Currit, N., and Zhao, K., 2010. Ground Filtering Algorithms for Airborne LiDAR Data: A Review of Critical Issues. Remote Sensing, 2, 833-860; doi:10.3390/rs2030833.
Raber, G.T., Jensen, J.R.; Schill, S.R.; Schuckman, K., 2002. Creation of Digital Terrain Models using an adaptive Lidar vegetation point removal process. Photogramm. Eng. Remote Sens. 68, 1307-1316.
Remondino, F., Ressl, C., 2006. Overview and experience in automated markerless image orientation. IAPRSSIS, Vol. 36(3), Bonn, Germany, pp. 248-254.
Shan, J.; Sampath, A, 2005. Urban DEM generation from raw LiDAR data: a labeling algorithm and its performance. Photogramm. Eng. Remote Sens., 71, 217-226.
Zhu, L., Hyyppä, J., Kukko, A., Kaartinen, H., & Chen, R., 2011. Photorealistic 3D city modeling from mobile laser scanning data. Remote Sens., 3(7), 1406-1426.
Zitová, B., Flusser, J., 2003. Image registration methods: a survey. Image Vision Comput. 21(11): 977-1000.
Acknowledgement