UAV PHOTOGRAMMETRIC SOLUTION USING A RASPBERRY PI CAMERA
MODULE AND SMART DEVICES: TEST AND RESULTS
Marco Piras, Nives Grasso, Ansar Abdul Jabbar
Politecnico di Torino, Dip. di Ingegneria dell'Ambiente, del Territorio e delle Infrastrutture, Corso Duca degli Abruzzi 24, 10129 Torino, Italy – (marco.piras, nives.grasso, [email protected])
KEY WORDS, UAV photogrammetry, camera self-calibration, python, Raspberry Pi, mass-market, IMU
ABSTRACT:
Nowadays, smart technologies are an important part of our action and life, both in indoor and outdoor environment. There are several smart devices very friendly to be setting, where they can be integrated and embedded with other sensors, having a very low cost.
Raspberry allows to install an internal camera called Raspberry Pi Camera Module, both in RGB band and NIR band. The advantage of this system is the limited cost (< 60 euro), their light weight and their simplicity to be used and embedded.
This paper will describe a research where a Raspberry Pi with the Camera Module was installed onto a UAV hexacopter based on arducopter system, with purpose to collect pictures for photogrammetry issue. Firstly, the system was tested with aim to verify the performance of RPi camera in terms of frame per second / resolution and the power requirement. Moreover, a GNSS receiver Ublox M8T was installed and connected to the Raspberry platform in order to collect real time position and the raw data, for data processing and to define the time reference. IMU was also tested to see the impact of UAV rotors noise on different sensors like accelerometer, Gyroscope and Magnetometer.
A comparison of the achieved results (accuracy) on some check points of the point clouds obtained by the camera will be reported as well in order to analyse in deeper the main discrepancy on the generated point cloud and the potentiality of these proposed approach. In this contribute, the assembling of the system is described, in particular the dataset acquired and the results carried out will be analysed.
1. INTRODUCTION
Since last decade, unmanned aerial vehicle (UAV) have a tremendous growth in many fields, specifically in civilian and military applications (Firoozfam 2009), cooperative air and ground surveillance (Grocholsky 2006) etc. Now UAV Photogrammetry has been under attention for topographic mapping. The main reasons are less cost, higher quality and more adoptability for mapping of relatively small-distributed areas.
There are some challenges, which should be resolved like correct designing due to limited space o the payload for the sensors, weight, adjustment of photogrammetric system in UAV body, operational aspects in take-off, flight and landing, huge data processing issue, and flight limitations due to aerial and terrestrial direct insights.
In the past, some systems (Priyanga 2014, Choi 2016) were available, where Raspberry Pi is used with UAV for different purposes like computer vision based guidance system and video surveillance but no system with these characteristics was designed for photogrammetric aims. We could not find in literature other research works, in which UAV and Raspberry Pi, have been integrated with different sensors like IMU, GNSS receiver and Raspi Camera at the same time.
Raspberry Pi 3 system can used to control, collect and save all the sensors data at the same time. There are four USB ports available with Raspberry Pi so IMU and GNSS receiver were connected to Raspberry PI through USB ports, whereas the Raspberry Pi camera was connected through Camera Serial Interface which is already available with Raspberry Pi. The
power consumption of this system is around 700mA so this system can work for more than 3 hours with a power bank of 2600mA capacity, as was used for this project.
This system is a low cost system in which open source software RTKLIB is used to collect real time position data whereas a Python app is developed to control and collect images with different frame rates and resolution for Raspberry Pi camera. Moreover an app is also developed in python language to collect and save all data from all IMU sensors like accelerometer, gyroscope and magnetometer in CSV format which can also be processed later to remove all biases and noise so that it can be integrated with GNSS data to improve the stability and accuracy of position. Then another open source software EXIFTOOL is used to geotag the images with nmea file data collected with u-blox GNSS receiver. So the whole geometric system is easy to implement and all the software used are either open source or they are developed in Python.
Therefore, the main aim of this work is to analyse the performance of a Raspberry Pi system and a Camera Module, which installed onto a UAV multirotor system, with purpose to collect pictures for photogrammetry issue
2. THE ACQUISITION METHODOLOGY 2.1 The UAV system
For the survey a common Hexacopter (Mikrokopter) mini UAV was used (Figure 1). It has a payload of 2 Kg and a flight time of about 10-12 minutes. The system is composed of 6 motors, 6 adaptor cards (in order to control the speed and the rotation of each motor), 1 flight control adaptor card, 1 remote control, 1 The International Archives of the Photogrammetry, Remote Sensing and Spatial Information Sciences, Volume XLII-2/W6, 2017
navi control, 1 Zubax GNSS receiver, 1 MK3 MAG sensor equipped with a three-axial magnetometer (in order to control the vehicle's attitude), 1 wireless connection kit and 1 computer serving as ground control station.
Figure 1. The employed multi-rotor platform used for the image acquisition
2.2 Sensors
Three different sensors are connected to this UAV photogrammetric system.
• Raspberry Pi Camera RGB
• Microstrain Inertial Measurement Unit (IMU) • Low cost U-blox GNSS receiver M8T
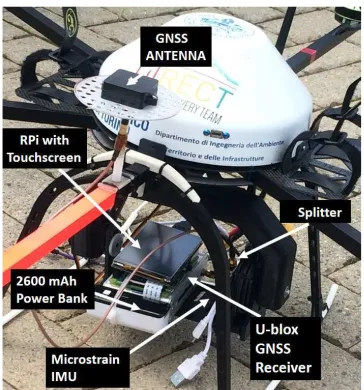
The Raspberry Pi (RPi) 3 system is used to control and process data collected from the sensors. The system is synchronized to UTC through NTP server which enables images and all the other data to be synchronized later. A small power bank with the capacity of 2600mAh is also connected to the system to power the Raspberry Pi. The current consumption of Raspberry Pi and all sensors is about 700mA and hence the system can work for more than 3 hours with a fully charged power bank. Figure 2 shows the entire photogrammetry system installed on UAV with all sensors and Raspberry Pi.
Figure 2. Photogrammetry System installed on UAV
A Raspberry Pi RGB camera is installed at the bottom of UAV to capture images. This camera sensor has 8 MP resolution and it can be set up to 60 frames per second for low resolution images. For this project, it was set to 2 frames per second to capture high resolution images. It can also record a video with 1080P (30 frames per second). An app in python is developed
to control and capture images with RPi camera and then save them with a GPS timestamp automatically, so that these images can be integrated with other sensors data.
An inertial measurement unit 3DM-GX3-35 from Microstrain is also attached to the system to collect accelerometer, gyroscope and magnetometer data in the three dimensions X, Y and Z. There was no app available for Linux system to collect data from this kind of sensor so a new app has been developed in python language which will collect and save data collected from inertial sensors in csv format with GPS timestamp and can be read in Microsoft Excel. Data packet from inertial measurement unit (IMU) can be collected with Raspberry Pi can be seen in Figure 3.
Figure 3. Data Packet of inertial sensors with python app on RPi
A GPS/GNSS patch antenna can also be connected separately to this IMU so that data from all inertial sensors can be synchronized with GPS time. GPS data packets and inertial sensors data packets can be collected with this python app at the same time. The specifications of all the IMU sensors are given in Table 1.
Accelerometer Gyroscope Magnetometer
Measurement
Range ±5 g ±300°/sec ±2.5 Gauss
Non-Linearity ±0.1 % fs ±0.03 % fs ±0.4 % fs
Initial Bias
Error ±0.002 g ±0.25°/sec ±0.003 Gauss
Scale Factor
Stability ±0.05 % ±0.05 % ±0.1 %
Noise Density 80 µg/√Hz 0.03°/sec/√
Hz
100
µGauss/√Hz
Sampling
Rate 30 kHz 30 kHz 7.5 kHz max
Table 1. Main specifications of Microstrain IMU
A low cost GNSS receiver, U-blox M8T is also attached to this UAV photogrammetric system to get position of the antenna attached to the UAV. An open source software RTKLIB from Tomoji Takasu (Takasu 2007) is used for standard and precise positioning with GNSS. It consists of a portable program library and several AP’s in which some are graphical user interfaces (GUI) and some are command line interfaces (CUI). RTKRCV and STR2STR are the two AP’s used in this system to get real time position in nmea format and raw data is also stored in ubx format for post processing.
RTKLIB supports all constellations like GPS, GLONASS, GALILEO, QZSS, BeiDou and SBAS with standard and precise The International Archives of the Photogrammetry, Remote Sensing and Spatial Information Sciences, Volume XLII-2/W6, 2017
positioning algorithms. Various positioning modes like single, DGPS/DGNSS, Kinematic, Static, Fixed, PPP-Kinematic, PPP- Static and moving baseline are supported for both real time and post processing modes. The correction from an external server can also be collected with this software by using TCP/IP, NTRIP, local log file and FTP/HTTP protocols.
Different configuration files are developed for different positioning modes and these files can be loaded in RTKRCV to get position in real time. The system is tested for static and kinematic modes to get the real time position with corrections from the nearest GNSS permanent station through NTRIP server.
3. DATA COLLECTION 3.1 The acquisition methodology
For the photogrammetric acquisition from UAV we choose a flight planning approach in order to cover the whole test area and to analyse the IMU performance by acquiring data in different directions.
The area chosen for the test was a flight field located in Tetti Neirotti, near Turin (Figure 4).
Figure 4. The flight field chosen as test area.
The location of the area, away from any occlusion, has allowed us to test GPS performance more accurately, in security and open sky.
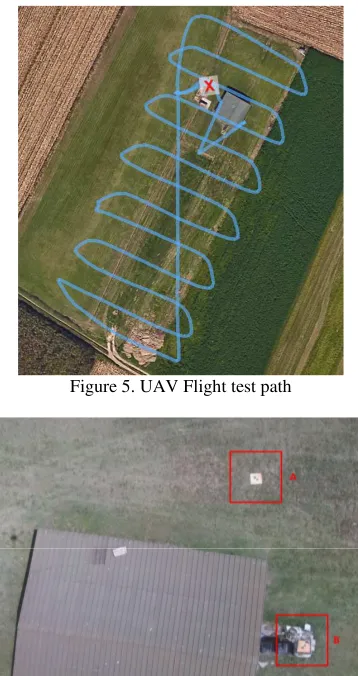
To have a complete description of the area, a flight was planned with the Mission Planner software: a linear flight made of 13 parallel strips (Figure 5) with the camera in the vertical orientation was performed, providing a degree of overlap of 70% in the route direction. The small height of flight (12 m) allowed us to have a very small GSD (0,5 cm).
Since the aim was to evaluate the acquisition accuracy of the Ublox M8T device mounted on the payload and used to georeference the images, external markers were used as Ground Control Points (GCPs) to reference the photogrammetric model. 13 photogrammetric markers were put on the ground of the flight field (Figure 6).
The markers were measured with RTK approach. Their positions were determined with a centimetre accuracy. These points were used as reference to orient the point clouds and as check points to analyze the accuracy of the results; therefore, they were realized in a common reference system with the measurement of the Ublox M8T (WGS 84).
Figure 5. UAV Flight test path
Figure 6. Marker placed on the ground (a) and on a structure in elevation (b).
3.2 System architecture
The basic architecture of Raspberry Pi photogrammetric system installed on UAV can be seen in Figure 7. A single frequency GNSS patch antenna is installed on the top of the UAV to collect GNSS signals in an open sky condition. Instead of using two GNSS antennas, a splitter is used to split signal so that U-blox receiver and IMU can use the same signal.
Figure 7. Architecture of photogrammetry system installed on UAV
The Raspberry Pi camera is set to 2 frames per second with 2592*1944 resolution and images are saved with a GPS timestamp automatically. The Raspberry Pi camera is connected to the Raspberry Pi system through a camera serial interface The International Archives of the Photogrammetry, Remote Sensing and Spatial Information Sciences, Volume XLII-2/W6, 2017
(CSI) and there is the possibility to connect more cameras to the system through USB ports.
The U-blox GNSS receiver M8T is connected to Raspberry Pi system through USB interface and it gets power from the same USB cable. The frequency of position data collection can be set to 1Hz, 5Hz or 10Hz but for UAV photogrammetric system it is set to 1Hz because images are collected with only 2 frames per second with Raspberry Pi camera.
The Inertial measurement unit (IMU) is connected through a USB interface and it is set to collect only inertial sensors packet with GPS timestamp and, also the internal timestamp of IMU. The frequency of data collection can be set from 1Hz to 1000 Hz but, during the tests, it was set to 2Hz. The system starts recording data automatically and save the data in csv format, which can be read through Microsoft, excel. Since the inertial sensor data is highly accurate for shorter time periods, it can be integrated with GNSS data collected during post processing to improve the positioning.
The Inertial measurement unit (IMU) is connected through a USB interface and it is set to collect only inertial sensors packet with GPS timestamp and, also, internal timestamp of IMU. The frequency of data collection can be set from 1Hz to 1000 Hz but, during the tests, it was set to 2Hz. The system starts recording data automatically and save the data in csv format, which can be read through Microsoft, excel. Since the inertial sensor data is highly accurate for shorter time periods, it can be integrated with GNSS data collected during post processing to improve the positioning.
4. DATA PROCESSING 4.1 IMU data processing
Each IMU sensor has its own systematic errors caused by variations in the production of the sensors creating a need for its calibration. The temperature drift, scaling factor and the angle misalignments of its axes can be compensated through calibration. The calibrated values have been provided for the Microstrain 3DM-GX3-35 IMU used in these tests. However further calibration is necessary to measure the effects of the UAV rotors on its components. Particularly the noise and magnetic field of the rotors enhance the systematic errors of the IMU.
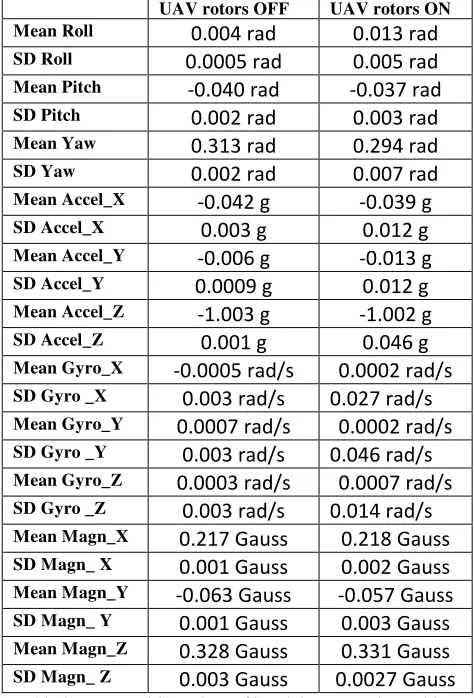
Therefore after mounting the IMU on the UAV, data of 10 minutes is collected with the rotors kept off for 5 minutes and then kept on for the next 5 minutes. All the mean and standard deviation of the parameters is tabulated in Table 2.
As observed from the tabulated values, when the rotors are switched off, the values of X and Y accelerometer are very close to zero because the IMU is at a static position. The ground exerts a force on IMU to keep it stationary despite gravity trying to pull it therefore the Z component of acceleration is equal to g in opposite direction with negative value. On switching on the rotors of the UAV, all the IMU parameter values change. The standard deviations increase for all parameters which indicates the effect of the rotor noise.
Table 2. Mean and SD values of inertial sensor values with UAV rotors off and on with static position
The noise due to rotors of UAV can be minimized by using some tools like wavelet Analyzer toolbox in MATLAB. The Daubechies wavelet filter of order 5 is used to filter noise from the signals and then both signals are plotted in the same graph (Figure 8). The filter level was chosen as the optimum trade-off between loss of useful data and filtering of noise. The original signal is represented in red colour whereas filtered signal is represented in black. Similarly the acceleration components in X, Y and Z direction with rotors off and rotors on can also be seen in Figure. Following the red line, it can be seen during the first minutes of the plot that the trend is fairly stable when compared to the next 5 minutes which represent the disturbance caused by the switching on of the rotors. The filtered black line shows the same.
Mean Gyro_X
-0.0005 rad/s
0.0002 rad/s
SD Gyro _X0.003 rad/s
0.027 rad/s
Mean Gyro_Y0.0007 rad/s
0.0002 rad/s
SD Gyro _Y0.003 rad/s
0.046 rad/s
Mean Gyro_Z0.0003 rad/s
0.0007 rad/s
SD Gyro _Z0.003 rad/s
0.014 rad/s
Mean Magn_X0.217 Gauss
0.218 Gauss
SD Magn_ X0.001 Gauss
0.002 Gauss
Mean Magn_Y-0.063 Gauss
-0.057 Gauss
SD Magn_ Y0.001 Gauss
0.003 Gauss
Mean Magn_Z0.328 Gauss
0.331 Gauss
SD Magn_ Z0.003 Gauss
0.0027 Gauss
The International Archives of the Photogrammetry, Remote Sensing and Spatial Information Sciences, Volume XLII-2/W6, 2017Figure 8. Euler angler and Acceleration graphs with rotors on and off with static position
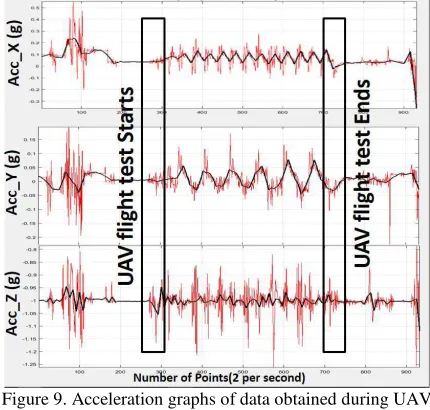
During the field test, the orientation of the IMU is set such that X axis is towards the direction of flight of UAV and Y axis is towards right of X-axis with Z pointed towards bottom of the UAV. Figure 9 shows the acceleration plots of data obtained during the UAV flight test and it can be observed that when the UAV starts to fly, there is a change in acceleration values in all three directions. At the start when the UAV takes off, the acceleration in Z direction is more noticeable and the accelerations in X and Y directions are very low, but when the UAV goes to 25 meters the acceleration in X and Y directions is more noticeable. When drone is moving forward then the force applied on accelerometer will be towards negative X axis whereas it will be towards positive X-axis when UAV moves towards opposite direction. Similarly when the drone takes a turn a towards the right or left, the acceleration towards Y axis will be high as observed from Figure 9.
All the biases due to the UAV rotors are already known for the accelerometers, gyroscopes and magnetometers, hence while doing data processing, these biases are considered to filter that noise. All the values obtained for inertial sensors are scaled values which means that these values are already compensated for temperature drift, scaling factor, angle misalignments etc. All the accelerometer values are expressed in terms of gravity (g) (9.8 m/s2) unit so all these values can be multiplied with 9.8 to see the actual acceleration applied on all accelerometers.
Among the different filters available to filter noise from different kinds of data, Matlab wavelet is selected for the IMU data because this toolbox is able to de-noise the particular signals far better than conventional filters based on Fourier transform design which do not follow the algebraic rules obeyed by the wavelets. It is also capable of deconstructing complex signals into basis signals of finite bandwidth and then reconstructing them again with very little loss of information. Many filter options are available in wavelet like Haar, Daubechies, Morlet, Meyer, Symlets, Mexican Hat etc and filter order can be selected up to 10. For this project, Daubechies filter is selected for all inertial sensor’s data with different orders for accelerometer, gyroscope and magnetometer data.
Figure 9. Acceleration graphs of data obtained during UAV flight test
The Daubechies wavelet filter of order 4 is used in the post-processing of accelerometer data in all three directions to filter the noise from the signals and both signals are plotted in the same graph. Here the original signal is again represented in red colour whereas filtered signal is represented in black.
Gyroscope data is very important for the orientation of the IMU and it provides the rotation in all three directions. A 3rd order Daubechies filter is selected to de-noise the signal for all three components as shown in Figure 10.
Figure 10. Acceleration graphs of data obtained during UAV flight test
Table 3 shows the comparison of standard deviation values of the original signal which includes noisy and de-noised signal. It can be seen that after de-noising the signal there is significant decrease in standard deviation value for all inertial sensor values. Now this de-noising signal data can be used to integrate with GNSS data to improve the position quality.
SD Values with
Table 3. Standard Deviation values of inertial sensor noised and de-noised signals
4.2 Imaging Sensors Calibration
As the final aim of this research work is to use the UAV system, combined to the Raspberry Pi 3 platform, to photogrammetric purposes, to improve the image alignment, it is suitable to define the characteristics of the camera through its intrinsic parameters (focal length, principal point and lens distortions). To get this information, a free calibration tool, Calib 3V, developed by the IUAV (Istituto Universitario di Architettuta di Venezia) (Balletti et al., 2014) was used. This software allows to extratc the intrinsic parameters from images taken from the camera. The software requires to import a set of photos of a regular grid of circles (5 rows × 7 columns) with known dimensions (Figure), in such a way that the calibration page will cover almost the total width and height of the sensor from different locations above of the planar surface of the calibration field.
Figure 11.Grid of circles printed and used for the camera calibration.
10 pictures were acquired for the Raspberry PI Camera Module and the application allowed to extract the parameters (Table 4):
Cam. Param. Camera 1
Table 4. Estimated values of intrinsic parameters.
4.3 Photogrammetric data processing
In the present work, some first tests are presented, performed with the purpose to analyse the possibility of acquire and use georeferenced images for 3D modelling from a low cost system mounted on a UAV to evaluate its effectiveness and Motion (SfM) approach implemented in the software Agisoft Photoscan Professional.
The process is carried out almost automatically, and in a fast and easy way, by this software tool, based on algorithms of computer vision. The input data required by this software to perform the 3D dense point cloud reconstruction process are only the acquired images, since it is not even necessary to know a-priori the exterior orientation parameters of the cameras. To georeference the model is possible to add the coordinates of the images or, if known, that of some control points in the environment.
The result of processing is therefore a georeferenced cloud (Figure 12).
Figure 12. The georeferenced dense point cloud of the flight field, obtained by the image processing by the tool Agisoft
Photoscan Professional.
This data could be further processed to obtain a 3D mesh, from which is possible to extract Digital Elevation Model and orthopoto of the studied area.
According to the acquired data, the obtained point clouds offer an almost complete 3D model of the of the flight field.
4.4 Results and discussion
The proposed system allows to survey the 3D geometry of the environment using low-cost sensors mounted on a UAV. To georeference the model, un the first case, we processed the geotagged images, while, subsequently, the coordinates of some GCPs, measured with an RTK approach, were used.
Agisoft Photoscan Professional uses these information as input data and, after the images alignment, it recalculates the corrected camera positions (Figure 13).
Figure 13. Images alignment performed by Agisoft Photoscan Professional the test area, which is mostly flat.
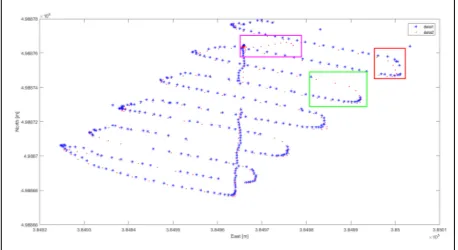
Some first analysis has been performed to evaluate the accuracy of the acquisition of the GNSS track used to geotag the images and of the generated 3D model. To this purpose, the GNSS track were compared with the estimated images position obtained after their processing with Agisoft Photoscan. In this second case the model was georeferenced using the measured control points.
The Figure 14 shows the comparison between the two tracks on X and Y directions.
Figure 14. Comparison of East and North coordinates between the GNSS track (red), used to measure the acquisition points of the images, and the estimated position of the images (blue), after the image processing. In the red rectangle is shown the
area with the greatest differences between measured coordinates; in the green and magenta box are highlighted cases
in which images were not acquired.
A first observation allowed us to observe that in some cases the images were not acquired by the system, probably due to a
temporary loss of connection between the camera and the Raspberry Pi. Furthermore some information about the GPS position were acquired when the camera was already turned off.
The registered tracks were than interpolated and compared since both were synchronized in the UTC time.
In the planar direction the maximum difference of about 2,3m has been registered in one of the turning point of the drone, as shown in Figure.
Moreover, the analyses performed showed an average difference in height between the two tracks corresponding to 1,33 m and a maximum difference of 2,46 m. Despite the flight height was fixed at 12 m, highest values as been registered in correspondence of the drone rotation points, where the system makes abrupt and rapid movements that, sometimes, influenced also by the wind, can cause a rapid loss of height.
From the observation of the results, it is possible to state that the information related to the image positioning taken alone, as acquired through the Ublox M8T GNSS system, is not with sub-metric accuracy, while RTK approach used to measure the position of markers reaches centimetre accuracy.
5. CONCLUSIONS AND FUTURE WORKS The paper describes a UAV photogrammetric solution composed by the Raspberry Camera module V2. The camera sensors is managed by a Raspberry Pi device installed on the UAV. The real time GNSS position and the attitude are given by a GNSS Ublox M8T and a Microstrain Inertial Measurement Unit.
In this preliminary study, the effectiveness of this acquisition system was evaluated. Is, therefore, possible to affirm that the georeferencing with a centimetre level of accuracy, without the use of any GCPs.
Observing the results of the conducted tests, future studies will be directed toward the integration of the inertial data with the GNSS position, which would allow to more accurately determine the position of the of the images acquisition centers. Indeed, despite the inertial data is affected by the magnetic field generated by the six rotors, using specific filtering algorithms, it is possible to de-noise the signal.
Moreover, future work will be oriented on the implementation of a system, which allows to directly using the Zubax GNSS to geotag the images, which now is currently used only to manage and control the UAV path. This improvement makes it possible to ease the UAV payload, as it is no longer necessary to use the Ublox M8T GNSS device and the smartphone, which ensure the internet connection.
Finally, future tests will involve the performance analysis of the NIR Camera Module.
REFERENCES
Balletti, C., Guerra, F., Tsioukas, V., & Vernier, P. (2014). Calibration of action cameras for photogrammetric purposes. Sensors, 14(9), 17471-17490.
Takasu, T. 2007. RTKLIB: An Open Source Program Package for GNSS Positioning. http://www.rtklib.com/
B. Grocholsky, J. Keller, V. Kumar, and G. Pappas, (2006), Cooperative air and ground surveillance: A scalable approach to the detection and localization of targets by a network of UAVs and UGVs,ǁ IEEE Robotics & Automation
Choi, Hyunwoong, Geeves, Mitchell, Alsalam, Bilal, & Gonzalez, Luis F. (2016), Open source computer-vision based guidance system for UAVs on-board decision making. In 2016 IEEE Aerospace Conference, 5-12 March 2016, Yellowstone Conference Center, Big Sky, Montana.
Blom, J.D., 2006. Unmanned Aerial Systems: A Historical Perspective, Combat Studies Institute Press, USA.
M. Saadatseresht, A.H. Hashempourb, M. Hasanloua (2015) UAV photogrammetry: A Practical solution for challenging mapping projects, School of Surveying and Geospatial Engineering, University of Tehran, Tehran, Iran
Priyanga .M, Raja ramanan .V (2014). Unmanned Aerial Vehicle for Video Surveillance Using Raspberry Pi, Dept of Information Technology, Anna University, Velammal College of Engineering and Technology, Madurai, India
S. Se, P. Firoozfam, N. Goldstein, L. Wu, M. Dutkiewicz, P. Pace, JPL Naud (2009), Automated UAV-based mapping for airborne reconnaissance and video exploitationǁ, Proceedings of SPIE Vol. 7307, Orlando, Florida.
