USE OF UAS IN A HIGH MOUNTAIN LANDSCAPE: THE CASE OF GRAN SOMMETTA
ROCK GLACIER (AO)
E. Dall’Asta1, R. Delaloye2, F. Diotri3, G. Forlani1, M. Fornari1, U. Morra di Cella3, P. Pogliotti3 R. Roncella1, M. Santise1
1 DICATeA, University of Parma, 43124 Parma (PR), Italy - (elisa.dallasta, matteo.fornari2, marina.santise)@studenti.unipr.it
(gianfranco.forlani, riccardo.roncella)@unipr.it
2 University of Fribourg, Department of Geosciences, Geography Unit, ch. du Musée 4, 1700 Fribourg, Switzerland –
3 Environmental Protection Agency of Valle d'Aosta (Italy) – Climate Change Unit –
(fabrizio.diotri, paolo.pogliotti)@gmail.com, [email protected]
Commission VI, WG VI/4
KEY WORDS: UAS, Rock Glacier, Monitoring, Hazard, Automation
ABSTRACT:
Photogrammetry has been used since long time to periodically control the evolution of landslides, either from aerial images as well as from ground. Landslides control and monitoring systems face a large variety of cases and situations: in hardly accessible environments, like glacial areas and high mountain locations, it is not simple finding a survey method and a measurement control system, which are capable to reliably assess, with low costs, the expected displacement and its accuracy. For this reason, the behaviour of these events presents the geologists and the surveyor each time with different challenges. The use of UAS (Unmanned Aerial System) represents, in this context, a recent and valid option to perform the data acquisition both in safety and quickly, avoiding hazards and risks for the operators while at the same time containing the costs. The paper presents an innovative monitoring system based on UAS-photogrammetry, GNSS survey and DSM change detection techniques to evaluate the Gran Sommetta rock glacier surface movements over the period 2012-2014. Since 2012, the surface movements of the glacier are monitored by ARPAVdA (a regional environmental protection agency) as a case study for the impact of climate change on high-mountain infrastructures. In such scenarios, in fact, a low-cost monitoring activity can provide important data to improve our knowledge about glacier dynamics connected to climate changes and to prevent risks in anthropic Alps areas. To evaluate the displacements of the rock glacier different techniques were proposed: the most reliable uses the orthophoto of the area and rely on a manual identification of corresponding features performed by a trained operator. To further limit the costs and improve the density of displacement information two automatic procedures were developed as well.
1. INTRODUCTION
Environmental control and monitoring systems face a large variety of cases and situations; indeed, the behaviour of different phenomena (in the time domain as well as in the space domain) depends on very many factors, which present the geologists and the surveyor each time with different challenges. In principle, as far as a geometric survey is concerned, the main parameter when designing a measurement and control system is the accuracy needed to assess, with a given probability, the magnitude of the expected displacement. However, a number of other issues influence the choice of the best monitoring system to use: the size of the area to control, the frequency of data acquisition, the time to deliver the results (alert time), the stability of the reference system, the influence of atmospheric parameters on measurement accuracy or operation, the site constraints, etc.
Photogrammetry has been used since long time to periodically control the evolution of landslides, either from aerial images (Casson, et al., 2003), as well as from ground (Cardenal, et al., 2008); in (Mora, et al., 2003) the same technique has been used in combination with GPS surveys on the landslide body. In the same context, one of the most promising techniques that are rapidly spreading in many applications are UASs (Unmanned Aerial Systems). Their relatively low cost and their capability of
acquiring concurrently geometric (usually producing Digital Surface Model – DSM) and thematic data (using RGB or NIR imaging systems), as well as a very good productivity rate make the technology extremely appealing also for monitoring applications.
Monitoring the surface creep of mountain permafrost is important to understand the effect of ongoing climate change on slopes dynamics. Rock glaciers are widespread landforms that can show rapid acceleration and destabilization (Delaloye, et al., 2013). In heavily anthropic areas like the Alps, the accelerating creep of perennially frozen talus/debris with high ice content will probably become an increasing problem, notably for human infrastructures (Haeberli, 2013). However, traditional techniques (e.g. topographical survey) cannot easily be applied in such scenarios: for example, the glacier surface is rough and presents hazards like crevasses. Only an operator with adequate training is able to realize a survey, often with some risks to his safety.
This study presents the evaluation of movements and volumetric changes of an Italian rock glacier, obtained by multi-temporal analysis of UAS images over the period 2012-2014. The movement rate obtained by photogrammetry is validated against repeated GNSS campaigns on 48 points distributed on the rock glacier.
2. SITE DESCRIPTION
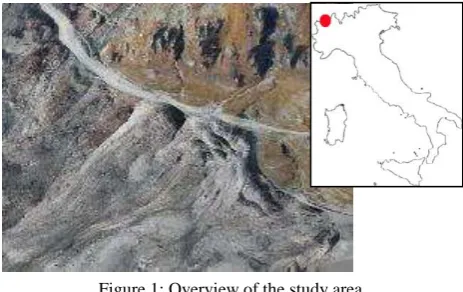
The study area is located in the western Alps at the head of the Valtournenche Valley (Valle d'Aosta, Italia) on the Italian side of Matterhorn. The body of the rock glacier is composed by two lobes, spanning an elevation range between 2600 and 2750 m. It is nearly 400 m long, between 150 and 300 m wide and has an apparent thickness (based on the height of the front) of 20-30 m. The debris origins from an overhanging rockwall, mainly composed by green schists with prasinites (dark rocks) with intercalated bands of dolomite and marbles (clear rocks). It displays morphological features typical of active landforms: longitudinal ridges in the central steep part and a succession of transverse ridges and furrows in the compressive part of the tongue. An overview of the area is shown in Figure 1.
Since 2012, the surface movements of the glacier are monitored by ARPAVdA (Agenzia Regionale per la Protezione dell'Ambiente Regione Autonoma Valle d'Aosta - Environmental Protection Agency of Valle d'Aosta) as a case study for the possible impact of climate change on high-mountain infrastructures: in fact, this glacier juts on a ski slope of the Cervinia resort, causing every year maintenance issues to professionals. For these reasons, a multi-approach monitoring system, based on repeated UAS-photogrammetry and GNSS (Global Navigation Satellite System) survey, has been setup. The current dataset of observation consists of two UAS flights (October 2012 and 2014) and three GNSS campaigns (mid August 2012, 2013, 2014). The monitoring activity also includes measures of subsurface temperatures and deformations in two 15 m deep boreholes and geophysical prospecting (seismic and electrical), but these data are not treated in this paper.
Figure 1: Overview of the study area.
The advantage of using both GNSS and UAV is in their complementarity. On one hand GNSS gives measures of surface displacement with high accuracy, but just on few points (48 in this study). On the other hand the UAS-photogrammetry provides a dense cloud of points which allows (i) to describe in detail the whole surface producing an high resolution DSM and (ii) to generate related orthophotos to evaluate the glacier displacements.
The GNSS data can be used as ground truth for validating the displacement obtained by orthoimage analysis and DSM comparison and check the accuracy of the monitoring system.
3. DATA ACQUISITION
Extreme environments, as high mountain areas, represent hostile places for survey operations. Therefore, the use of a drone represents an easy and safe way to conduct the monitoring activities. The UAS must be able to fly at high
altitude and over extended area in a short time; this involves efficient performances during the mission in terms of low power consumption, endurance and safety. For all these reasons, we used the fixed-wing Swinglet CAM produced by SenseFLY. It is particularly functional because, being realised in Expanded Polypropylene (EPP) foam and carbon structure, it is very lightweight and effortlessly transportable in a steep environment. Its endurance (usually with a single battery pack the drone can go on for more than 30 minutes) allows completing the planned mission with just one flight. At the same time, several features of the ground station software, if something goes wrong (e.g. loss of radio signal, low battery level, etc.), provide a safe return of the drone to the landing site.
3.1 GCP network
In order to properly register the DSM at every epoch, 18 GCPs (Ground Control Points) distributed on the edges of the rock glacier area were materialized: the GCPs location is shown in Figure 2.
Figure 2: Location of GCPs.
The GCPs located in the upper part of the area were signalized with paint over blocks and those located in the lower part are materialized over manholes and buildings. These control points were measured with the GEOMAX Zenith 20 Series in GNSS RTK (Real Time Kinematic) mode. The expected precisions in XY coordinates are 1-2 cm and 2-3 cm in Z. Unfortunately, only 10 GCP (mainly those located on manholes) were distinguishable on the images and were available for image block control. To provide more GCP, for the next survey campaigns which should take place in July 2015, new ad hoc targets will be provided to replace those sprayed on blocks.
3.2 The UAS photogrammetry
The Swinglet CAM was equipped with a 12 Mpixel CANON IXUS 220 HS camera for the 2012 flight, and with a 16 Mpixel CANON IXUS 125HS camera for the 2014 flight. The former flight was performed at 150 m height with a longitudinal overlap of 60% and a sidelap of 70% between adjacent strips, with a resultant GSD (Ground Sampling Distance) of 5 cm/pixel. The number of images acquired and used in the bundle block adjustment was 110. For the 2014 flight, the same GSD was obtained changing slightly the flight altitude. At the same time, to make the image block more rigid, the longitudinal and side overlap were respectively of 80 and 85%. Given the The International Archives of the Photogrammetry, Remote Sensing and Spatial Information Sciences, Volume XL-3/W3, 2015
flight characteristics, the images acquired in the photogrammetric block were 239. Table 1 summarises the design parameters of the two UAS flights.
2012 2014
Date October 24th August 18th
N° images acquired 110 239 (two flights)
N° images used 110 239
Side overlap 70% 80%
Longitudinal overlap 60% 85% Ground resolution 5 cm/pixel 5 cm/pixel
Table 1. Summary of the UAS flights characteristics.
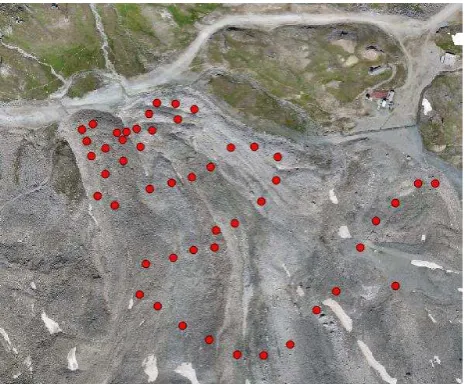
In order to evaluate the repeatability of the digital models, the bundle block adjustment and the consequent dense surface reconstruction of the two UAS surveys were performed with two different software packages: MicMac (Deseilligny, 2011) developed by IGN (Institut National de l’information Géographique et Forestière, Paris) and the commercial software Agisoft PhotoScan (PhotoScan, 2014) developed by Agisoft LLC company. Both software pipelines begin with automated tie point extraction and feature matching; after that, a bundle calibration procedure was used in the image orientation process. Even if the embedded GNSS camera locations were available to provide an initial solution to the bundle adjustment, their accuracies were too low for correctly co-register the DSM at the different epochs, and the GCP were preferred to orient the photogrammetric blocks. Finally, to validate the DSMs accuracy, 48 GNSS check points (depicted in Figure 3) were used to check the elevation discrepancies between GPS measurements and photogrammetric surface reconstruction (Table 2).
2012 Flight 2014 Flight
Mean [m] 0.103 0.025
Dev. Std [m] 0.110 0.156
N° GNSS points 48 46
Table 2. Statistics of the comparison between the GNSS elevation data and the photogrammetric reconstructed DSM
for the two flights.
These DSM check points were measured with the Leica Viva GS10/15 GNSS RTK mode, with an expected precision of ca. 1 cm. The points were materialized using fluorescent spray paint and drilling a small pilot hole on the rock surface for the GNSS pole. The points are not clearly recognizable in the UAS images and so the check points were compared with the DSM surface. Anyway, the standard deviations of the differences are in good agreement with the theoretical precision computed during image block design. To limit the number of images, a GSD of ca. 5 cm, which provide a final theoretical precision of ca. 8.5 cm for both flights, was considered optimal. The results of the comparison are good, considering also the ground resolution (of 5 cm) of the photogrammetric reconstructed digital models, and the estimated precision of the GNSS survey (comparing the measures on fixed point an accuracy of ca. 5 cm was found). However it is important to highlight the mean value of the differences revealed from the statistics of the 2012 flight: in this case the observed 10 cm can be probable due to a systematic error source between the GCP and GNSS measurements.
Figure 3: Localization of the 48 GNSS measured points.
4. MEASUREMENT AND ANALYSIS OF THE DISPLACEMENT FIELD
The reconstruction of the rock glacier surface movements is obtained by comparing the orthophotos and the DSM of the two UAS photogrammetric surveys of the investigated area, executed over the period 2012-2014. As described in the previous section, the photogrammetric workflow has allowed to obtain two raster DSM (with a cell size of 20 cm), and two different sets of orthophotos of the inspected region, characterised respectively by a 20 cm and 5 cm pixel size. The orthophotos were analysed to identify the rock glacier displacements using two different methods: the manual identification of well-recognizable points on the glacier surface on the orthophotos of two epochs; an automatic tracking method able to recognize a dense grid of corresponding points between the images. The first set of orthophotos was used for automatic identification of displacement, the second (with higher resolution) to help the manual extraction of corresponding point. An independent assessment of the estimated displacement field was performed on the basis of repeated GNSS campaigns that were executed on 48 points distributed on the rock glacier (Figure 3).
4.1 Manual measurement of the displacements
A first surface displacements analysis of the rock glacier was performed by manually selecting, on the orthoimages of 2012 and 2014, 746 corresponding points. The results are shown in Figure 4: for each point a displacement vector is depicted. The manual measurements revealed significant surface movements. The highest observed values of displacements (up to 3 m) are localized at the top of the glacial landslide left front, whereas, from left to right of the surface, movements decrease from 2.5 to 0.2 m.
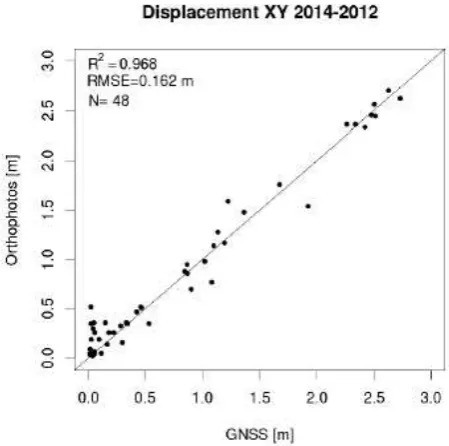
The movement rate validation analysis (Figure 5) shows that the correlation between GNSS data and manually measured displacements is good at all magnitudes of displacement, with a root-mean-square error of about 16 cm (RMSE). Indeed, some measured data are noticeably not in agreement with GNSS survey, influencing the statistical results but, considering the pixel size of the orthophotos, errors in the manual identification of some of the 746 points might have occurred.
Figure 4: Displacements vectors (red line magnification x4) calculated manually on 746 tie points on the orthoimages.
Figure 5: Scatterplot between displacements obtained from the comparison of UAS orthophotos manual analysis and GNSS
measurements on 48 points.
4.2 Automatic displacements measurements
In fact, displacement and/or deformation measurements of the object surface can also be obtained by automatically tracking corresponding points between the images: features and points tracking can usually be achieved using Feature (FBM) or Area Based Matching (ABM) algorithms. FBM algorithms (Förstner, 1986) extract features of interest (lines, edges, angles, etc.) from images using specific analytical operators (Mikolajczyk, 2005) and afterwards identify correspondences between feature lists. These methods are reliable and fast, but they produce sparse disparity maps because the matching process regards only the features with the highest detector response. Differently, in ABM, the matching process is directly applied to image intensity (grey values). Starting from a point on a reference image, the algorithm identifies the most probable location of the homologous point on the other images of the sequence. Each point to be matched is the centre of a small window of pixels in the reference image (the 2012 orthophoto in this case) and this window is statistically compared with equally sized windows of pixels in other images (the 2014 orthophoto). Therefore,
correspondences between the two images are identified by considering the similarities between grey values. A dense displacements map of the region of interest (with little or no working load for the operator) can be obtained by scanning the reference image with short spacing.
Usually, commercial image matching software packages work on 8 bit indexed images (if RGB images are used, the software generally converts them in gray scale). With this limitation, the automatic procedure should work directly on the orthophotos. Another option is to represent the local shape of the DSM converting its height map to some other representation (e.g. with a shaded relief map) and exporting it to a common image format (see Figure 6 Top).
Figure 6. Top: Shaded DSM of the October 2012 flight. Bottom: Elevation raster map, after the Wallis filter
application, of the October 2012 DSM.
Also in this case, however, the raster product has an 8-bit color depth. Moreover, as far as hillshading rendering is concerned, being such technique based on the computation of the angle between DSM surface normals and incident light rays direction (Horn, 1981), height data noise can be amplified by the procedure. On the other hand, smoothing effects, where shape discontinuities occur, should be expected. A better choice would probably be the use of particular image filters such as the The International Archives of the Photogrammetry, Remote Sensing and Spatial Information Sciences, Volume XL-3/W3, 2015
Wallis filter (Wallis, 1976) to improve the height map local contrast (Figure 6 Bottom).
Figure 7. Top: 2012 orthophoto. Bottom: 2014 orthophoto.
Automatic tracking of the displacements, both for the orthophotos and the DSM, has been performed, using in-house codes: DenseMatcher (Re, et al., 2012) and a proprietary implementation of Semi-Global Matching (SGM) algorithm (Hirschmuller, 2005; Dall’Asta, 2014). Both software codes are able to perform the correlation process taking in input also 32- bit floating point rasters. The former implements a Least Square Matching (LSM) algorithm (Gruen, 1985), which tracks the position of one point at a time comparing the area (i.e. the image block) surrounding the point itself. It uses a functional model which is able to provide displacements values with sub pixel accuracy, extracting a full field description of the deformations of the rock glacier surface. In this context, however, the use of complex shape functions to model the template deformation between the two images (Re et al., 2014) should be discouraged, since, working with rectified orthophotos, the main transformation expected is simply a translation. Moreover, using SGM method it is also possible to constrain the regularity of the displacement field, improving the results reliability. The technique considers both the image similarity and the displacement field continuity, by the concurrent application of regularization constraints (in terms of adjacent pixels displacement). SGM, in its original implementation, was conceived for performing a one-dimensional search of displacements between images. For instance, in stereo-vision problems the images to be matched can be transformed so that the displacement between corresponding points occurs always along the same direction. However, an in-house implementation for 2D displacement
search space has been recently developed by the authors (Dall’Asta, 2015) and can be used in this context.
4.2.1 Automatic displacements measurements on orthophotos
A first series of tests showed that the application of ABM algorithm to the orthoimage pair (shown in Figure 6) is not always reliable, producing a large amount of gross errors and mismatches. In this context, the main issue is represented by the illumination conditions of the slope, which can change drastically over the monitoring period, producing significant contrast and brightness variations between the images. Moreover, the weathered surface of the rock glacier can produce relevant texture changes of the surface (Figure 7 clearly shows the radiometric problems which can arise, over a long monitoring period, between the two orthophotos). On account of this, image texture changes, together with low contrast regions and radiometric transformation problems, can worsen the matching algorithms performance.
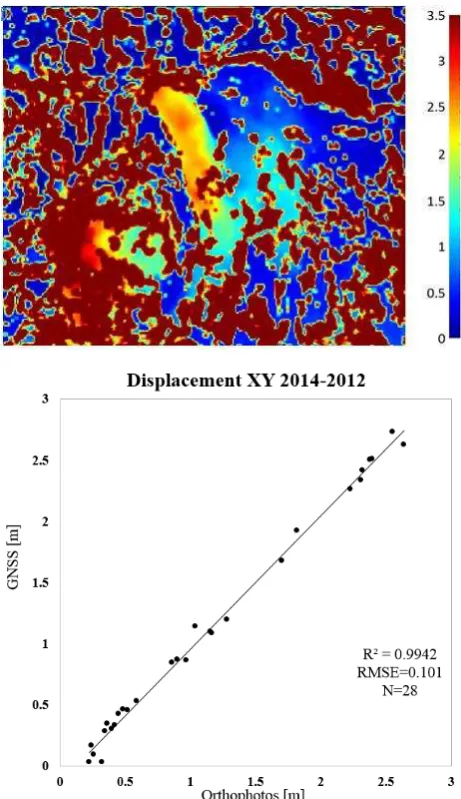
Figure 8. Top: 2D Displacement [m] coloured map obtained by ABM process on the orthophotos. Bottom: Scatterplot between displacements obtained from the automatic comparison of UAS
orthophotos and GNSS measurements on 28 points. The International Archives of the Photogrammetry, Remote Sensing and Spatial Information Sciences, Volume XL-3/W3, 2015
The results of the matching process, applied directly to the orthophotos, are visible in Figure 8 Top e Bottom. In order to obtain displacement maps comparable with the DSMs original data, a 20 cm pixel size orthophoto was used (instead of the original 5 cm high-resolution orthoimages).
These first series of tests show that the application of area based matching algorithm to the orthoimages can produce a significant number of outliers (out of range red areas displayed in Figure 8 Top), probably due to false positive in the low contrasted regions. Indeed, the evident contrast and illumination changes, together with the presence of snow-clad areas, cannot be identified reliably by the correlation algorithm, producing erroneous matched points.
At the same time, it is worth nothing that, where the images radiometry shows suitable characteristics for the ABM application, the results accuracy is very good, especially considering that, to limit the workload of the algorithm, a pixel size of 20 cm was used: a final RMSE of about 10 cm (see Figure 8 Bottom) is achieved. However, these results are validated against only 28 points of the 48 GNSS total measurements (just 58% of the control points are in agreement with those measured with the GPS campaign). The remaining 20 check points were discarded in the analysis since they fell in the regions affected by outliers.
To provide a more reliable comparison of the two epochs (possibly in all the extent of the rock glacier) a different method has been investigated.
4.2.2 Automatic displacements measurements on raster elevation models
Forasmuch as the rock glacier is subjected to sliding, the local surface shape does not change so much, while the colour variations of the surface elements are significant. As already pointed out, the proprietary image matching techniques developed by the authors can use effortlessly floating-point rasters and the identification of homologous features can be performed on the DSM directly. Such solution represents the simplest and most efficient way to overcome the limitation represented by the use of long time-separated orthoimages. The calculated displacement field, using this technique, is shown as a 2D coloured map in Figure 9 Top; displacement vectors are overlapped with reduced points density to improve the legibility of the results.
According to the manual measurement of the displacements, the highest displacement values observed on the rock glacier body, are in the range of 2–2.5 m, showing the same distribution within the rock glacier surface of the manual extraction procedure. It is also clear that these results appear more robust and reliable, allowing to reconstruct the displacements of the whole rock glacier body and the surrounding areas.
Comparing the displacement map with the GNSS validation survey data (on a sample of 40 validated points), the accuracy seems in agreement with the manual DSM comparison results, while it is a little lower than the one obtained by orthophoto manual extraction. The RMSE is about 16 cm (results validation is shown in Figure 9 Bottom). The small, isolated regions where high displacement discontinuities are highlighted (two of them are pointed out by white arrows in Figure 9 Top) represent most likely gross errors (note, for instance that in some cases the direction of the displacement is inverted) or identified rolling blocks.
Figure 9. Top: 2D Displacement [m] coloured map obtained by ABM process on the DSM with related movements vectors calculated automatically (using a 10 pixel grid step). Bottom: Scatterplot between displacements obtained from the automatic
comparison of UAS and GNSS measurements on 40 points
The application of the matching algorithms to the elevation data has requested the use of a big image block. The level of detail of the DSM is not high enough to represent clearly the smaller blocks. In analogy with traditional image matching techniques, the area inside the matching template should not be “flat”, unless high uncertainties are considered acceptable. For this reason, the use of large templates is necessary to perform an accurate and reliable identification of the same areas on the two investigated raster. In all the tests performed a template size corresponding to a ground size of ca. 6÷10 m produced the best results.
The higher density of the vectors allows describing in more detail the dynamics of the surface, revealing significant movements also in areas which were not initially investigated (but that probably will be subject to monitoring in the future activities). The larger investigation area that can be analysed represents therefore an added value of the automatic DSM comparison procedure to the comprehension of the whole area surrounding the rock glacier.
CONCLUSIONS
The paper presented the first stages of a monitoring activity of an Italian rock glacier, devoted to the evaluation of the effects of climate change on permafrost masses, which lately have shown progressive destabilization and fast acceleration in their creep behaviour. In this context, the use of UAS cuts drastically the periodic monitoring costs, while allowing to acquire dense geometric data on the glacier shape. For instance, for future monitoring activities, the authors expect to perform the periodic surveys on a monthly basis, to better investigate the seasonal velocity changes, especially during the summer period. During the winter, being the rock glacier body completely covered by the snow, the proposed methodology cannot be applied and different techniques should be implemented (e.g. GNSS survey on large rock blocks). At this time, being such solutions very expensive, and expecting little or no movement in winter, the monitoring activities are planned only during the spring, summer and autumn seasons.
With the proposed methodologies, a very detailed description of the creep behaviour of the glacier can be produced, especially if automatic extraction techniques are employed. The first two monitoring campaigns (one in 2012, the other in 2014) provided important hints to be implemented in the next campaigns. Still, independent data acquisition to provide a check dataset and to evaluate the accuracy of the reconstruction of the DSM is required to provide proper validation of the technique even if the first tests showed a good agreement between UAS collected data and GNSS. Such activity is troublesome, requiring (e.g. the GNSS kinematic survey for the 48 displacements points) direct access of a human operator to the glacier area.
ACKNOWLEDGMENTS
This research has been partly supported by the Italian Ministry of University and Research within the project “FIRB - Futuro in Ricerca 2010” – Subpixel techniques for matching, image registration and change detection.
REFERENCES
Cardenal, J., Mata, E., Perez-Garcia, J., Delgado, J., Andez, M., Gonzalez, A., & Diaz-de-Teran, J. (2008). Close Range Digital Photogrammetry Techniques applied to Landslide Monitoring. International Archives of the Photogrammetry, Remote sensing and Spatial Information Sciences, Vol XXXVII. Part B8.
Casson, B., Baratoux, D., Delacourt, C., & Allemand, P. (2003). La Clapière landslide motion observed from aerial differential high resolution DEM. Eng. Geol., 68, 123-139.
Dall’Asta, E., & Roncella, R. (2014). A comparison of semiglobal and local dense matching algorithms for surface reconstruction. Int. Arch. Photogramm. Remote Sens. Spat. Inf. Sci, 40, 187-194.
Dall’Asta, E., Ghizzardi, V., Brighenti, R., Romeo, E., Roncella, R., & Spagnoli, A. (2015). New experimental techniques for fracture testing of highly deformable materials. The 5th International Conference on Crack Paths (CP 2015), Ferrara, Italy, 16-18 September, 2015.
Delaloye, R., Morard, S., Barboux, C., Abbet, D., Gruber, V., Riedo, M., & Gachet, S. (2013). Rapidly moving rock glaciers in Mattertal. GRAF, C. (Red.) Mattertal–ein Tal in Bewegung.
Publikation zur Jahrestagung der Schweizerischen Geomorphologischen Gesellschaft, 29, 21-31.
Deseilligny, M. P., & Clery, I. (2011). Apero, an open source bundle adjusment software for automatic calibration and orientation of set of images. ISPRS-International Archives of the Photogrammetry, Remote Sensing and Spatial Information Sciences, 38, 5.
Förstner, W. (1986). A feature based correspondence algorithm for image matching. International Archives of Photogrammetry and Remote Sensing, 26(3), 150-166.
Gruen, A., Adaptive least squares correlation – a powerful image matching technique, in S Afr J Photogrammetry Remote Sens Cartogr 14.3 (1985): 175–187.
Haeberli, W. (2013). Mountain permafrost - research frontiers and a special long-term challenge. Cold Regions Science and Technology, 96, 71-76.
Hirschmuller, H. (2005). Accurate and efficient stereo processing by semi-global matching and mutual information. In Computer Vision and Pattern Recognition, 2005. CVPR 2005. IEEE Computer Society Conference on (Vol. 2, pp. 807-814). IEEE.
Horn, B. K. (1981). Hill shading and the reflectance map. Proceedings of the IEEE, 69(1), 14-47.
Mikolajczyk, K; Tuytelaars, T; Schmid C; Zisserman, A; Matas, J; Schaffalitzky, F; Kadir, T; and Van Gool, L; (2005) A comparison of affine region detectors. IJCV 65(1/2):43-72, 2005
Mora, P., Baldi, P., Casula, G., Fabris, M., Ghirotti, M., Mazzini, E., & Pesci, A. (2003). Global Positioning Systems and digital photogrammetry for the monitoring of mass movements: application to the Ca’ di Malta landslide (northern Apennines, Italy). Eng. Geol., 68, 103-121.
PhotoScan, 2014. (last accessed May, 9th 2014) http://www.agisoft.ru/forum/index.php?topic=89.0
Re, C., Cremonese, G., Dall'Asta, E., Forlani, G., Naletto, G., & Roncella, R. (2012). Performance evaluation of DTM area-based matching reconstruction of Moon and Mars. SPIE Remote Sensing- International Society for Optics and Photonics, pp. 85370V-85370V.
Re, C., Roncella, R., Forlani, G., Cremonese, G., & Naletto, G. (2014). Evaluation of an Area-Based matching algorithm with advanced shape models. ISPRS-International Archives of the Photogrammetry, Remote Sensing and Spatial Information Sciences, 1, 215-221.
Wallis, K.F. (1976). Seasonal adjustment and relations between variables. Journal of the American Statistical Association, 69(345) pp. 18-31
![Figure 9. TopScatterplot between displacements obtained from the automatic : 2D Displacement [m] coloured map obtained by ABM process on the DSM with related movements vectors calculated automatically (using a 10 pixel grid step)](https://thumb-ap.123doks.com/thumbv2/123dok/3273264.1401363/6.595.307.535.69.483/topscatterplot-displacements-obtained-automatic-displacement-movements-calculated-automatically.webp)
