UNDERSTANDING THE PAST, MANAGING THE FUTURE
Remotely sensed analysis of the urban sprawl of Istanbul for supporting decision making for a sustainable future
Orhan Altan
1, Gerhard Kemper ²
1: Istanbul Technical University / Turkey
2: GGS - Geotechnik, Geoinformatik & Service GmbH, Speyer / Germany
KEY WORDS: Human Settlement, Change Detection, Understanding, GIS, Multitemporal, Geography
ABSTRACT:
The GIS based analysis of the land use change of Istanbul delivers a huge and comprehensive database that can be used for further analysis. Trend analysis and scenarios enable a view to the future that highlights the needs for a proper planning. Also the understanding via comparison to other cities assists in order not to copy errors from other cities. GIS in combination with ancillary data open a wide field for managing the future of Istanbul.
1.
BACKGROUND
A number of megacities have been analysed to quantify their growth in various international research projects. One of them was the “Moland” (Monitoring Landuse Dynamic) Project. Its aim was to compare more than 30 urban areas of Europe to understand common and specific key-actions that influence the how’s and why’s of the urban growth. The use of a standardized legend with more than 60 classes and the selection of a similar times window enabled a direct correlation of the results. Also the city of Istanbul has been selected for a project to detect and understand the growth of the city within the last 60 years. The years 1945, 1968, 1988 and 2000 were selected and aerial photographs, satellite photographs and satellite data evaluated in combination with ancillary data as maps, statistics and many more.
To achieve these results, image georeferencing, orthorectifi-cation, pansharping and many other tools of photogrammetry where used to get a geometric reliable data basis. Accuracy investigations are part of the quality management. The final extraction of homogenise land use pattern was done by manual digitizing and interpretation. However, also automatic classification methods have been tested and compared with the manual interpretation. A difficult task was the combination of spatial land-use data with ancillary data sources e.g. census information. Some interesting additional results were generated from this step. trend analysis are made in order to compare Istanbul in a world wide context of mega cities.
Te results, however, must become part of decision making and planning and management of Istanbul’s future. For what can these information and data be used?
First of all, as followed on the derived spatial database in GIS environment, city planning with the establishment of sustainable master plans is the logic next step. The trend
analysis and the estimation of sprawl axis assist to prevent Istanbul against an uncontrolled grow.
But also infrastructural development especially transport facilities is extremely important. Still, the construction of a public transport is far behind the actual needs. The trend of the urban sprawl gives information where and when infrastructural facilities are needed.
As a social aspect, the development inside the city is important to prevent Istanbul against social conflicts like ghettos, high contrast of poor and rich areas and slope of the social balance. We already can detect social misbalance in the urban structure. Istanbul is placed on a tectonically risky zone, earthquakes and tsunamis can hit the city and therefore a Disaster Management System is to be established. The actual urban structure, the information of the infrastructure, social aspects must become part of a crisis preparedness plan, a well trained disaster alert system and the final disaster management.
To have a good urban climate in Mega cities is a problematic task today. As a part of a sustainable development, most industrial plants have been moved to the suburb areas, however, they are again surrounded today by residential areas with high buildings that hamper the exchange of fresh air. The development trend, the urban structure in combination with meteorological models can assist to better the situation in future.
Cultural heritage is an important factor of Istanbul’s tourist business. The urban sprawl influences the environment of cultural heritage sites and can increase the risk of such objects. Changes of the silhouette already shows negative very clearly but also infrastructural facilities and air pollution create a negative influence on such objects. The risk that buildings create to damage on cultural objects due to bad construction in combination with earthquakes is another important factor. There are several more applications that can be presented to show, how GIS analysis on urban dynamics assist to understand the mechanism of urban sprawl and their influence on various activities of the cities development.
2.
LANDUSE DYNAMIC OF ISTANBUL
the land-use of Istanbul in 1945, 1968, 1988 and 2000 as the reference year. To reach this goal, the satellite imagery of the reference year 2000, satellite photographs of 1988 and aerial photos of the years 1968 and 1945 had to be pre-processed to get them properly georeferenced. The second step has been the digitisation and interpretation in GIS environment. In the final step the interpretation took place. Istanbul is growing enormous and the change is really dramatic. In relation to other European cities, Istanbul as a gate to the east and the Islamic world has a bridge function and a very specific development. The development went not homogenous. Especially between 68 and 88, grow has been the biggest. However the population growth has been high on a homogenous level, which means that the population density grew. The increase of urban fabric however needs to be compensated by other area, in the case of Istanbul similar to other big cities, by the loss of agricultural land. This will be pointed out in this paper. The total project area was 3100 km².
3.
DIGITALISATION AND
INTERPRETATION
All digitisation and interpretation work was done manually on-screen. Automatic processes for feature extraction in urban areas fail if such a detailed legendary is recommended.
Line-Layer: First the linear elements (lines and polylines), such as transportation (road and rail) and river/sea-canal network, have been mapped according the MOLAND legendary on screen by using TOPOL GISystem. topological data-structure has been used. Limit was given by the visibility in the satellite-imageries. More wide linear features have been digitised by a middle line and as far as they have a bigger width than 25 m, they have been mapped in the area-layer as well. The attribute database was opened after the line was drawn. Then the topological structure by creation of nod-points has been established. These lines are often boundaries for area-objects. So far they have been copied to the file with the area-database of the processed year.
Area-Layer: The lines and polylines of the line-layer have been used as basement for the area-layer (polygon with label-point). All other areas with a homogeneous use according to the legendary have been defined by the boundary-line and the labelling-point with the attached database in its middle. Also
here topological mapping was required to reduce the work and the risk, which can appear, by redundant lines. Also the snap-mode has been set to lines and vertex points in a suitable radius to fill entire project area without macro rest polygons. The database was filled during defining the label-point inside the boundary. An additional area-layer, a so-called 3d-layer, was added to take area objects into account, which cover other area objects. These are namely big bridges and highway tunnels. These elements are on one side connected correctly by the middle-line in the line layer and further on by a direct neighbourhood to a related object in the area layer. The snap mode has been enabled to snap to other, non-active layers as well to keep a semi-topological structure.
Temporal analyses have been undertaken by down-dating the land-use-classes of the 3 layers by going back-wards to 1988, 1965 and 1945. Finally 4 line layers, 4 area layers and 4 3d area-layers have been developed. Using database-analyses and GIS-intersections the changes can be detected and quantified. Fist the entire line layer had to be down-dated by the older images. Additional line-objects have been added and others been erased. The database had to be checked if the object attributes still fit to the legendary. Then the down-dated lines and the lines of the newer area layer have been imported into a new empty layer.
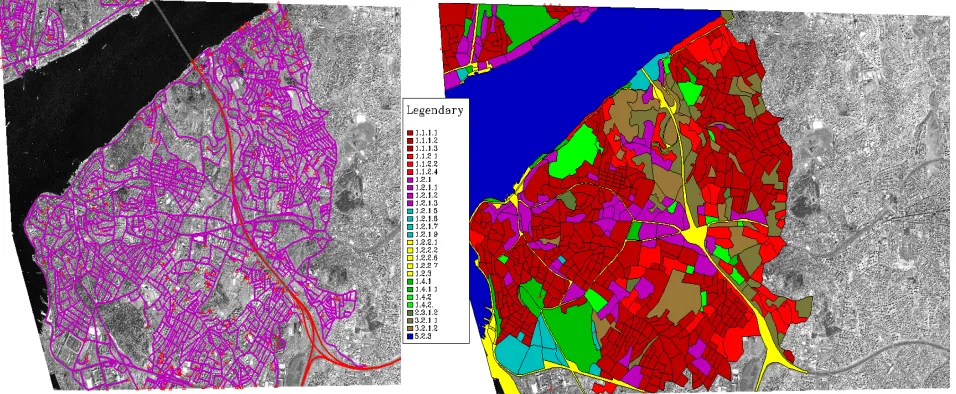
Figure 1: Example of the digitised transportation network on the left (Highways in red, other road in pink) and the lad-use data set on the right with the legendary of the classes (red = residential, pink = business)
0
The land-use change by groups of MOLAND Classes.
The following chapter will give some glance of the possibilities of statistical operations done on the land-use data of the different years. The figure 2 shows the main changes in different legendary-groups. Grow of residential area (urban fabric) is strong, mainly between 1968 and 1988. The same can be detected at the business area. In the same time the agricultural area lost space. Interesting is, that the forest shows an increase since 1988 after the loss before.
Figure 3: Grow of the different groups by linear time-scale and trend-graphs
Figure 3 shows the change from the agricultural land-use to the urbanised area of Istanbul. In the graphic has been made the time-scale linear to enable trend-analyses by using polynomial function of second degree. The trend however might be over-In the detailed study can be seen, that a big amount was in less dense residential areas, might be legalised Gecekondu area. The population grew as well but not as strong, the growth rate is smaller. After 1988 the situation changed. Both lines still have a strong increase, but at the residential surface it slows down meanwhile the population rate increases. This affects a higher density of the citizens in Istanbul.
0
Figure 4: Growth of population and residential surface.
More big buildings with bigger density have been built. These types of residences grow strong, similar to the population increase. By interpretation of the CHANGE-Data, key-areas of specific change can be detected and analysed. Such areas have a role for the development of the entire city and they are result of some specific human impact. A number of environmental indicators will be used to measure the sustainability of areas. They will be related to political keys, such as law-restrictions. Especially in Istanbul some change (road-construction) initiated the increase of “Gecekondu” areas.
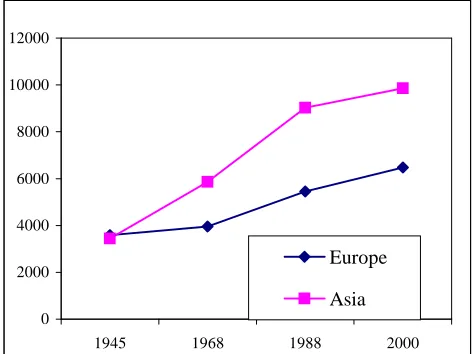
Figure 5: Length of the transportation network in km on the Asiatic and European side of Istanbul.
Figure 6: Example of a costal area at the Marmara Seaside SE of Istanbul in the year 1945 (left) and in the Year 2000 (right)
5.
TRENDS AND AXES OF THE
DEVELOPMENT
Figure 7: Estimated development up to the year 2020 by combined polynomial and linear regressions with smoothing and balancing to the total size
The shown trend analyses up to the year 2020 are based on a combination of a polynomial regression and a linear regression. Like seen in the past, the development of the 3 most changing groups, agricultural land, residential and business surface, did not went linear. The calculated values have been related to the size of the project area and to the more linear groups like forestry and water bodies. The trend however is a speculation but shows quite impressive the future of Istanbul. It fits also to the estimated trends of published statistics for the population grow. 14.5 Mio inhabitants are estimated from the water management Institute, that’s about 45% more than in the year 2000.
Table 1: The population grow estimated by the water-management institute (ISKI 1999)
Figure 8: Development up to the year 2020 out of the trend analysis
If we compare the population grow of 45.2% from 2000 to 2020, grow of urban fabric is with 44.3% similar however if we increase also the population density, it could be less. The growth of business areas counts 38%, which is realistic. If we think where the development goes, the table 1 indicates clearly that the Asiatic side will have a bigger increase than the European one.
Figure 9: The directions, where the increase might be orientated. The length of the arrows shows the intensity.
6.
ISTANBUL AND THE
MOLAND-CITIES
As mentioned before, the study on Istanbul was part of a wider project. All 25 “Moland” cities have reached during the study period their highest growth-rate within the last hundred years.
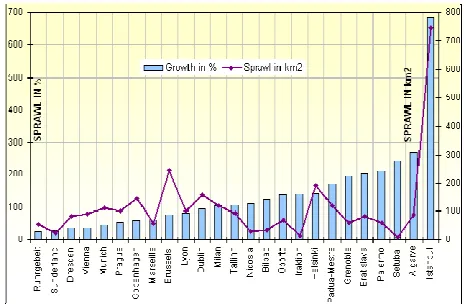
Figure 10: urban sprawl of “MOLAND”-Cities within the last 50 years.
Figure 10 clearly points out, how Istanbul’s growth relates to these cities. The difference is enormous. The relative growth is shown, measured on the urban surface between the newest and oldest year. With a sprawl of 680% and the biggest growth in absolute space, Istanbul is the “number one” of all MOLAND-cities.
Figure 11: absolute values within the last 50 years.
The reasons for Istanbul’s growth have been already discussed. All other cities are placed in a good developed environment and do not profit as much as Istanbul from the countryside. The contrast of a country placed at the threshold of development is one of the important reasons for its development in comparison to the others. So far, Istanbul should be compared to other cities with similar situation, but only for the MOLAND-cities the data are comparable by this method.
Finally, we should try to compare more in detail the absolute and relative changes among the cities’ developments. In figure 11, the absolute values are shown with the sorting done by the business areas. So far, Istanbul seems to be the busiest city in the MOLAND context. Indeed, this interpretation is only based on the used area but gives an idea on the financial power of such an area. The change also is of interest like seen on the values for the 50ies. Brussels was of this time the number one
and Istanbul on the 9th place. Also in residential surface
Istanbul is the number one in the 90ies meanwhile in the 50ies Istanbul is ranking on place 11. Regarding the change and the trend visible in the figure, Istanbul does not behave so much different than other cities, only the absolute change is at a higher level. Based on this fact we should have a look to the changes relative to the urbanised areas in the analysed years to point out the internal structure of the cities to compare them.
Figure 12: values on “MOLAND”-Cities for residential areas related to the urbanised area.
Figure 13: loss of agricultural land in “MOLAND”-cities
Regarding the urban growth, we have to compare the lost areas, which in most cases are taken from the agricultural land. An overview is given in figure 13, which points out Istanbul on a high level of agricultural loss. The percentage is computed by the lost area in relation to the size of agricultural land in the 50ies. So far the absolute size in the oldest period is an important fact for this result. Strongly agricultural structured areas and the size of the study area influence these results. If we regard the absolute values, Istanbul has with a loss of 562 ha in average 5 times higher level than the others. In some other cases the loss was also compensated by natural area, depending what is available for urban development in the analysed area.
Figure 14 points out more clearly where the urban area was placed in. In nearly all cases the agricultural land was the main source for the urbanisation. There are only a few exceptions like Setubal in a growth from urban structures into agriculture area and parallel from nature land to agriculture as well. Might be that agriculture in this area was given up due to small parcel sizes. This reason might be in other cases as well basis for the strong loss of agricultural land. Lyon as an example based the urbanisation fully on agricultural land. Urbanisation based only on natural area cannot be found here. There is no city, where agriculture was not touched anyway.
Figure 14: land-use transformation in “MOLAND”-cities
7.
ISTANBUL IN RELATION TO
TURKISH AND NEIGHBOURING CITIES
Figure 15: Growth of inhabitants of neighbouring agglomerations on logarithmic scale, based on Data of the World Urbanisation Prospects - Revision 2003
Many of the selected cities have a similar growth; especially Istanbul and Cairo correlate on similar absolute level. Athens stopped its growth at the end of the 70ies while Thessaloniki decelerates the population growth at the same time. Yerevan, Sofia, Baku and Tbilisi show the collapse of socialism in their countries since end of 80ies as a negative trend due to a re-privatisation of the agricultural lands and a flight from the cities. The cities in Israel stop their internal growth at the end of the 80ies, but they profit from the socialistic break down in the former Soviet-Union and received a new impulse of immigrants, clearly to be seen in the graphic. Therefore, these cities are excluded from the further analyses. Grouping the cities related of the state of development would result in the statement that many of these cities can be seen as indicator for a threshold country. But first a look at the growth-rates of these cities should be done to compare the results independent from their absolute size.
Figure 16: Annual growth-rates of the neighboured agglomerations, based on Data of the World Urbanisation Prospects - Revision 2003
a relatively constant development, which documents a sustainable change. Compared to the international Mega-cities’ growth, (see Figure 15 and 16), the annual growth-rate is smaller in average.
There can be found strong changes in the growth-rate for nearly every city initiated by political or social impacts, which cannot discussed in detail in this study. For Istanbul it will be done in the Turkish context, for some others it was mentioned already. Surprising, however, is the growth of Mosul/Iraq, with a homogeneous rate-change in the last decades and the highest-level forecasted for 2015. For Egypt-cities and for former Soviet-Union cities an increase in the annual rate is expected.
It can be said that in the prognosis, all the cities observed will become more similar with an average annual growth-rate of about 2%. Exceptions are Tbilisi, Sofia, Yerevan, Athens, Thessaloniki and Baku. Except of the two cities in Israel that grow by ongoing immigration, all analysed cities are part of the Islamic world in the near east and developing towards to become industrialised and well developed.
What is the situation like in Turkey itself and Istanbul as its business centre? Figure 17 shows, based on the data of the World’s urbanisation Prospect 2003, the 6 biggest cities in Turkey. Referring to figure 9 and 10 of the introduction of this study, these cities belong to the most densely populated regions in Turkey. They are centres for immigration of the hinterland,
Figure 17: Annual growth-rates of Turkish agglomerations, based on Data of the World Urbanisation Prospects - Revision 2003
During the last 50 years, Istanbul’s growth-rate was on similar level as all cities are and this seems to continue like this in future. Between 1960 and 1975, strong changes in the annual growth-rate of all the cities can be detected. The industrialisation in Izmir was strong and lead to a high growth-rate around 1965. Istanbul and Bursa had a similar increase in kind of changing trends to one of the cities and vice versa.
Adana, as a strong developing industrial but more a touristic region, has been profiting from foreign investments since 1980. Gaziantep however does not show such extreme changes; this city develops with small industry and agricultural production on irrigated land, supported by state water management with dams. Ankara as the most Turkish administrative city, profits only indirectly from industrialisation and shows the trends in a smoothed way.
The strongest growing city, prognosticated for the future, is Bursa. Since 1995, it has been the fourth biggest city in Turkey. Of all the analysed six cities, Istanbul will have the smallest annual growth in the year 2015.
8.
ISTANBUL AND THE WORLD
Prospect of the United Nations. They include real data from the year 2003 and estimate the population for the year 2005. The years 2010 and 2015 are calculated using the population growth index. To keep the overview in the graphic, Tokyo was excluded from this graphic due to its extremely high number of inhabitants of more than 36 million people. The remaining top 25 agglomerations are listed in this figure while the other cities mentioned in a previous period have been one of these top 25. One difficulty in such data is the fact that the areas of the demographic data are not precisely defined. In some cases the city is taken into account, in other cases a wider region is used for the analyses. In some cases, net of big cities included in one study object was used as basis. On the other side, we find Istanbul relatively small to the data used in the previous chapter. In the graphic only the city is analysed, not the Istanbul district. As already discussed, the urban area of Istanbul crosses the district border but does not fill the entire administrative district in the north and west. Due to such administrative divergences, especially between different countries, absolute values have to be interpreted carefully. Nevertheless, the change of the population highlights the dynamic of cities in developed, underdeveloped and threshold countries.represents the lack of administrative activities. Such impact from the administrative side can be seen in the curve of Chinas cities. To extract the population growth, the annual population growth rate was extracted from the data shown in figure 18.
Figure 19: The population growth rate of the biggest and strongest growing agglomerations. (Data from UN 2004 in: UN - World Urbanization Prospects)
The main intention is to compare the trends. Analyses of the absolute values are difficult due to different methods used and their related data. Even in summarised analyses of the world’s Mega cities development, bigger agglomerations are placed beside single cities. This makes absolute evaluation of those sources impossible.
Figure 19 shows the relation of Istanbul to other rapid growing cities using the annual growth-rate. If, what is done often by demographic studies, the growth-rate is related to the degree of development, Istanbul is similar to South American agglomerations and the cities of Teheran, Calcutta, Cairo and Manila. This might be a mirror image of the city as a socio-economic object. Istanbul is able to compete by socio-economic means with South American cities. Of course, it is difficult to balance this precisely; many other facts influence growth too. Istanbul is definitely a threshold-city by demographic means with a good step forward to become a developed one. As already seen in the chapters before, there are many strong economic developments in Istanbul, but there is still a lack of administrative management to do the final step.
9.
RISK-MAPPING
As one example, how ancillary data in combination with GIS might assist in crisis preparedness, the following risk map was extracted from the existing data source. To balance the final risk, data of the geoscientific survey and research, hydrological models and land-use data must be combined with the 3D data to achieve a spatial risk-estimation. The combination with demographic data or at least the modelled distribution of such information with urban structural analysis gives a good approximation of a Tsunami Risk-Level as shown below. The map above was generated using data of the Moland project
in combination with demographic data and terrain models
classified for Tsunami run-up simulations. Even these estimations are relatively simple and not very precise, it makes the risk level clearly visible. Like that, the area of Büyükcekmece covers residential areas on low-levelled terrain that finally can affect 30,000 people by a Tsunami since they live in the red coloured zone as shown in Figure 6. Such risk maps easily can indicate city planners where risk-factors must be taken into account or at least to define clear rules for constructing objects in these risky regions.
Maps as shown above also support the Crisis Management Team to detect sensitive parts of the city and assist them in defining ways to access these areas for helping the people.
Figure 20: areas of a certain run-up risk for Tsunamis overlaid with land-use data and population density of residential areas.
9.1 References
ALTAN, O., KEMPER, G., LAVALLE, C., DEMICHELI, L., (2002): MOLAND – monitoring land-use changes for the city of Istanbul. International conference of the ISPRS-Commission 7, Hyderabat / India.
CELIKOYAN, M. / ALTAN, M.O. / KEMPER, G. (2004): Accuracy Investigation for a Large-Scale GIS. - XXth Congress of the ISPRS, Istanbul.
HEITNER, K.L. (1969): A mathematical Model for calculation of the Run-up of Tsunamis. Pasadena, California
KASANKO, M. / LAVALLE, C. / DEMICHELI, L. / MCCORMICK, N. / NIEDERHUBER, M. (2000): The MOLAND method as a decision-making support tool in urban management. - Second
International Conference on Decision making in Urban and Civil Engineering. Lyon, France, 20-22 November 2000.
KEMPER G. / ALTAN, O. / LAVALLE, C. / DEMICHELI, L (2002): Die Landnutzungs-Entwicklung von Istanbul 1945-2000. - Angewandte Geographische Informationsverarbeitung XIII – Agit 2002, Wichmann, Heidelberg.
KEMPER G. (2005): Tools of photogrammetry, Remote-Sensing and Geo-Information-Systems - The world between
Developers and Endusers. – Congress on Remote Sensing Arabia, Riyadh 2005.
KEMPER, G. / ALTAN, O. / CELIKOYAN, M. (2005) Tsunami-Gefährdungskarte für Istanbul. – Angewandte Geographische Informationsverarbeitung XI – Agit 2005, Wichmann, Heidelberg
LAVALLE, C. / MCCORMICK, N. / KASANKO, M. / DEMICHELI, L. / BARREDO, J.I. (2003): Monitoring and forecasting the dynamics of European urban areas - The territorial approach as key for urban development strategies. - Urbanistica, 121,105-111, 2003.
YILDIZ TECHNICAL UNIVERSITY (ed.) (2000): International Mediterranean Project – Integration of Ground Truth & Spaceborne Sensor Data with a GIS for Coastal Zone Management of the Turkish Mediterranean Coasts. – ESA demonstration Project final Report, MM.XXSF, March 2000.