LAND-USE AND LAND-COVER DYNAMICS MONITORED BY NDVI MULTITEMPORAL
ANALYSIS IN A SELECTED SOUTHERN AMAZONIAN AREA (BRAZIL)
FOR THE LAST THREE DECADES
D. Borini Alves a*, F. Pérez-Cabello a, M. Rodrigues Mimbrero a,
* Corresponding author. a
University of Zaragoza (UNIZAR), Department of Geography and Spatial Management, and Aragon University Research Institute in Environmental Science (IUCA), Zaragoza, Spain –[email protected], [email protected], [email protected]
KEY WORDS: NDVI, multitemporal dynamics, Landsat series, fire, deforestation, Brazilian Amazon.
ABSTRACT:
This study aims to analyse the dynamics of land-use and land-cover (LULC) in a selected southern Amazonian area (Brazil), monitoring and distinguishing trajectories in NDVI (Normalized Difference Vegetation Index) variations for the last three decades. The area, with a total of 17336 km², has been subject to significant LULC changes associated with deforestation progress and use of fire. Considering available Landsat time series, it was selected an image per year from 1984 to 2013 (path/row -231/66), at a particular period of year, atmospherically corrected using LEDAPS tools. NDVIs values were generated for each selected image. Furthermore, the images of 1984 and 2010 still underwent a classification of LULC differentiate five categories: water, forest, secondary/degraded forest, savannah/pasture and crop/bare soil. The trajectories in NDVI variation values were analysed by R software, considering intersections of classified categories. The pixels identified as forests on the images of 1984 and 2010 displayed stable trajectories of NDVI values, with average value 0.824 and coefficient of variation 3.9%. While the pixels of savannah/pasture, which was periodically affected by fire, had an average NDVI value 0.585 and coefficient of variation 15,1%.The main regressive trajectory was the transition “forest to crop/bare soil", identifying 1999 as the starting point in the drop in NDVI values, associated with an increase of the deforested areas. Therefore, the results show distinct trajectories associated with NDVIs and LULC changes that assist in better understanding the dynamics of ecological processes and the human impacts operating in the area.
1. INTRODUCTION
In recent decades, the southern Brazilian Amazon experienced increases in the dynamics of land use and land cover (LULC) associated with the expansion of crop and pasture areas, road and communication network construction, and population density growth (Espindola et al., 2012; Morton et al., 2006; Nepstad et al., 2001). This dynamics results in pressure on forest resources in the area due to the advance of deforestation, degradation and intensive use of fire (Aragão et al., 2008; Lima et al., 2012; Vasconcelos et al., 2013).
To monitor and better understand the dynamics of ecological processes and human impacts related to these changes in LULC, remote sensing data represents an essential source of analysis , allowing to generate systematic information in most different spatial and temporal scales (Nagendra et al., 2013). Two of the most important initiatives monitoring deforestation and fires in the Brazilian Amazon, the Assessment of Deforestation in Brazilian Amazonia (PRODES) (INPE, 2014a) and the Queimadas project (INPE, 2014b), have fundamental remote sensing data base to scale and generate information on the use of fire and deforestation in this area, contributing to the area management process.
Regarding remote sensing techniques, the generation of vegetation indexes calculated from the combination of spectral bands stands out (Bonham, 2013; Turner et al., 2003).Also, the NDVI (Normalized Difference Vegetation Index) is one of the most used index. NDVI relates spectral information of the red
and near infrared generating a variable able to estimate quantity, quality and development of vegetation (Pettorelli et al., 2005).
To calculate this index, it is possible to count on lifting decades of satellite sensor information, which highlights the potential of the Landsat time series (Devries et al., 2015; Ding et al., 2014; Du et al., 2010; Maxwell and Sylvester, 2012; Zheng et al., 2015). This time series provides free access to an extensive gallery of relevant temporal and spatial resolution images, widely used and validated in scientific research in remote sensing.
In this context, this study aims to analyze the dynamics LULCs in a particular southern Amazonian area in Brazil, monitoring and distinguishing trajectories in NDVI variations considering the period between 1984 and 2013. We explore the continuity of Landsat series data to generate vegetation indexes that help to understand the spatial dynamics of the selected area.
1.1 Study area
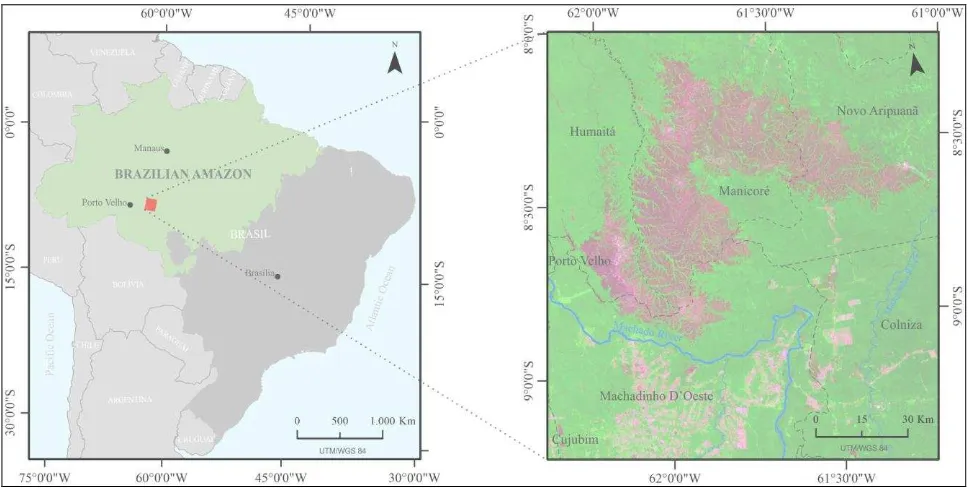
The area covers 17336 km² and is located in the sou thern Brazilian Amazon (Figure 1), including cities of Amazonas state (Nova Aripuanã, Manicoré and Humaitá), Rondônia state (Machadinho d'Oeste, Cujubim and Porto Velho) and Mato Grosso state (Colniza). The main river that crosses the area is Machado River and belongs to Madeira River basin.
Figure 1. Study site location (red polygon) in the south of Brazilian Amazon (green polygon in the left map). In the right map, the municipal division of the study area on a clip image Landsat ETM+ (path/row-231/66, composition RGB-643) of August 28, 2013.
The study area currently consists of some regions of agro-pastoral activities, natural conservation areas (including a part of the Campos Amazônicos National Park) and indigenous lands. In zones of agro-pastoral activities, pastures with cattle creations and grain crops predominate, using fire as the main form of management.
In terms of phytogeographic composition, the study area has a savannah vegetation enclave area (Ratter et al., 2003) in a predominant Amazon biome area. The savannah area, locally identified as cerrado , displays grasses and shrubs (ICMBio, 2011), while the Amazon area presents tree species from rain forests, typical of the Amazon forest. Thus, this savanna-forest interface results in an area of high biological diversity.
The climatic conditions of the region have high annual average temperatures, ranging between 24°C and 28°C, and an annual rainfall of up to 2000 mm, with the presence of a dry period extending from May to October. However, variations of the dry season may happen in certain years. For example, remote sensing techniques registered, spatially and temporally, the effects of regional climate phenomena El Niño, the Pacific Decadal Oscillation and the Atlantic Multidecadal Oscillation (Marengo et al., 2011, 2008; Phillips et al., 2009).
During the dry period, hot pixel detections reveled an intensive use of fire for the management of agro-pastoral practices (Silvestrini et al., 2011). The use of fire tended to increase exponentially with the decrease of rainfall related to the dry season (Aragão et al., 2008).
This region has experienced significant LULC changes in the last decades associated with deforestation progress and use of fire as a main management instrument to the agro-pastoral practices. The main reason for these changes is the fact of being located in the midst of the agricultural frontier zone in a large area known as ‘arc of deforestation’ of Brazilian Amazon.
2. METHODOLOGY
2.1 Data select and preparation
Considering available Landsat time series, download at <http://glovis.usgs.gov/>, we selected an image per year (Table 1) from 1984 to 2013 (path/row - 231/66). All images belong to a particular time of year associated with the dry season in the study area, between the end of June and the end of August. The maximum daily difference of the selected images to the time series is 78 days between the images of 10/09 (2009) and 23/06 (1992).
Regarding our image selection criterion, we considered that the better pixel quality (based on the information provided by the supplier), the lower percentage cloud cover and the closer to the end of the dry season.
We gave priority to the later images on dry period seeking the maximum of the dynamic information in a given year and reducing stationary phenological effects of multitemporal analysis. This is because the closer images to the early dry season record more vigorous vegetation stages most often associated with high rainfall rates in the remaining months of the year (Kobayashi and Dye, 2005).
Year Sensor/day-month Year Sensor/day-month 1984 L5-TM/04-08 1999 L7-ETM+/06-08 1985 L5-TM/07-08 2000 L5-TM/15-07 1986 L5-TM/10-08 2001 L7-ETM+/11-08 1987 L5-TM/12-07 2002 L7-ETM+/27-06 1988 L5-TM/14-07 2003 L5-TM/24-07 1989 L5-TM/01-07 2004 L7-ETM+/19-08 1990 L5-TM/04-07 2005 L5-TM/30-08 1991 L5-TM/07-07 2006 L5-TM/16-07 1992 L5-TM/23-06 2007 L5-TM/04-08 1993 L5-TM/26-06 2008 L5-TM/06-08 1994 L5-TM/15-07 2009 L5-TM/10-09 1995 L5-TM/03-08 2010 L5-TM/27-07 1996 L5-TM/05-08 2011 L5-TM/30-07 1997 L5-TM/23-07 2012 L7-ETM+/09-08 1998 L5-TM/24-06 2013 L7-ETM+/28-08
Table 1. Selected Landsat TM/ETM+ images, path/row-231/66.
For those images that had cloud cover (1987, 1989, 1990, 1991, 1993, 1996, 1997, 2002, 2005, 2009, 2011) we generated a mask from an unsupervised classification to each image held by the ERDAS Imagine software.
We applied 3x3 pixels order filters to the ETM+ selected images dated after 2002 and which showed the failure of the SLC (Scan Line Corrector). The filters were applied six times to each image and filled the gaps using the information of the neighboring pixels.
2.2 Data process and analysis
Using ERDAS Imagine we generate NDVIs values for each selected image (from 1984 to 2013), relating the bands 3 and 4 of TM and ETM+ Landsat images considering the radiometric equivalence of the two instruments (Teillet et al., 2001).
We chose images of 1984 and 2010 to classify the LULC for the two most extreme dates within the time series, both from the same sensor (TM), without cloud cover and good pixel quality. We excluded the image from 2011 from the classification because it had cloud cover. Classification of images from 2012 and 2013, from the ETM + sensor, was hampered by filling the gap of SLC off.
The selected images underwent a supervised classification of LULC using the operator maximum likelihood to differentiate five categories:
* Forest (F) – areas of dense rain forest or open rain forest. The last one more associated with forest drainage channels galleries in the savannah’s enclave area.
* Secondary/degraded forest (Fs) – regenerated forests or in advanced process of regeneration, as well as areas of degraded rainforests. It also includes some savanna areas with denser shrub domain.
* Savannah/pasture (SP) – areas of vegetation grasses and shrubs, largely used as areas of creation of extensive cattle on pastures. * Crop/bare soil (CB) – includes a ranching and crop farming areas, with large harvested zones, viewed as bare soil. It also includes burned areas to crop/pastures usage.
* Water (W) –areas of rivers and small water reservoirs located in certain pastures and agricultural areas.
This classification was validated by measuring the Cohen kappa index to each classified image, comparing with a base of control points. The cloud masks were applied to the NDVI images associating a nodata value for these cloud pixels. The trajectories in NDVI variation values were analyzed by R
statistical software, in a sample of random points covering 3% of the area, with a total of 792411 points.
This analysis divides the main intersections of the classified categories into two groups: regressive/progressive NDVI trajectories and stable NDVI trajectories. Thanks to monitoring of the NDVI trajectories for the period between 1984 and 2013, we generated average, standard deviation and coefficient of variation for each pixel group according to the intersection of thematic classes. A break point detection was calculated for the progressive/regressive trajectories using a non-parametric approach (Pettitt, 1979).
3. RESULTS AND DISCUSSION
3.1 LULC dynamics between 1984 and 2010
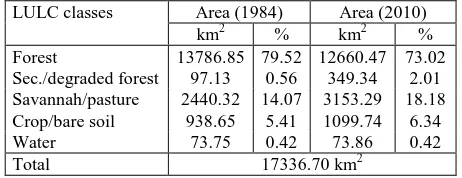
The result of the classification process (Table 2) (Figure 2) allows a spatial configuration of the dynamics of the LULC in recent decades. Validation with a Cohen kappa index shows values of 0.84 and 0.86 to 1984 and 2010 classifications respectively.
Rain forest is the class that occupies the highest proportion of area in relation to others in both classified dates. In 1984 occupied 79.52% of the total area and 73.02% in 2010. The savanna/pasture areas extended 2440 km2 in 1984 and gained 4.11% of the area, occupying 18.18% of the total area in 2010.
It is noteworthy that in 1984 we observed higher levels of impact of human activities within the savanna enclave area. Recently burned area for pasture management might be identified in the crop/bare soil class.
Among the LULC changes, we mainly identify the loss of forest areas associated with the advancement of agricultural areas and pastures in the southern half of the study area during the analyzed period. In quantitative terms, 563 km2 of forest became crop/bare soil in 2010, and 471 km2 became savannah/pasture.
The analysis records the loss of 1124 km2 of forest between 1984 and 2010. This total is compatible with the data recorded by Assessment of Deforestation in Brazilian Amazonia (PRODES) (INPE, 2014a), which between 2001 and 2010 records 1069 km2 of deforested areas.
Furthermore, occupation of secondary and degraded forests between 1984 and 2010 increased 1.45%. Currently, they occupy 349.34 km2. In 1984, these regions were scattered in the northeast and southwest of the study area and were mainly associated with degraded zones reflecting the selective logging. In 2010, these degraded areas expanded and some areas of forest regeneration appeared thanks to the abandonment of certain areas and the creation of protected areas.
LULC classes Area (1984) Area (2010)
km2 % km2 %
Forest 13786.85 79.52 12660.47 73.02 Sec./degraded forest 97.13 0.56 349.34 2.01 Savannah/pasture 2440.32 14.07 3153.29 18.18 Crop/bare soil 938.65 5.41 1099.74 6.34
Water 73.75 0.42 73.86 0.42
Total 17336.70 km2
Table 2. LULC dynamics between 1984 and 2010.
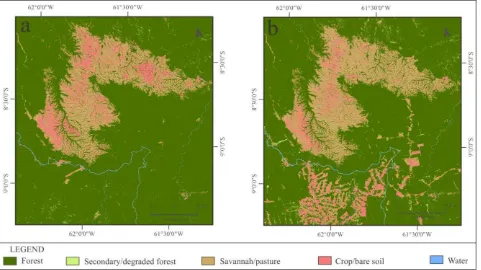
Figure 2. LULC classification of 1984 (a) and 2010 (b).
3.2 Monitoring NDVI trajectories (1984-2013)
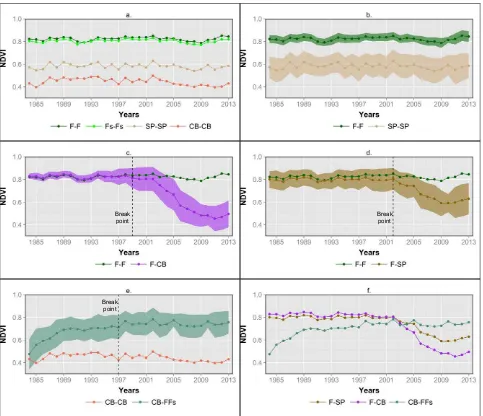
In order to monitor the LULC dynamics identified in the previous step, we generate NDVI values on a yearly basis over the last three decades (1984-2013). For these trajectories, major intersections associated with the classification process were grouped as follows:NDVI stable trajectories; NDVI regressive or progressive trajectories.
We identify as stable trajectories of NDVI those pixels where no LULC was detected: 'Forest to Forest' (FF); 'Sec./degraded forest to Sec./degraded forest' (Fs-Fs); 'Savannah/pasture to Savannah/pasture' (SP-SP); and 'Crop/bare soil to Crop/bare soil' (CB-CB).
On the other hand regressive or progressive NDVI trajectories were associated to the following LULC changes: ‘Forest to Savannah/pasture’ (F-SP); ‘Forest to Crop/bare soil’ (F-CB); and ‘Crop/bare soil to Forest and Sec./degraded forest’ (CB-FFs).
3.2.1 NDVI stable trajectories: Each trajectory is located in specific interval of NDVI values (Figure 3a), according to the characteristics of its thematic category. F-F and Fs-Fs displayed their trajectory standing close to 0.80 NDVI values, linked to a good vegetation development. The average NDVI of SP-SP trajectory is slightly higher than the CB-CB, with values of 0.63 and 0.54, respectively.
We observe that the trajectories of SP-SP and CB-CB fluctuate more intensely than the FF and Fs-Fs values. In part, this variability is associated to increased sensitivity of these classes to phenological effects, as their most outstanding peaks (1987, 1994, 1998 and 2002) can also be perceived in F-F trajectory. Moreover, CB-CB and SP-SP are periodically affected by the intensive use of fire, used as a management tool for agro-pastoral activities.
These factors influence the variability in both SP-SP and CB-CB, making it even higher than F-F’s. These differences are explicit when comparing F-F and SP-SP trajectories (Figure 3b), according to the reported standard deviation. F-F displayed the most stable trajectory of NDVI values, with an average value of 0.824 and a coefficient of variation of 3.9%. While the pixels of SP-SP, which was periodically affected by fire, had an average NDVI value 0.585 and coefficient of variation 15.1%.
3.2.2 NDVI regressive/progressive trajectories: F-CB trajectory (Figure 3c) revealed that during the first 13 years average NDVI values stand close to those from the F-F trajectory (mean values of 0.828).
After 1997 an increase in standard deviation values is observed, suggesting certain level of pressure on forested areas. In 1999, identified as break point of the trajectory (Pettitt, 1979), the average NDVI values begin to distance themselves from the F-F values. This detachment is consolidated in 2003, following gradually, provided with increased participation of CB class of pixels associated with deforestation. The average NDVI values are 0.482 in 2010, associated with the CB class.
Splitting the years into two periods 1984-2002 and 2003-2013, the average of F-CB NDVI values changed respectively from 0.821 to 0.556. This regressive trajectory is associated with 563 km2 of forests that became CB in 2010, identified in the classification process.
Figure 3. NDVI stable trajectories (a); Variability of F-F and SP-SP trajectories; (b); F-CB trajectory compared to F-F trajectory (c); F-SP trajectory compared to F-F trajectory (d) CB-FFs trajectory compared to CB-CB trajectory (e); NDVI regressive/progressive trajectories (f). The lines represent the average NDVI values. Maximum and minimum limits of the filled areas are the average added and subtracted
to their respective standard deviations. Break points, according Pettitt (1979), are marked on the regressive/progressive trajectories.
Many pixels forest included in this theme category are associated with areas of forest-savannah interface, which contributes to the increased sample variability from the beginning of the time series. The breakpoint identified for this regressive trajectory is set in 2002, where the descents gradually expand in the following years. This regressive trajectory is associated with 471 km2 of forests that became SP in 2010.
The progressive trajectory identified (Figure 3e) in the time series is associated with the combination of categories of CB and a grouping of categories of Forest and Sec./degraded forest (FFs). In this trajectory, the NDVI values start with an average value of 0.475, starting to increase gradually in the following years. The breakpoint identified is the year 1997, where the average NDVI was already performing 0.712. From 1997 until 2013, it is observed that this group of pixels keeps the average stable without reaching the levels of FF NDVI. This progressive trajectory is a minor trend within the area. Is related to the gain of 18 km2 FFs in 2010, replacing areas classified as CB in 1984.
All of these regressive/progressive trajectories (Figure 3f) display information about the LULC changes operating on the study area.
4. CONCLUSION
The results show distinct trajectories associated with NDVIs and LULC dynamics that assist in better understanding the dynamics of ecological processes and the human impacts operating in the area.
In the stables NDVI trajectories, is possible observe different temporal behaviours depending on vegetation type. Forests have proved to be the most stable community according to its NDVI values. On the other hand, we detected high sensitivity in savannah-type vegetation (scrubs, grasslands and pastures) to disturbances such wildfire or climatic/phonological effects.
NDVI multitemporal analysis has proved to be a useful tool allowing detecting and monitoring LULC changes. In this Break
point
Break point
Break point
particular case, combining NDVI monitoring and change point detection procedures, made possible to identity an increase in the deforestation process, mainly affecting rain forest communities, starting 15 years ago and becoming more intense over time.
It is worth to stand out the current potential of Landsat products since Landsat 8 satellite, launched in 2013, guarantees their continuity. This fact allows enhancing valuable multitemporal analysis and monitoring of remote areas.
ACKNOWLEDGEMENTS
This work is supported by a grant from the CAPES Foundation (Brazil) awarded to the first author.
REFERENCES
Aragão, L.E.O.C., Malhi, Y., Barbier, N., Lima, A., Shimabukuro, Y.E., Anderson, L., Saatchi, S., 2008. Interactions between rainfall, deforestation and fires during recent years in the Brazilian Amazonia. Philosophical transactions of the Royal Society of London, 363, 1779–85.
Bonham, C.D. (Colorado U., 2013. Measurements for Terrestrial Vegetation, 2nd ed. John Wiley & Sons, Ltd, Oxford, UK.
Devries, B., Verbesselt, J., Kooistra, L., Herold, M., 2015. Remote Sensing of Environment Robust monitoring of small-scale forest disturbances in a tropical montane forest using Landsat time series. Remote Sensing of Environment, 161, 107– 121.
Ding, Y., Zhao, K., Zheng, X., Jiang, T., 2014. Temporal dynamics of spatial heterogeneity over cropland quantified by time-series NDVI, near infrared and red reflectance of Landsat 8 OLI imagery. International Journal of Applied Earth Observation and Geoinformation, 30, 139–145.
Du, H., Cui, R., Zhou, G., Shi, Y., Xu, X., Fan, W., Lü, Y., 2010. The responses of Moso bamboo (Phyllostachys heterocycla var. pubescens) forest aboveground biomass to Landsat TM spectral reflectance and NDVI. Acta Ecologica Sinica, 30, 257–263.
Espindola, G.M. de, Aguiar, A.P.D. de, Pebesma, E., Câmara, G., Fonseca, L., 2012. Agricultural land use dynamics in the Brazilian Amazon based on remote sensing and census data. Applied Geography, 32, 240–252.
ICMBio, Instituto Chico Mendes de Conservação da
Bioiversidade., 2011. Plano de Manejo - Parque Nacional dos Campos Amazônicos, Brasília, Brazil.
INPE, Instituto Nacional de Pesquisas Espaciais, 2014a. PRODES: assessment of deforestation in Brazilian Amazonia. São José dos Campos, Brazil
http://www.obt.inpe.br/prodes/index.html.
INPE, Instituto Nacional de Pesquisas Espaciais, 2014b. Queimadas project. São José dos Campos, Brazil http://www.cptec.inpe.br/queimadas/.
Kaufman, Y.J., Wald, A.E., Remer, L. a., Gao, B.-C.G.B.-C., Li, R.-R.L.R.-R., Flynn, L., 1997. The MODIS 2.1 channel-correlation with visible reflectance for use in remote sensing of aerosol. IEEE Transactions on Geoscience and Remote Sensing, 35, 1286–1298.
Kobayashi, H., Dye, D.G., 2005. Atmospheric conditions for monitoring the long-term vegetation dynamics in the Amazon using normalized difference vegetation index. Remote Sensing of Environment, 97, 519–525.
Lima, A., Silva, T.S.F., Aragão, L.E.O. e C. de, Feitas, R.M. de, Adami, M., Formaggio, A.R., Shimabukuro, Y.E., 2012. Land use and land cover changes determine the spatial relationship between fire and deforestation in the Brazilian Amazon. Applied Geography, 34, 239–246.
Marengo, J.A., Nobre, C.A., Tomasella, J., Oyama, M.D., Oliveira, G.S. de, Oliveira, R. de, Camargo, H., Alves, L.M., Brown, I.F., 2008. The Drought of Amazonia in 2005. Journal of Climate, 21, 495–516.
Marengo, J.A., Tomasella, J., Alves, L.M., Soares, W.R., Rodriguez, D.A., 2011. The drought of 2010 in the context of historical droughts in the Amazon region. Geophysical Research Letters, 38, 1–5.
Masek, J.G., Vermote, E.F., Saleous, N.E., Wolfe, R., Hall, F.G., Huemmrich, K.F., Gao, F., Kutler, J., Lim, T., 2006. A Landsat Surface Reflectance Dataset for North America, 1990-2000. IEEE Geoscience and Remote Sensing Letters, 3, 68–72.
Maxwell, S.K., Sylvester, K.M., 2012. Identification of “ever -cropped” land (1984-2010) using Landsat annual maximum NDVI image composites: Southwestern Kansas case study. Remote Sensing of Environment, 121, 186–195.
Morton, D.C., DeFries, R.S., Shimabukuro, Y.E., Anderson, L.O., Arai, E., Espirito-Santo, F. del B., Freitas, R., Morisette, J., 2006. Cropland expansion changes deforestation dynamics in the southern Brazilian Amazon. Proceedings of the National Academy of Sciences of the United States of America , 103, 14637–41.
Nagendra, H., Lucas, R., Honrado, J.P., Jongman, R.H.G., Tarantino, C., Adamo, M., Mairota, P., 2013. Remote sensing for conservation monitoring: Assessing protected areas, habitat extent, habitat condition, species diversity, and threats. Ecological Indicators, 33, 45–59.
Nepstad, D., Carvalho, G., Barros, A.C., Alencar, A., Capobianco, J.P., Bishop, J., Moutinho, P., Lefebvre, P., Silva Jr., U.L., Prins, E., 2001. Road paving , fire regime feedbacks , and the future of Amazon forests. Forest Ecology and Management, 154, 397–407.
Pettitt, A.N., 1979. A non-parametric approach to the change-point problem. Journal of the Royal Statistical Society. 28, 126–135.
Phillips, O.L., Aragão, L.E.O.C., Lewis, S.L., Fisher, J.B., Lloyd, J., López-González, G., Malhi, Y., Monteagudo, A., Peacock, J., Quesada, C.A., Heijden, G. Van Der, Almeida, S., Amaral, I., Arroyo, L., Aymard, G., Baker, T.R., Bánki, O., Blanc, L., Bonal, D., Brando, P., Chave, J., Oliveira, Á.C.A. de, Cardozo, N.D., Czimczik, C.I., Feldpausch, T.R., Freitas, M.A., Gloor, E., Higuchi, N., Jiménez, E., Lloyd, G., Meir, P., Mendoza, C., Morel, A., Neill, D.A., Nepstad, D., Patiño, S., Peñuela, M.C., Prieto, A., Ramírez, F., Schwarz, M., Silva, J., Silveira, M., Thomas, A.S., Steege, H., Stropp, J., Vásquez, R., Zelazowski, P., Dávila, E.A., Andelman, S., Andrade, A., Chao, K., Erwin, T., Fiore, A. Di, C, E.H., Keeling, H., Killeen, T.J., Laurance, W.F., Cruz, A.P., Pitman, N.C.A., Vargas, P.N., Ramírez-Angulo, H., Rudas, A., Salamão, R., Silva, N., Terborgh, J., Torres-Lezama, A., 2009. Drought Sensitivity of the Amazon Rainforest. Science (80 ). 323, 1344–1347.
Ratter, J.A., Bridgewater, S., Ribeiro, J.F., 2003. Analysis of the floristic composition of the Brazilian cerrado vegetation: comparison of the woody vegetation of 376 areas. Edinburgh J. BotEdinburgh Journal of Botany, 57–109.
Silvestrini, R.A., Soares-Filho, B.S., Nepstad, D., Coe, M., Rodrigues, H., Assunção, R., 2011. Simulating fire regimes in the Amazon in response to climate change and deforestation. Ecological Applications, 21, 1573–1590.
Teillet, P., Barker, J., Markham, B., Irish, R., Fedosejevs, G., Storey, J., 2001. Radiometric cross calibration of the Landsat-7 ETM+ and Landsatt-5 TM sensors based on tandem data sets. Remote Sensing of Environment, 78, 39–54.
Turner, W., Spector, S., Gardiner, N., Fladeland, M., Sterling, E., Steininger, M., 2003. Remote sensing for biodiversity science and conservation. Trends in Ecology and Evolution, 18, 306–314.
Vasconcelos, S.S. de, Fearnside, P.M., Graça, P.M.L. de A., Dias, D.V., Correia, F.W.S., 2013. Variability of vegetation fires with rain and deforestation in Brazil’s state of Amazonas. Remote Sensing of Environment, 136, 199–209.
Vermote, E.F., El Saleous, N., Justice, C.O., Kaufman, Y.J., Privette, J.L., Remer, L., Roger, J.C., Tanré, D., 1997. Atmospheric correction of visible to middle-infrared EOS-MODIS data over land surfaces: Background, operational algorithm and validation. Journal of Geophysical Research, 102, 17131.
Zheng, B., Myint, S.W., Thenkabail, P.S., Aggarwal, R.M., 2015. A support vector machine to identify irrigated crop types using time-series Landsat NDVI data. International Journal of Applied Earth Observation and Geoinformation, 34, 103–112.