MERGING AIRBORNE LIDAR DATA AND SATELLITE SAR DATA
FOR BUILDING CLASSIFICATION
T. Yamamoto, M. Nakagawa
Dept. of Civil Engineering, Shibaura Institute of Technology, 3-7-5Toyosu, Koto-ku, Tokyo, Japan - (h10082, [email protected])
Commission IV / WG 7
KEY WORDS: Urban Sensing, Building Extraction, Building Classification, Airborne LiDAR, Satellite SAR, Data Fusion
ABSTRACT:
A frequent map revision is required in GIS applications, such as disaster prevention and urban planning. In general, airborne photogrammetry and LIDAR measurements are applied to geometrical data acquisition for automated map generation and revision. However, attribute data acquisition and classification depend on manual editing works including ground surveys. In general, airborne photogrammetry and LiDAR measurements are applied to geometrical data acquisition for automated map generation and revision. However, these approaches classify geometrical attributes. Moreover, ground survey and manual editing works are finally required in attribute data classification. On the other hand, although geometrical data extraction is difficult, SAR data have a possibility to automate the attribute data acquisition and classification. The SAR data represent microwave reflections on various surfaces of ground and buildings. There are many researches related to monitoring activities of disaster, vegetation, and urban. Moreover, we have an opportunity to acquire higher resolution data in urban areas with new sensors, such as ALOS2 PALSAR2. Therefore, in this study, we focus on an integration of airborne LIDAR data and satellite SAR data for building extraction and classification.
1. INTRODUCTION
A frequent map revision is required in GIS applications, such as disaster prevention and urban planning. In general, airborne photogrammetry and LiDAR measurements are applied to geometrical data acquisition for automated map generation and revision. In the airborne photogrammetry, a geometrical modeling and object classification can be automated using color images. Stereo matching is an essential technique to reconstruct 3D model from images. Recently, structure from motion (SfM) is proposed to generate 3D mesh model from random images (Uchiyama, 2014). Although, object classification methods are automated using height data estimated with stereo matching and SfM, it is difficult to recognize construction materials, such as woods and concrete. The construction materials are significant attribute data in building modeling and mapping. Therefore, ground survey and manual editing works are required in attribute data classification.
In the LiDAR measurements, modeling and object classification are also automated by a point cloud segmentation (Sithole, 2003). The intensity data assist the object classification (Antonarakis, 2008). Moreover, data fusion approaches are proposed using aerial images and LiDAR data. These approaches focus on improvement of modeling accuracy and processing time (Uemura, 2011). However, these approaches classify geometrical attributes.
On the other hand, although geometrical data extraction is difficult, SAR data have a possibility to automate the attribute data acquisition and classification. The SAR data represent microwave reflections on various ground surfaces and buildings. There are many researches related to monitoring activities of disaster, vegetation, and urban. Moreover, we have an opportunity to acquire higher resolution data in urban areas with new sensors, such as ALOS2 PALSAR2 (Japan Aerospace
2.1 Building footprint extraction
Building footprints are extracted from DSM, as shown in Figure 2.
Figure 2. Process flow of building footprint extraction
DSM generated from point cloud data for building footprint extraction. Firstly, building edges are detected using height differences between building roofs and ground surfaces from DSM with a 3 × 3 operator. Although the building edges are discontinuous, approximate building features are detected in this step. Secondary, building boundaries are extracted. Discontinuous edges are connected to each other in the DSM with 8-neighborhood pixel filtering. The connected edges are defined as a building boundary. Thirdly, segmentation is applied to each region inside of the building boundary to refine building footprints. Although extracted region includes many noises, such as bridges, street trees, and automobiles, an approximate geometry of each region is extracted in this step. Finally, the region segments are filtered with their perimeter and area to extract building footprints. An example of the building extraction is shown in Figure 3.
Figure 3. Example of building extraction
2.2 Building classification
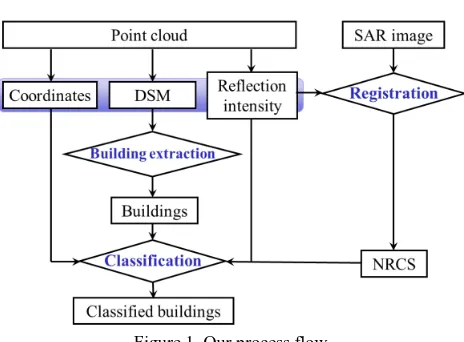
Our process flow of building classification is shown in Figure 4.
Figure 4. Process flow of building classification
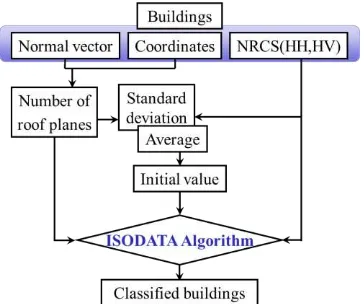
In this study, buildings are classified into several groups with non-supervised classification. Two types of approaches are applied to our building classification. The first approach is a building classification based on roof materials with an average value of NRCS in each polarimetric SAR images. The second approach is a building classification based on geometrical segments taken from LiDAR data. Roof shapes have clear features in the classification. The number of roof planes is estimated for building classification with height information and normal vector of point cloud, as shown in Figure 5.
Figure 5. Building classification
3. EXPERIMENT
3.1 Study area
We selected Toyosu and Monzennakacho areas in Tokyo as our study area. These areas include various types of buildings, such as residential houses, high-rise buildings and shopping malls, as shown in Figure 6.
Figure 6. Study area
3.2 Data specification
We prepared point cloud data acquired with an airborne LiDAR and geocoded satellite SAR data, as shown in Table 1 and Table 2. Moreover, threshold values were used in building extraction, as shown in Table 3.
Table 1. Specification of LiDAR data
Table 2. Specification of SAR data
Observer Date Spatial
resolution Geocoded
Polarized wave
JAXA
20, March,
2009
12.5m Map
North HH, HV
Table 3. Threshold values
Step 1 Step 2 Step 3 Step 4
Height 2 m ±0.2 m 2 m ---
Area --- --- --- 200 pixels
Perimeter --- --- --- 10000 pixels
Perimeter/area --- --- --- 0.35
3.3 Registration
In a registration between SAR and LiDAR data, corresponded points are required to be extracted from each datum. Although SAR and LiDAR data have different indices, we can recognize road intersections, rivers, and bridges as feature points in manual. An example of corresponded points between SAR and LiDAR data is shown in Figure 7.
Figure 7. Example of corresponded points
Before a feature extraction procedure, two types of orthoimages were prepared as follows. Firstly, digital number (DN) of SAR image was converted into an orthoimage of NRCS. We used the following transformation formula with calibration factor (CF). We substituted -83 for the CF (ALOS User Interface Gateway, 2009).
NRCS(dB)=10×log10(DN2)+CF (1)
Next, the other orthoimage was generated from reflection intensity values taken from LiDAR point cloud data. In this procedure, the reflection intensity values were projected into DSM generated from LiDAR data, as shown in Figure 8 and Figure 9.
We selected several corresponding points, such as road intersections, rivers, and bridges, from each orthoimage. Moreover, the affine transformation was applied to the image registration between SAR and LiDAR data.
Figure 8. DSM
Figure 9. Reflection intensity orthoimage
4. RESULTS
4.1 Building extraction
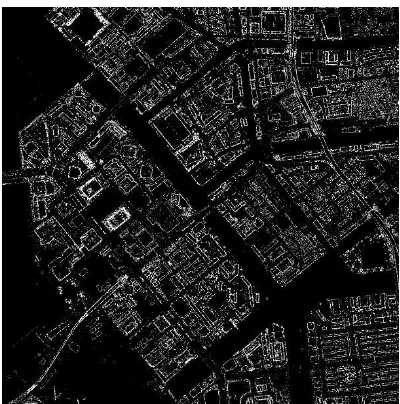
First, Figure 10 shows a result in the step 1. White edges indicate extracted building boundaries with height differences. Next, Figure 11 shows a result in the step 2. Dilated white edges indicate refined building boundaries. Figure 12 shows a result in the step 3. White regions indicate extracted building footprints. Figure 13 shows a result in the step 4.
Figure 11. Result in the step 2
Figure 12. Result in the step 3
Figure 13. Result in the step 4
4.2 Building classification
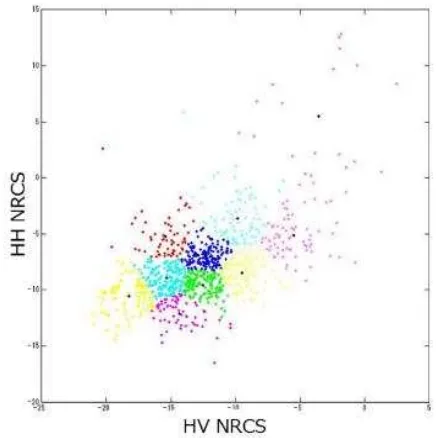
We extracted 911 buildings from DSM. Our result after the building classification based on ISODATA clustering of NRCS values is shown in Figure 14. The vertical axis indicates HH NRCS values, and the horizontal axis indicates HV NRCS values. Classified buildings with NRCS values are projected into an orthoimage, as shown in Figure 15.
Figure 14. Building classification result using NRCS values (1)
Figure 15. Building classification result using NRCS values (2)
Figure 16. Building classification result using NRCS values and the number of roof segments (1)
Figure 17. Building classification result using NRCS values and the number of roof segments (2)
5. DISCUSSION
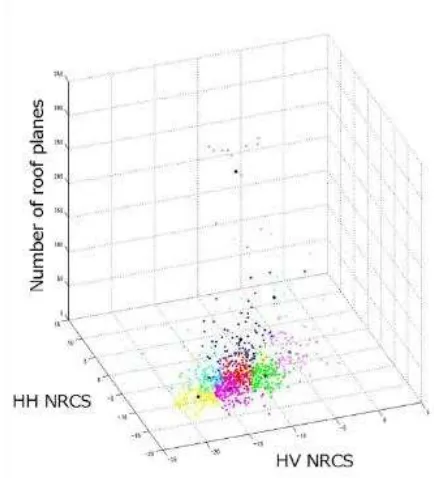
Classified buildings using NRCS values in each cluster is shown in Figure 18. Classified buildings using NRCS and the number of roof segments is shown in Figure 19. In Figure 18 and 19, vertical axis indicates the number of roof segments, and horizontal axis indicates cluster numbers.
Figure 18. Classification with NRCS values in each cluster
Figure 19. Classification with NRCS and the number of roof segments in each cluster
In the classification with NRCS values, we have confirmed that spatial resolution was too low to recognize small residential buildings and complex roofs of large buildings. In our experiment, the supervised classification in the building extraction was affected by speckle noises. Therefore, we would propose a speckle noise filtering before the classification. In the classification with NRCS and the number of roof segments, large buildings with complex roofs were extracted. Although we focused on building roofs, we can focus on an opportunity to acquire more detailed building features from aerial LiDAR data. We would improve our classification with a wall surface estimation and smaller object recognition, as shown in Figure 20.
In our experiment, although visual checks were required to determine the best threshold values, buildings were extracted from DSM in our object extraction procedure. Moreover, several small noises such as automobiles were left as unknown objects in the DSM. We can focus on a semantic approach using road connections to improve our feature extraction accuracy. Additionally, although shadow detection is required, we can focus on a combination of LiDAR data with aerial images. In general, SAR has several problems, such as alayover, radar shadow, and foreshortening. They are caused by undulating grounds. In this study, SAR data were strongly affected by their problem. However, when we use dense point cloud data, we can recognize ground surface in detail. Therefore, we have a possibility to avoid these problems. Moreover, cardinal effect can be analysed using 3D geometrical data generated from point cloud data.
6. CONCLUSION
In this paper, we have focused on an integration of LiDAR with SAR data to achieve the frequent map update with attribute data acquisition. Firstly, we generated DSM from point cloud acquired with airborne LiDAR. Secondary, the DSM was registered the SAR data to overlay with NRCS calculated from the SAR data. Thirdly, buildings are extracted from the DSM. Finally, we classified buildings in the DSM into several clusters. In our experiment, we prepared point cloud data acquired with an airborne LiDAR and satellite SAR data acquired with ALOS PALSAR in Tokyo. Next, we extracted 911 buildings from DSM. Although our result included noises such as bridges and automobiles, we classified buildings into 10 clusters with average NRCS values. In this study, we clarified that a combination of airborne LiDAR data and satellite SAR data can extract and classify buildings in urban area. In our future works, we will apply the supervised clustering with a semantic approach to improve our classification accuracy.
REFERENCES
Antonarakis, A, S., Richards, K, S., Brasington, J., 2008. Object-based land cover classification using airborne LiDAR, Remote Sensing of Environment, Volume 112, Issue 6, pp. 2988-2998.
ALOS User Interface Gateway 2009 PALSAR Calibration Factor Updated
http://www.eorc.jaxa.jp/en/about/distribution/info/alos/2009010 9en_3.html (21 Jan 2014)
Haala, N., Kada, M., 2010. An update on automatic 3D building reconstruction, ISPRS Journal of Photogrammetry and Remote Sensing Volume 65, Issue 6, pp. 570-580.
Japan Aerospace Exploration Agency, 2014. Advanced Observing Satellite-2 “DAICHI-2” (ALOS-2). http://global.jaxa.jp/projects/sat/alos2/ (27 Jul 2013)
Sithole, G., Vosselman, G., 2003. Automatic structure detection in a point-cloud of an urban landscape, Remote Sensing and Data Fusion over Urban Areas. 2nd GRSS/ISPRS Joint Workshop on, pp. 67-71.
Tupin, F., Roux, M., 2003. Detection of building outlines based on the fusion of SAR and optical features, ISPRS Journal of Photogrammetry and Remote Sensing Volume 58, Issue 1–2, pp. 71–82.
Uchiyama, S., Inoue, H., Suzuki, H., 2014. Approaches for Reconstructing a Three-dimensional Model by SfM to Utilize and Apply this Model for Research on Natural Disasters, Volume 81, pp. 37-60.
Uemura, T., Uchimura, K., koutaki, G., 2011. Road Extraction in Urban Areas using Boundary Code segmentation for DSM and Aerial RGB images, Journal of The Institute of Image Electronics Engineers of Japan, Volume 40, No.1, pp. 74-85.
Zhang, K., Yan, J., Chen, S., 2006. Automatic construction of building footprints from airborne LIDAR data, IEEE
Transactions on Geoscience and Remote Sensing, Volume 44, No. 9, pp. 2523-2533.
ACKNOWLEDGMENT
![BADAN LINGKUNGAN HIDUP PROVINSI SULAWESI BARAT [Paket Penyedia].](data:image/gif;base64,R0lGODlhAQABAIAAAP///wAAACH5BAEAAAAALAAAAAABAAEAAAICRAEAOw==)