i
MONITORING THE IMPACT ON POND PRODUCTIVITY
FROM LEARNING AT THE COASTAL FIELD SCHOOL
2016-2019
REPORT ON FIRST YEAR (2016)
SK REKTOR NO : 1040/UN7.P/HK/2-16
Dr. Ir Sri Rejeki, MSc
Tita Elfitasari, SPi, MSc, PhD
Restiana Wisnu Ariyati SPi, MSi
Lestari Lakhsmi Widowati, SPi, MPi
Roel H. Bosma, PhD, Wageningen UR
AQUACULTURE DEPARTEMENT
FACULTY OF FISHERIES AND MARINE SCIENCES
DIPONEGORO UNIVERSITY
iii
ABSTRACT
The monitoring of aquaculture farmers by the UNDIP/WUR-team aims to assess the progress towards reaching the goals set by the project Building with Nature – Demak. As planned in this first year the sample was taken in one village: Tambakbulusan. As farmers implemented the learning from the Coastal Field Schools during the same season as the training was given, no baseline for this sample was measured. In the village six ponds were monitored during one cropping season; we report on five ponds as one of the ponds was the demonstration pond on which Blue Forest will report.
Before stocking the ponds were dried for at least 5 days and composted goat manure was mixed to the sediment. Thereafter an good dosage of home-made organic fertilizer was added to improve water quality; during the culture period a smaller dose was added weekly to maintain the plankton growth in the pond. The farmers prepared the organic fertilizer (compost), called MOL, from fermented rotten fruits, vegetables and household waste. One farmer used an industrial compost and another fed manufactured pellets; thus the five farmers implemented partly the promoted LEISA technology.
Several of the cropping cycles couldn’t be completed due to heavy rains or flooding. The ponds were restocked. Some ponds were harvested early to avoid risk of mortality due to increase of salinity of shrimp showing disease symptoms. Other water quality parameters were within the limits for recommended limits for shrimp culture.
iv
TABLE CONTENT
Content Page
Abstract ii
Table Content iii
List of Table iv
1 Introduction 1
2 Method 2
3 Material 4
4 Result 7
4.1. Pond A 7
4.2. Pond B 8
4.3. Pond C 10
4.4. Pond D 11
4.5. Pond E 13
5 Comparison of the result with baseline and project goals 15
6 Conclusion 17
References
Annex A. The Dissolved Oxygen in the water at different eater salinity and temperature at 760 mmHg air pressure
18
Annex B. The Pond water Colour Chart (Brackish Water Research Centre
19
Annex C. The water quality parameter 20
v
LIST OF TABLE
Content Page
1. The schedule of UNDIP monitoring team at the first cycle of cultivation at Tambakbulusan Village
2
2. Water quality parameters measuring methods, equipment, locations and frequencies used for the monitoring.
3
3. The dimensions of the five ponds monitored in 2016 4
4. The management practices of Pond A 5
5. The management practices of Pond B 5
6. The management practices of Pond C 5
7. The management practices of Pond D 6
8. The management practices of Pond E 6
9. The measured water quality, including the plankton abundancy, of Pond A 7
10. The operational cost of pond A (0.06 ha) per cycle (*1,000 IDR). 8
11. The mortality, yield and revenue from sales (*1,000 IDR) of pond A for one cycle.
8
12. The water quality parameters, including the plankton abundancy, of pond B 9
13 The operational cost of Pond B (0.5 ha) for one cycle (*1,000 IDR) 9
14 The mortality, yield and revenue from sales (*1,000 IDR) of pond B for one cycle.
15 The water quality parameters, including the plankton abundancy, of pond C 10
16 The operational cost of Pond C (0.5 ha) for one cycle (*1,000 IDR) 11
17 The mortality, yield and revenue from sales (*1,000 IDR) of pond C for one cycle.
11
18 The water quality parameters, including the plankton abundancy, of pond D 13
19 The operational cost of Pond D (0.5 ha) for one cycle (*1,000 IDR) 13
20 The mortality, yield and revenue from sales (*1,000 IDR) of pond D for one cycle.
14
21 The water quality parameters, including the plankton abundancy, of pond E 14
22 The operational cost of Pond C (0.5 ha) for one cycle (*1,000 IDR) 15
23 The mortality, yield and revenue from sales (*1,000 IDR) of pond C for one cycle.
vi
24 The dosage of fertilizer and feed used, and products and yield of the five ponds.
16
25 Overview and average of the operational cost and the revenue (*1,000 IDR) of the five ponds (A to E) monitored
18
C-1 The daily monitoring water quality done by farmer A. 21
C-2 The daily monitoring of water quality of pond B, used to culture Monodon Shrimp
23
C-3 The daily monitoring water quality done in Pond C (same farmer as B) for Vannamei Shrimp
25
C-4 The data daily collected on water quality in Pond D 27
C-5 The daily monitoring water quality done in Pond E 29
D-1 The characteristics of the demonstration pond of the CFS in 2016. 31
D-2 Water quality parameters monitoring 32
D-3 Operational Cost (*1000 IDR) of demonstration pond for one cycle. 32
D-4 The Mortality, Yield, Revenues (*1000 IDR) of the demonstration pond for one cycle
33
D-5 The daily monitoring water quality done by the farmer at demonstration pond
1
1. INTRODUCTION
Erosion along the northern coast of Java, Indonesia, after the destruction of mangrove forest for brackish water ponds is causing the loss of land and livelihoods. This environmental issue worsened due to ground-water extraction and climate change impacts. Demak District, Central Java, is one of the areas where brackish water pond production, i.e. shrimp and milk fish, provided a source of wealth for the local community, after an era of prosperity from irrigated rice cultivation. Furthermore, the improper management of intensive shrimp culture in the brackish water ponds resulted in decreasing quality of the ponds and thus decreasing yields in the last decade. In 2015, the average production from extensive aquaculture is only 200 kg/ha/year of milkfish and 43 kg/ha/year of white leg, tiger and local shrimps. The sustainable development of brackish water pond culture is threatened as these yields are insufficient to invest in coastal protection. The project Building with Nature (BwN) Demak aims to restore coastal protection and sustainable livelihoods supporting this protection. The target is to increase the yield and net income generated from aquaculture with more than 50%.
One of the reasons of the decreasing aquaculture production in Demak, according to previous assessments, was the limited application of aquaculture technology. In the framework of a collaborative project BwN-Demak the NGO Blue Forest trains farmers through the farmer field school approach in so-called Coastal Field Schools (CFS) on good management practice in aquaculture, and a team of UNDIP-FPIK is in charge of monitoring the achievements targeted by the project. Under guidance of the teams the farmers compared three low cost improvements in their culture practice, with their customary practice. After having recovered some capital the farmers can experiment more intensive aquaculture technologies.
2
2. METHOD
The CFS was carried out in five villages; due to budget restrictions the monitoring in the first year will be done for one village only. A purposive random sampling method was applied to select 5 ponds belonging to farmers who had been learning at the CFS at Tambak Bulusan village. A sixth ponds was monitored but this one was used as the demonstration pond for the CFS and was not included in the calculations (the collected data are given in Annex D).
Water quality monitoring and discussion with fish farmers at Tambak Bulusan village were carried out 12 times. During each visit the team did sampling and measurements, verified the monitoring sheet filled out by the farmers, and discussed the results with the farmers.
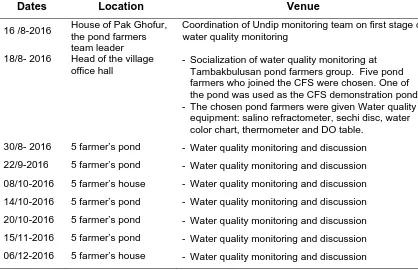
Table 1. The schedule of UNDIP monitoring team at the first cycle of cultivation at Tambakbulusan Village
Dates Location Venue
16 /8-2016 House of Pak Ghofur, the pond farmers team leader
Coordination of Undip monitoring team on first stage of water quality monitoring
18/8- 2016 Head of the village office hall
- Socialization of water quality monitoring at Tambakbulusan pond farmers group. Five pond farmers who joined the CFS were chosen. One of the pond was used as the CFS demonstration pond. - The chosen pond farmers were given Water quality
equipment: salino refractometer, sechi disc, water color chart, thermometer and DO table.
30/8- 2016 5 farmer’s pond - Water quality monitoring and discussion
22/9-2016 5 farmer’s pond - Water quality monitoring and discussion
08/10-2016 5 farmer’s house - Water quality monitoring and discussion
14/10-2016 5 farmer’s pond - Water quality monitoring and discussion
20/10-2016 5 farmer’s pond - Water quality monitoring and discussion
15/11-2016 5 farmer’s pond - Water quality monitoring and discussion
06/12-2016 5 farmer’s house - Water quality monitoring and discussion
The farmers were requested to observe, monitor and take notes three times a day: early morning, noon and afternoon, on several water quality variables (Table 2). Dissolved oxygen (DO) was measured weekly by the UNDIP team, when taking samples to analyse TAN, Phosphate and Nitrate. The monitoring was done at the first cycle of farming from July to November 2016.
3
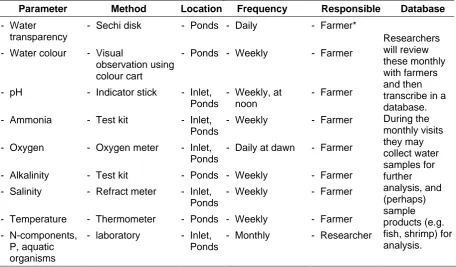
Table 2. Water quality parameters measuring methods, equipment, locations and frequencies used for the monitoring.
Parameter Method Location Frequency Responsible Database - Water
* Farmers will be given a ledger with forms and carbons. The UNDIP team will assist in stocking and harvest to improve data quality whenever possible.
DO in the water is a water quality parameter that should be monitored by the pond farmer daily. However, a DO meter is too expensive for most small pond farmers. Therefore, the UNDIP team provided the DO table from which the farmers can read the DO at different water salinity and temperature at the air pressure of 760 mmHg (Stirling, 1985; Annexe A).
The water colour chart is a method to indicate the fertility of the pond water (Annex B). This monitoring is needed to recognise the development of algae’s that favour disease out- break.
Data on Operational cost, yield and revenue were collected. The Gross margins was calculated using the following formula:
Gross margin = Income from sales – Operational cost.
The calculation of the net margin would require the accounting of the investment cost, i,e, the value of the pond. The benefit cost ratio (B/C) was calculated as the ratio:
4
3. MATERIAL
The monitoring was done in five pond belonging to four famers of the fish farmer group participating at the CFS. The four farmers who owned and managed these ponds were: Pak H. Shokipin, Pak Ghofur, Pak Kasmudi, and Pak Musafak.
These four pond farmers confirmed to practice their knowledge from the CFS to make probiotic (organic fertilizer) and to manage the pond as follows:
1. Probiotic made of fermented vegetables and fruits wastes. The local name of probiotic produce by the pond farmers is “MOL”. The MOL ingredient is:
- 20 kg of rotten fruits , 5 kg of rice bran bran, - 5 kg of banana stalk, 3 liter of sugar cane water,
- 7 pieces (approximately 50 gram). All ingredients were put in the in a barrel submerged with water and kept for 2-3 weeks.
- Once white foam emerged then the liquid fertilizer is ready. Application depends on the quantitity needed. The MOL was applied to the pond prior the cultivation.
2. Stocking
- The stocking of the shrimp post larvae was done at least of pond management when the natural food or phytoplankton starts growing.
- To promote sustainable growth of the natural feed, additional MOL application 30 liter per week for at least 1 month, afterwards 5 L of MOL was added every 5 days depends on the water color condition. If water are clear, it indicate that natural feed supply is decreasing, which means that liquid fertilizer is needed. Entering the second month, fertilizer are given 20 L every 3 days.
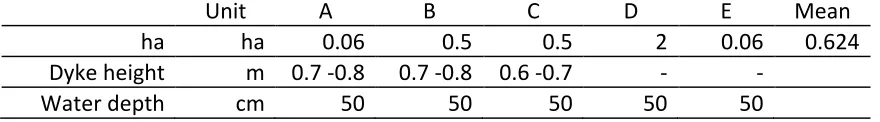
The monitored ponds have different sizes (Table 3); the average area was slighty more than 0.6 ha. All ponds are too shallow for optimal shrimp culture. The farmer’s management practices are presented in Tables 4 to 8. Pond B and C are owned by the same farmer in Tambakbulusan. Not all farmers stocked milkfish but all stocked shrimp, either tiger shrimp (P. monodon) or white leg shrimp (L. vannamei).
Table 3. The dimensions of the five ponds monitored in 2016.
Unit
A
B
C
D
E
Mean
ha
ha
0.06
0.5
0.5
2
0.06
0.624
Dyke height
m 0.7 -0.8
0.7 -0.8 0.6 -0.7
-
-
5 Table 4: The management practices of Pond A.
- Production management system - Extensive
- Water circulation system - Only one gate for water inlet and outlet
depended on the water colour
- Cultivated organisms - Vannamei shrimp
- The stocking density of the shrimp - 30.000 of PL 15
- Date of stocking - 25 July 2016
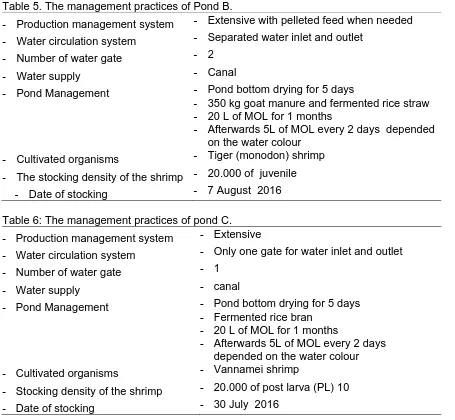
Table 5. The management practices of Pond B.
- Production management system - Extensive with pelleted feed when needed - Water circulation system - Separated water inlet and outlet
- Number of water gate - 2
- Water supply - Canal
- Pond Management - Pond bottom drying for 5 days
- 350 kg goat manure and fermented rice straw - 20 L of MOL for 1 months
- Afterwards 5L of MOL every 2 days depended on the water colour
- Cultivated organisms - Tiger (monodon) shrimp
- The stocking density of the shrimp - 20.000 of juvenile
- Date of stocking - 7 August 2016
Table 6: The management practices of pond C. - Production management system - Extensive depended on the water colour
- Cultivated organisms - Vannamei shrimp
- Stocking density of the shrimp - 20.000 of post larva (PL) 10
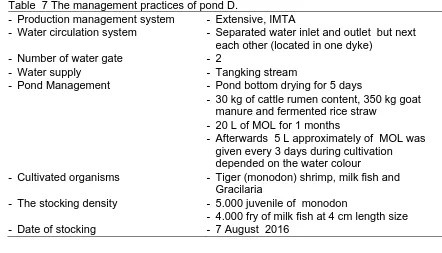
6 Table 7 The management practices of pond D.
- Production management system - Extensive, IMTA
- Water circulation system - Separated water inlet and outlet but next each other (located in one dyke)
- Number of water gate - 2
- Water supply - Tangking stream
- Pond Management - Pond bottom drying for 5 days
- 30 kg of cattle rumen content, 350 kg goat manure and fermented rice straw
- 20 L of MOL for 1 months
- Afterwards 5 L approximately of MOL was given every 3 days during cultivation depended on the water colour
- Cultivated organisms - Tiger (monodon) shrimp, milk fish and
Gracilaria
- The stocking density - 5.000 juvenile of monodon
- 4.000 fry of milk fish at 4 cm length size
- Date of stocking - 7 August 2016
Table 8. The management practices of pond E.
- Production management system - Semi-intensive culture with pelleted feeding - Water circulation system - Only one gate for water inlet and outlet
- Number of water gate - 1
- Water supply - Canal
- Pond Management - Pond bottom drying for 5 days
- goat manure
- Cultivated organisms - Vannamei shrimp
- Date of stocking - 25 June 2016 (this 1st stocking was lost)
- First week of September (Second stocking)
- The stocking density First stocking:
7
4. RESULT
In this chapter, first we present the results for all five ponds. Thereafter we summarize and compare, before concluding.
The ammonia concentration in all ponds remained below 0.5 mg/L.
4.1. Pond A
Pond A was chosen because the owner was an alumni of CFS. He confirmed to be eager to improve his pond production.
The shrimp was harvested on 2 September, the yield was 150 kg / 600m2, approximately 2,500 kg/ha at average individual body weight of 12.5 gram approximately The mortality rate was ± 20%.. The price of the shrimp yield was Rp60.000/kg, Actually, the harvesting time was too early because at that time the heavy raining lead to flood and decreased the salinity sharply. Therefore, the farmer harvested the shrimp immediately to prevent total lost.
The results of the daily monitoring done by the farmer are shown in Annex C-1. The weekly monitoring confirmed that the water quality parameters were good until 15 November (Table 9). The dark green water color on 16-18 August 2017 indicated that the phytoplankton grew adequately, yet, addition of fertilizer was needed. At the end of August the water color changed to brownish green. This indicated that phytoplankton, especially Chaetoceros spp grew well. On 13 September, the abundancy of phytoplankton and zooplankton were 2,9 x 10⁴ and 2,4 x 10³, respectively; The first would indicate an eutrophic water condition, while the second indicated a mesotrophic water condition. On 20 November, both the phytoplankton and the zooplankton abundancy were slightly lower, but the ratio was favorable (Table 9)
Table 9. The measured water quality, including the plankton abundancy, of Pond A.
Date
8
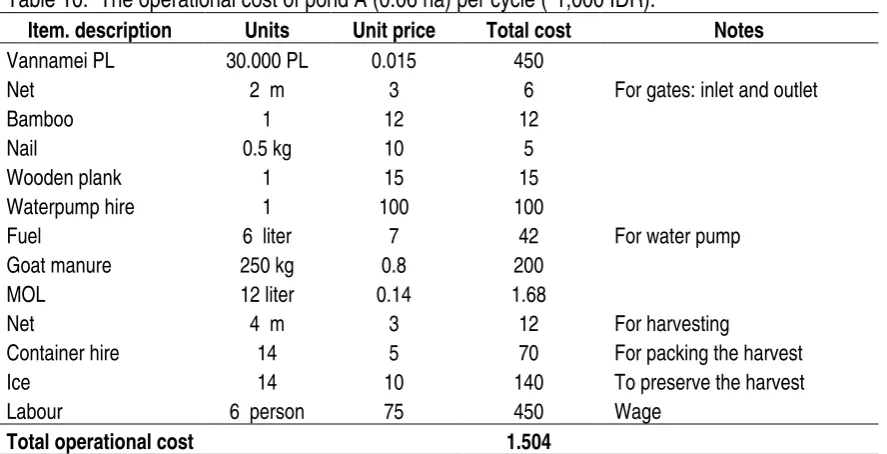
The labour accounted in the operational cost was mostly for pond preparation and dyke maintenance (Table 10). The harvest was mostly done with a broadcast and trap net, and can be done by one person. The yield for the 0.06 ha pond was 150 kg (Table 11) The gross margin for one cycle was IDR 5.696.320, and the B/C ratio was 379 %.
Table 10. The operational cost of pond A (0.06 ha) per cycle (*1,000 IDR).
Item. description Units Unit price Total cost Notes
Vannamei PL 30.000 PL 0.015 450
Total operational cost 1.504
Table 11 The mortality, yield and revenue from sales (*1,000 IDR) of pond A for one cycle.
Product MortalityThe farmer owning pond B is the team leader of the farmers group in this village. He has long experience in shrimp farming, however, so far the yield was very low.
9
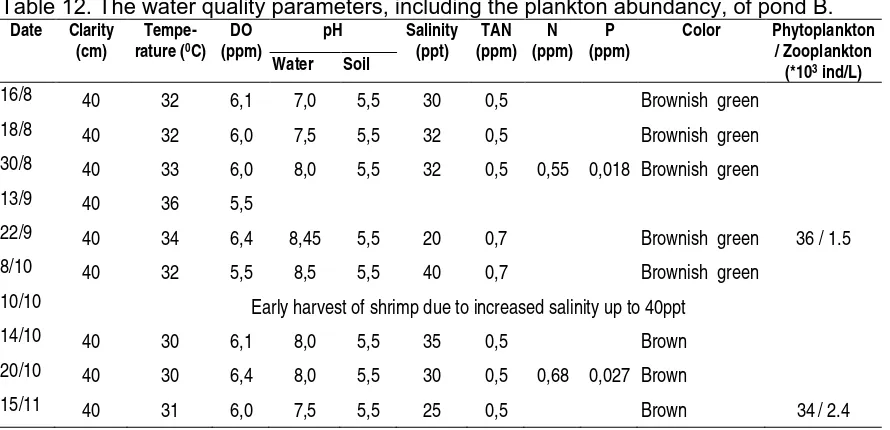
On 8 September, an early harvest of the shrimp was done because the water salinity increased up 40 ppt (Annex C-2), and the possibility to increase water exchange was limited at the end of the dry season. Another problem was the large difference between the water temperature within the pond; the upper layer was warmer than in the lower layer of the water column.
Table 12. The water quality parameters, including the plankton abundancy, of pond B.
Date Clarity
10/10 Early harvest of shrimp due to increased salinity up to 40ppt 14/10 40 30 6,1 8,0 5,5 35 0,5 Brown 20/10 40 30 6,4 8,0 5,5 30 0,5 0,68 0,027 Brown
15/11 40 31 6,0 7,5 5,5 25 0,5 Brown 34/ 2.4
The early harvest resulted in a low operational cost (Table 13) and yielded a harvest of 150 kg of well-sized shrimp (Table 14). The gross margin for one cycle was Rp 15.312.300 and the B/C ratio was 775%.
Table 13. The operational cost of Pond B (0.5 ha) for one cycle (*1,000 IDR)
Item description Units Unit price Total cost Notes
10
Table 14. The mortality, yield and revenue from sales (*1,000 IDR) of pond B for one cycle.
Product MortalityThe daily monitoring done by the farmer is shown in Annex C-3. The condition of pond’s water quality shown inTable. 16 . The clarity of the pond water was quite good, however, the salinity increased drastically up to 40 ppt. The brown water color indicate that the phytoplankton abundancy was reduced. The shrimp mortality was very high (70%) due to the drastic increase of salinity as well as the reduced growth of phytoplankton.
Table 15. Water quality parameters, including the plankton abundancy, of pond C
Date Clarity
10/19 Early harvesting due to increased water salinity up to 40 ppt
14/10 40 32 6,0 8,5 5 32 0,5 0,55 0,023 Brown 22 / 1.3
20/10 40 30 6,4 8,0 5 30 0,5 Brown
15/11 40 30 6,4 7,5 5 30 0,5 Brown
11
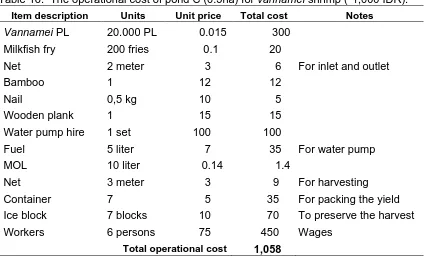
Table 16. The operational cost of pond C (0.5ha) for vannamei shrimp (*1,000 IDR). Item description Units Unit price Total cost Notes
Vannamei PL 20.000 PL 0.015 300
Total operational cost 1,058
Table 17. The mortality, yield and income from sales (*1,000 IDR) of pond C for one cycle.
Mortality (%) YieldThe farmer of pond D stocked 5,000 PL of tiger shrimp and 4,000 milk fish fry at the size of 4 cm. This farmer cultures seaweed Gracilaria in his pond to maintain the water quality; this is an example of an integrated multi tropic aquaculture (IMTA) system,
12
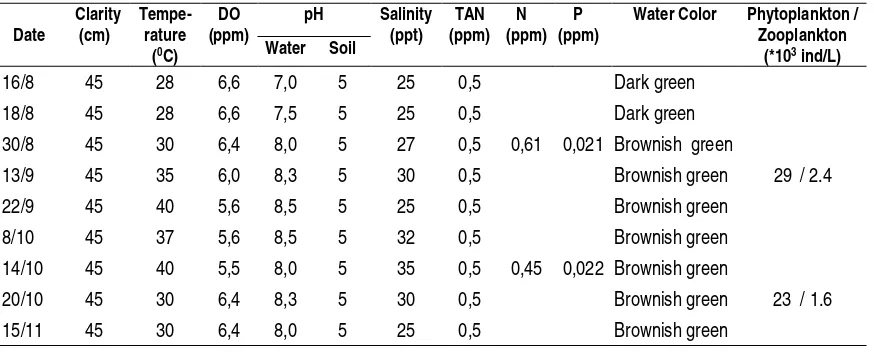
Table 18. Water quality parameters, including the plankton abundancy, of pond D
Date Clarity
Color Phytoplankton / Zooplankton
Early October, after 3,5 months cultivation, the milkfish was harvested because the farmer started the harvest of the shrimp. The milkfish had an average individual body weight of 150 g approximately (Table 20). The survival rate of the milk fish was quite good,
Table 19. The operational cost of Pond D (2 ha) for one cycle (*1,000 IDR).
Item description Units Unit price Total cost Notes
Monodon juvenile 5.000 PL 0.045 225
13
Compared to the other four ponds, the operational cost of this 2 ha pond are low (Table 19), and the income from the sales for one cycle was large (Table 20). This was reflected in the high gross margin (IDR 13,624,000) and a B/C ratio of more than 1100%.
Table 20: The mortality, yield and revenue from sales (*1,000 IDR) of pond D for one cycle.
Product MortalityThis traditional pond has only 1 sluice-gate for inlet and outlet of water (Table 9). The pond was first stocked with milkfish and vannamei shrimp, but this first stocking was lost due to the flood that ruined his pond dyke. Soon after the reconstruct the dyke, he stocked again. The second stocking was only vannamei shrimp in the first week of September.
The farmers fed rice bran and pellets, and added fertilizer to enhance the growth of lab-lab on which the milkfish feeds. The results of the daily monitoring done by the farmer can be found in Annex B-5. The DO of the pond water was good, but the pH was high (Table 21). The second half of the culture period the water color demonstrated that the availability of natural feed in the water was good, while the zoo- plankton abundancy remained relatively low.
Table 21. The water quality parameters, including the plankton abundancy, of pond E.
Date Clarity14
The operational cost presented included both the first and the second stocking (Table 22). The gross margin was close to Rp 6 million and the B/C ratio about 350 %.
Table 22. The operational cost of pond E (0.06 ha) for one cycle (*1000 IDR)
Item description Units Unit price Total cost Notes
Vannamei shrimp 4.000 PL 0.15 60 1st stocking (lost)
Milkfish fry 4,000 0.1 400 1st stocking (lost)
Vannamei shrimp 30.000 PL 0.15 450 2nd stocking
Net 2 meter 3 6 For Inlet and Outlet
Bamboo 1 12 12
Paku Kayu 0,5 kg 10 5
Wooden plank 1 15 15
Water pump hire 1 set 100 100
Fuel 6 liter 7 42 For water pump
Goat manure 250 kg 0.8 200
MOL 12 liter 0.14 1.68
Net 4 meter 3 12 For harvesting
Container 14 5 70 For packing the harvest
Ice block 14 blocks 10 140 To preserve the harvest
Worker 2 persons 75 150 Wages
TOTAL OPERATIONAL COST 1,464
Table 23: The mortality, yield and revenue from sales (*1,000 IDR) for one cycle of pond E.
Product Mortality(%)
Yield
(kg) Approx. weight (gr/pcs) Approx. numbers harvested Price / Unit Revenue from sales
Vannamei
60
200
16
12,000
0.3
3,600
15
5. Comparison of the results with baseline and project goals.
All monitored farmers used the MOL (Table 24). While four ponds were given the organic fertilizer recommended by the CFS, one got an industrial compost. Four of the five cultivated vannamei, the other farmed monodon. In one /two ponds milkfish was cultured.
Table 24. The dosage of fertilizer and feed used, and products and yield of the five ponds.
Farmer Fertilizer/feed applied Dosage of MOL Cultivated OrganismB Composted goat manure
and rice straw
- 20 L at early stage
- 3 L weekly until harvest Vannamei
200
C Composted goat manure
and rice straw
- 20 L at early stage
- 3L twice a week until harvest
Monodon 120
D Goat manure, rice straw and cattle rumen content
- 20 L at early stage
- 3 L twice a week until harvest
Milkfish 125
Vannamei 68
E Goat manure compost
Rice bran and pellets
- 20 L at early stage
- 3 L twice a week until harvest
Vannamei 3,330
The shrimp yield varied widely and was highest in pond E, where vannamei had been stocked at a high density and shrimp were fed industrial pellets. The baseline had found average yields of shrimp and milkfish of 43 and 192 kg/ha/yr, respectively. The lowest milkfish yield was 125 kg/ha and the best 5,000 kg/ha, while the average shrimp yield for the five ponds was close to 880 kg/ha for one cycle. For the three LEISA farmers the shrimp yield per ha was three times higher and for the other two 20 times higher for one cycle than the average found in the Demak baseline for one full year.
Figure 1: A harvested
monodon
16
The sales from shrimp provided by far the largest part of the revenues (Table 25). The average B/C ratio was about 570%. The farmers with the smallest ponds, who did add commercial fertilizer or feed and stocked a higher density of shrimp, reached the highest gross margin per ha. The average gross margin (income) was IDR 46 million/cycle, i.e. 4.5 times higher, but for the three LEISA farmers this was IDR 14 million/cycle, i.e. 40% higher than the average found in the Demak baseline for one full year (10 million IDR/ha per year).
In principle farmers can do at least two cycles per year. Thus their income can more than double when implementing the LEISA system learned during the CFS. When complementing the MOL with industrial compost (pond A) or feed (pond B) the income can increase dramatically.
17
6. Conclusion
The UNDIP team monitored five ponds of four shrimp farmers in Tambakbulusan during the year they followed the Coastal Field school curriculum. The four implemented fully or partly the promoted LEISA technology already. The concurrent implementation means that team will have to collect historical information on the performance of all sampled farmers before their training.
For one production cycle only, the shrimp production was three times higher for the three LEISA farmers and for the two farmers who added industrial manure or feed this was 20 times higher than the average found in the Demak baseline for one full year. The average gross margin (income) was IDR 46 million/cycle, i.e. 4.5 times higher, but for the three LEISA farmers this was IDR 14 million/cycle, i.e. 40% higher than the average found in the Demak baseline for one full year. The average ratio gross margin / operational cost was about 570%.
18
Annex A. The Dissolved oxygen in the water at different eater salinity and temperature at 760 mmHg air pressure (Stirling et al., 1985)
Temperature 0
C
Salinity (ppt)
0 5 10 15 20 25 30 3
4 13,1 12,7 12,2 11,8 11,5 10,7 10,7 10,3
6 12,5 12,1 11,6 12,25 10,9 10,2 10,2 9,8
8 11,8 11,45 11,1 10,7 10,4 9,7 9,7 9,4
10 11,3 10,9 10,6 10,2 9,9 9,3 9,2 9,0
12 10,8 10,45 10,1 9,8 9,5 8,9 8,8 8,6
14 10,3 9,95 9,7 9,4 9,1 8,6 8,5 8,2
16 9,9 9,55 9,3 9,0 8,7 8,2 8,1 7,9
18 9,5 9,15 8,9 8,6 8,4 7,9 7,8 7,6
20 9,1 8,8 8,6 8,3 8,1 7,6 7,7 7,3
22 8,7 8,6 8,3 8,1 7,9 7,5 7,4 7,2
24 8,4 8,3 8,1 7,8 7,6 7,1 7,1 6,9
26 8,1 8 7,7 7,5 73 6,8 6,8 6,6
28 7,8 7,7 7,5 7,3 7,0 6,6 6,6 6,4
30 7,6 7,4 7,2 7,0 6,8 6,4 6,4 6,1
32 7,3 7,2 7 6,9 6,6 6,1 6,1 5,9
34 7,1 7 6,9 6,7 6,4 6,0 6,0 5,8
36 6,9 6,8 6,7 6,5 6,2 5,9 5,9 5,7
38 6,7 6,6 6,5 6,4 6,1 5,7 5,7 5,6
19
20 Annex C: The Water Quality Parameters
Table C-1 The daily monitoring water quality done by farmer A.
Day
Date Clarity (cm)
Temperature (0C) Salinty (ppt) pH
Water
Color Notes
Morning Noon After noon Morning Noon After noon Morning Noon After noon
Sun 21/08 35 37 7 Brown Sunny
Mon 22/08 30 36 7 Sunny, morning to noon; cloudy afternoon
Tues 23/08 29 36 7 Sunny
Wends 24/08 35 37 7 Sunny
Thurs 25/08 29 37 7 Brown Sunny
Friday 26/08 35 37 7 Sunny
Satt 27/08 30 36 7 Sunny, morning to noon; cloudy afternoon
Sun 28/08 29 36 7 Sunny
Mon 29/08 34 22 7 Cloudy
Tues 30/08 29 30 7
Wends 31/08 32 30 7
Thurs 01/09 30 30 7
Friday 02/09 29 29 7 Green
Satt 03/09 29 35 7
Sun 04/09 35 37 7
Mon 05/09 35 37 7 Sunny
Tues 06/09 29 37 7 Green Sunny
Wends 07/09 35 37 7 Sunny
Thurs 08/09 30 36 7 Sunny
Friday 09/09 29 36 7 Sunny
Satt 10/09 34 22 7 Sunny
Sun 11/09 29 30 7 Raining at night
21
Tues 13/09 30 30 7 Sunny
Wends 14/09 29 29 7 Sunny
Thurs 15/09 29 35 7 Sunny
Friday 16/09 34 30 7 Sunny
Satt 17/09 34 32 7 Brown Sunny
Sun 18/09 30 33 7 Sunny
Mon 19/09 32 33 8 Sunny
Tues 20/09 34 32 8
Wends 21/09 32 30 7
Thurs 22/09 30 32 7
Friday 23/09 35 37 7 Brown
Satt 24/09 30 36 7
Sun 25/09 29 36 7
Sun 26/09 35 37 7
Mon 27/09 29 37 7 Brown
Tues 28/09 35 37 7
Wends 29/09 30 36 7
Thurs 30/09 29 36 7
Friday 01/10 34 22 7
Satt 02/10 29 30 7
Sun 03/10 32 30 7
Mon 04/10 30 30 7
Tues 05/10 29 29 7 Green
Wends 06/10 29 35 7
Thurs 07/10 35 37 7
Friday 08/10 35 37 7
Satt 09/10 29 37 7 Green
22
Table C-2. The daily monitoring of water quality of pond B, used to culture Monodon Shrimp (to 11 October 2016)
Day Date Clarity (cm)
Temperature (0C) Salinty (ppt) pH
Water Color
Notes
Morning Noon After
noon Morning Noon After
noon Morning Noon
After noon
Sun 21/08 40 30 30 31 26 25 25 7 7 7 Brown Sunny
Mon 22/08 40 25 32 28 24 27 27 7 7 7 Brown Sunny, morning to noon; cloudy afternoon
Tues 23/08 40 26 32 31 28 27 27 7 8 7 Brown Sunny
Wends 24/08 40 26 32 31 28 28 28 7 7 7 Brown Sunny
Thurs 25/08 40 29 32 30 28 27 28 7 7 7 Brown Sunny
Friday 26/08 40 26 31 32 30 29 27 7 7 8 Brown Sunny
Satt 27/08 40 27 33 33 30 29 29 7 7 7 Brown Sunny, morning to noon; cloudy afternoon
Sun 28/08 40 27 33 32 29 29 29 7 7 7 Brown Sunny
Mon 29/08 40 30 34 31 30 30 30 7 8 7 Brown Cloudy
Tues 30/08 40 29 32 33 31 30 30 7 7 7 Greenish brown
Wends 31/08 40 28 34 33 33 30 30 7 7 7 Greenish brown
Thurs 01/09 40 27 33 31 31 31 30 7 7 7 Greenish brown
Friday 02/09 40 27 34 31 31 30 30 7 7 7 Greenish brown
Satt 03/09 40 30 34 32 31 31 31 7 7 8 Greenish brown
Sun 04/09 40 30 30 31 26 31 31 7 7 Greenish brown
Mon 05/09 40 32 33 32 31 31 31 7 7 7 Greenish brown
Tues 06/09 40 31 33 31 31 32 32 7 7 7 Greenish brown
Wends 07/09 40 31 33 31 32 32 32 7 7 7 Greenish brown
Thurs 08/09 40 32 33 33 32 31 31 7 7 7 Greenish brown
Friday 09/09 40 33 34 33 31 31 31 7 7 7 Greenish brown
Satt 10/09 40 32 33 33 31 31 31 7 7 7 Greenish brown
Sun 11/09 40 31 34 32 31 31 32 7 7 7 Greenish brown
Mon 12/09 40 32 33 32 32 31 32 7 7 7 Greenish brown
23
Wends 14/09 40 35 36 33 32 32 32 7 7 7 Greenish brown
Thurs 15/09 40 35 35 35 32 33 32 7 7 7 Greenish brown
Friday 16/09 40 33 34 35 32 33 32 7 7 7 Greenish brown
Satt 17/09 40 33 34 34 32 33 33 7 7 7 Greenish brown
Sun 18/09 40 33 33 33 33 34 33 7 7 7 Greenish brown
Mon 19/09 40 33 34 33 32 33 32 7 7 7 Greenish brown
Tues 20/09 40 32 35 35 31 31 32 8 8 7 brown
Wends 21/09 40 32 34 34 31 32 32 8 8 7 brown
Thurs 22/09 40 32 35 35 33 33 33 8 8 7 brown
Friday 23/09 40 32 35 34 32 32 32 8 8 8 brown
Satt 24/09 40 32 33 32 31 32 32 8 8 8 brown
Sun 25/09 40 32 33 32 31 32 31 8 8 8 brown
Mon 26/09 40 31 33 32 31 32 32 8 8 8 brown
Tues 27/09 40 32 34 33 31 31 31 8 8 8 brown
Wends 28/09 40 31 35 32 31 31 31 8 8 8 brown
Thurs 29/09 40 32 35 33 32 32 32 8 8 8 brown
Friday 30/09 40 32 35 33 32 32 32 8 8 8 brown
Satt 01/10 40 31 34 31 32 32 32 8 8 8 brown
Sun 02/10 55 32 35 32 31 32 32 8 8 8 brown
Mon 03/10 50 31 33 33 31 32 32 7 7 7 brown
Tues 04/10 50 32 34 33 32 33 33 7 7 7 brown
Mon 05/10 50 32 33 34 34 34 34 7 7 7
Tues 06/10 50 32 33 33 34 33 34 8 8 8
Wends 07/10 50 33 32 33 35 35 35 7 7 7
Thurs 08/10 50 33 33 34 40 40 40 8 8 8
Friday 09/10 50 32 33 34 40 40 40 8 8 8
24
Annex C-3. The daily monitoring water quality done in Pond C (same farmer as B) for Vannamei Shrimp.
Day Date Clarity (cm)
Temperature (0C) Salinty (ppt) pH
Water Color
Notes
Morning Noon After
noon Morning Noon
After
noon Morning Noon
After noon
Sun 21/08 40 32 32 32 32 33 33 7 7 7 Brown Sunny
Mon 22/08 40 32 33 32 32 32 33 7 7 7 Brown Sunny, morning to noon; cloudy afternoon
Tues 23/08 40 32 33 32 33 33 33 7 7 7 Brown Sunny
Wends 24/08 40 33 33 33 32 32 33 7 7 7 Brown Sunny
Thurs 25/08 40 32 32 32 33 33 33 7 7 7 Brown Sunny
Friday 26/08 40 32 34 32 32 32 32 7 7 7 Brown Sunny
Satt 27/08 40 32 33 33 34 34 34 7 7 7 Brown Sunny, morning to noon; cloudy afternoon
Sun 28/08 40 31 32 32 33 33 33 7 7 7 Brown Sunny
Mon 29/08 40 32 31 31 32 32 32 7 7 7 Brown Cloudy
Tues 30/08 40 32 33 32 33 33 33 7 7 7 Brown
Wends 31/08 40 32 33 32 33 33 33 7 7 7 Brown
Thurs 01/09 40 32 32 32 33 34 33 7 7 7 Brown
Friday 02/09 40 31 31 31 32 33 33 7 7 7 Brown
Satt 03/09 40 31 32 31 33 33 34 7 7 7 Brown
Sun 04/09 40 32 32 32 32 33 33 7 7 7 Brown
Mon 05/09 40 31 32 32 33 33 33 7 7 7 Brown Sunny
Tues 06/09 40 31 32 32 33 33 33 7 7 7 Brown Sunny
Wends 07/09 40 32 33 32 33 34 34 7 7 7 Brown Sunny
Thurs 08/09 40 32 32 32 33 33 32 7 7 7 Brown Sunny
Friday 09/09 40 31 32 32 33 33 33 7 7 7 Brown Sunny
Satt 10/09 40 31 33 33 36 36 36 8 8 8 Brown Sunny
Sun 11/09 40 32 33 34 35 35 35 8 8 8 Brown Raining at night
Mon 12/09 40 32 33 34 35 35 37 8 8 8 Brown Sunny
25
Wends 14/09 40 31 32 31 35 35 35 8 8 8 Brown Sunny
Thurs 15/09 40 31 33 32 38 38 38 8 8 8 Brown Sunny
Friday 16/09 40 31 32 32 39 39 39 8 8 8 Brown Sunny
Satt 17/09 40 32 33 32 40 40 40 8 8 8 Brown Sunny
Sun 18/09 40 31 33 32 38 38 38 8 8 8 Brown Sunny
Mon 19/09 40 31 32 32 38 38 38 8 8 8 Brown Sunny
Tues 20/09 40 31 32 32 35 35 36 8 8 8 Brown
Wends 21/09 40 30 32 31 35 35 35 8 8 8 Brown
Thurs 22/09 40 30 32 31 36 36 36 8 8 8 Brown
Friday 23/09 40 31 32 31 36 37 37 8 8 8 Brown
Satt 24/09 40 31 32 31 35 35 36 8 8 8 Brown
Sun 25/09 40 31 33 31 34 35 35 8 8 8 Brown
Sun 26/09 40 32 32 31 34 34 34 8 8 8 Brown
Mon 27/09 40 31 33 31 32 32 32 8 8 8 Brown
Tues 28/09 40 31 32 30 32 32 32 8 8 8 Brown
Wends 29/09 40 31 32 31 33 33 32 8 8 8 Brown
Thurs 30/09 40 31 32 30 33 33 33 8 8 8 Brown
Friday 01/10 40 30 32 31 32 32 32 8 8 8 Brown
Satt 02/10 40 32 32 31 33 33 32 8 8 8 Brown
Sun 03/10 40 31 33 31 32 32 32 8 8 8 Brown
Mon 04/10 40 31 33 31 32 32 32 8 8 8 Brown
Tues 05/10 40 29 30 30 30 31 30 7 7 7 Brown
Wends 06/10 40 30 30 30 30 31 30 7 7 7 Brown
Thurs 07/10 40 30 31 31 30 31 30 7 7 7 Brown
Friday 08/10 40 29 30 30 30 30 30 7 7 7 Brown
Satt 09/10 40 29 30 30 30 30 30 7 7 7 Brown
26
Annex C-4. The data daily collected on water quality in Pond D (from 21 August to 11 October 2016)
Day Date Clarity (cm)
Temperature (0C) Salinty (ppt) pH
Water Color
Notes
Morning Noon After
noon Morning Noon
After
noon Morning Noon
After noon
Sun 21/08 35 26 26 32 30 30 30 7 7 7 Sunny
Mon 22/08 45 26 26 26 30 30 30 7 7 7 Sunny, morning to noon; cloudy afternoon
Tues 23/08 40 27 33 33 30 30 30 7 7 7 Sunny
Wends 24/08 40 27 32 32 30 30 30 7 7 7 Sunny
Thurs 25/08 40 30 30 31 30 30 30 7 7 7 Sunny
Friday 26/08 40 28 33 33 30 30 30 7 7 7 Sunny
Satt 27/08 40 29 34 34 30 28 29 7 7 7 Sunny, morning to noon; cloudy afternoon
Sun 28/08 40 30 34 34 29 29 29 7 7 7 Sunny
Mon 29/08 40 32 32 34 29 30 30 7 7 7 Cloudy
Tues 30/08 40 29 34 31 30 30 28 7 7 7
Wends 31/08 40 29 34 34 31 28 28 7 7 7
Thurs 01/09 40 29 35 34 30 28 30 7 7 7
Friday 02/09 40 31 35 34 30 30 30 7 7 7
Satt 03/09 40 29 34 35 30 30 30 7 7 7
Sun 04/09 40 29 34 34 30 30 30 7 7 7
Mon 05/09 40 29 33 34 30 30 30 7 7 7 Sunny
Tues 06/09 40 28 34 33 30 29 29 7 7 7 Sunny
Wends 07/09 40 33 34 34 30 30 30 7 7 7 Sunny
Thurs 08/09 40 30 35 35 30 30 30 7 7 7 Sunny
Friday 09/09 45 27 34 34 25 20 20 7 7 7 Sunny
Satt 10/09 45 28 35 35 25 25 25 7 7 7 Sunny
Sun 11/09 45 28 33 33 25 25 25 7 7 7 Raining at night
Mon 12/09 45 28 34 34 27 25 25 7 7 7 Sunny
27
Wends 14/09 45 29 34 33 27 27 27 7 7 7 Sunny
Thurs 15/09 40 29 34 34 30 30 30 7 7 7 Sunny
Friday 16/09 40 29 33 34 30 30 30 7 7 7 Sunny
Satt 17/09 40 28 34 33 30 29 29 7 7 7 Sunny
Sun 18/09 40 33 34 34 30 30 30 7 7 7 Sunny
Mon 19/09 40 33 33 33 28 25 27 7 7 7 Sunny
Tues 20/09 40 33 34 33 28 27 27 7 7 7
Wends 21/09 40 32 33 33 28 27 27 7 7 7
Thurs 22/09 40 32 34 33 28 27 27 7 7 7
Friday 23/09 40 32 33 33 27 27 27 7 7 7
Satt 24/09 40 31 33 33 27 25 25 7 7 7
Sun 25/09 40 31 32 33 20 20 20 7 7 7
Sun 26/09 40 29 30 30 23 22 21 7 7 7
Mon 27/09 40 29 29 29 20 20 20 7 7 7
Tues 28/09 40 30 30 30 20 20 20 7 7 7
Wends 29/09 40 29 30 29 20 20 20 7 7 7
Thurs 30/09 40 30 30 29 20 20 20 7 7 7
Friday 01/10 40 29 30 30 20 20 20 6 6 6
Satt 02/10 40 29 29 28 20 20 20 6 6 6
Sun 03/10 40 29 29 28 20 20 20 6 6 6
Mon 04/10 40 28 29 29 20 20 20 6 6 6
Tues 05/10 40 28 29 29 20 20 20 6 6 6
Wends 06/10 40 28 29 29 15 16 16 6 6 6
Thurs 07/10 40 28 29 28 20 20 20 6 6 6
Friday 08/10 40 28 29 29 10 10 10 6 6 6
28
Annex C-5. The daily monitoring water quality done in Pond E (from 21 August to 11 October 2016)
Day Date Clarity (cm)
Temperature (0C) Salinty (ppt) pH
Water Color
Notes
Morning Noon After
noon Morning Noon
After
noon Morning Noon
After noon
Sun 21/08 40 28 30 31 25 25 7 7 Brown Sunny
Mon 22/08 40 25 32 28 24 27 27 7 7 7 Brown Sunny, morning to noon; cloudy
afternoon
Tues 23/08 40 26 32 31 28 27 27 7 7 7 Brown Sunny
Wends 24/08 40 26 32 31 28 28 28 7 7 7 Brown Sunny
Thurs 25/08 40 29 32 30 28 27 28 7 7 7 Brown Sunny
Friday 26/08 40 26 31 32 30 29 27 7 7 7 Brown Sunny
Satt 27/08 40 27 33 33 30 29 29 7 7 7 Brown Sunny, morning to noon; cloudy
afternoon
Sun 28/08 40 27 33 32 29 29 29 7 7 7 Brown Sunny
Mon 29/08 40 30 34 31 30 30 30 7 7 7 Brown Cloudy
Tues 30/08 40 29 32 33 31 30 30 7 7 7 Brown
Wends 31/08 40 28 34 33 33 30 30 7 7 7 Brown
Thurs 01/09 40 27 33 31 31 31 30 7 7 7 Brown
Friday 02/09 40 27 34 31 31 30 30 7 7 7 Brown
Satt 03/09 40 30 34 32 31 31 31 7 7 7 Brown
Sun 04/09 40 28 34 33 32 32 32 7 7 7 Brown
Mon 05/09 40 27 32 32 33 33 32 7 7 7 Brownish green Sunny
Tues 06/09 40 27 32 32 34 33 32 7 7 7 Brownish green Sunny
Wends 07/09 40 28 32 32 33 34 32 7 7 7 Brownish green Sunny
Thurs 08/09 40 28 32 32 32 33 33 7 7 7 Brownish green Sunny
Friday 09/09 40 28 32 32 32 33 32 7 7 7 Brownish green Sunny
Satt 10/09 40 28 32 32 33 34 32 7 7 7 Brownish green Sunny
Sun 11/09 40 28 33 33 32 33 32 7 7 7 Brownish green Raining at night
29
Tues 13/09 40 27 33 33 33 32 32 7 7 7 Brownish green Sunny
Wends 14/09 40 27 32 32 33 33 32 7 7 7 Brownish green Sunny
Thurs 15/09 40 28 33 32 32 33 33 7 7 7 Brownish green Sunny
Friday 16/09 40 28 32 32 32 33 33 7 7 7 Brownish green Sunny
Satt 17/09 40 27 32 33 31 33 32 7 7 7 Brownish green Sunny
Sun 18/09 40 28 32 32 32 32 32 7 7 7 Brownish green Sunny
Mon 19/09 40 27 33 32 32 33 32 7 7 7 Brownish green Sunny
Tues 20/09 40 27 32 32 33 33 32 7 7 7 Brownish green
Wends 21/09 40 28 33 33 30 32 31 6,5 6,3 6,4 Brownish green
Thurs 22/09 40 28 32 33 29 30 31 6,4 6,3 6,4 Brownish green
Friday 23/09 40 28 33 33 27 29 30 6,1 6,3 6,2 Brownish green
Satt 24/09 40 27 33 33 26 28 28 6,2 6,3 6,2 Brownish green
Sun 25/09 40 27 33 32 26 27 27 6,3 6,4 6,4 Brownish green
Sun 26/09 40 28 32 33 25 26 27 6,2 6,1 6,2 Brownish green
Mon 27/09 40 28 33 33 25 26 25 6,3 6,2 6,3 Brownish green
Tues 28/09 40 28 33 33 25 27 25 6,4 6,2 6,3 Brownish green
Wends 29/09 40 28 34 33 25 25 25 6,3 6,2 6,3 Brownish green
Thurs 30/09 40 28 34 32 23 24 24 6,4 6,2 6,3 Brownish green
Friday 01/10 40 27 34 32 23 24 24 6,3 6,1 6,2 Brownish green
Satt 02/10 40 27 34 32 22 24 23 6,3 6,1 6,1 Brownish green
Sun 03/10 40 27 33 32 22 23 23 6,3 6,2 6,2 Brownish green
Mon 04/10 40 27 33 32 21 22 22 6,3 6,2 6,2 Brownish green
Tues 05/10 40 27 32 32 20 22 21 6,2 6,1 6,2 Brown
Wends 06/10 40 27 30 31 20 23 22 6,3 6,2 6,2 Brown
Thurs 07/10 40 27 31 30 20 22 21 6,3 6,2 6,3 Brown
Friday 08/10 40 27 30 30 21 23 21 6,4 6,2 6,3 Brown
Satt 09/10 40 28 30 30 20 22 21 6,3 6,2 6,3 Brown
30
Annex D: Results of the Demonstration plot
D.1. Demplot (Demonstration Pond)
The brackish water pond belonging to pak Bakri was chosen as the demonstration pond by the pond farmers group supported by the CFS team. This pond was chosen because its accessibility to the main road, as well as its water supply. The
pond area is 4000 m2. The knowledge from the CFS on pond management as
mentioned above was applied. The characteristics of the demonstration pond is shown in Table D-1.
After the drying of the demopond the farmers applied 400 kg industrial goat compost and 20 liters of mol on the pond bottom. This was done in the evening when the wheather is cool so that the bacteria will remain active. Then the pond was gradually filled to the desire depth and left for one week before stocking.
Table D-1. The characteristics of the demonstration pond of the CFS in 2016.
- Pond area - ± 4,000 m2
- Water depth - ± 1 m
- Production management system - Extensive
- Water circulation system - separated Inlet and outlet
- Number of water gate - 2
- Water supply - Canal
- Pond Management - Pond bottom drying for 5 days
- 400 kg of industrial goat compost - 20 L of MOL for 1 months
- Afterwards 5 L of MOL every 3 days depended on the water colour
- Cultivated organisms - Tiger shrimp (P monodon) and milkfish
- The stocking density of the shrimp - 15,000 of PL 20
- The stocking density of milkfish fry - 200 fries at the length size 3-5 cm
- Date of stocking - 2 Augustus 2016
31
was no shrimp harvest. Fortunately, the milkfish was less affected by the low water quality and its cultivation continued. However, the milkfish yield was 100 fish only, at an average body weight of 200 gram. The demplot pond was considered to have failed: 100% mortality of the shrimp and about 50% of the milkfish stocked was lost. The condition of pond’s water quality shown inTable D-2 and the daily monitoring done by the farmer is shown in Table D-5.
Table D-2. Water quality parameters monitoring
Date Clarity
Pond water Color Phytoplankton / Zooplankton
The operational cost and the benefit is presented in Tables D3 and D-4. The lost was IDR 1.502.100, The C/B ratio was 82 % (82% lost)
Table D-3. Operational Cost (*1000 IDR) of demonstration pond for one cycle.
Materials Units Unit price Total Notes
32
Table D-4: The Mortality, Yield, Revenues (*1000 IDR) of the demonstration pond for one cycle.
Yield Unit Price / Unit
(Rp) Total (Rp) Notes
Vannamei shrimp Failed - - 100%
Milkfish 100 fish 3.4 340. The milkfish yield was
100 fish only, at an average body weight of 200 gram . The mortality was50%
33
Table D-5. The daily monitoring water quality done by the farmer at demonstration pond (from 21 August to 11 October 2016)
Day Date Clarity (cm)
Temperature (0C) Salinty (ppt) pH
Water Color
Notes
Morning Noon After noon Morning Noon noon After Morning Noon After noon
Sun 21/08 45 29 30 31 25 25 25 7 7 7 Brown Sunny
Mon 22/08 50 27 30 30 27 25 25 7 7 7 Brown Sunny, morning to noon; cloudy afternoon
Tues 23/08 50 26 30 32 25 25 25 7 7 7 Brown Sunny
Wends 24/08 45 26 31 31 26 25 25 7 7 7 Brown Sunny
Thurs 25/08 45 29 31 31 25 25 25 7 7 7 Brown Sunny
Friday 26/08 48 28 31 35 27 25 25 7 7 7 Brown Sunny
Satt 27/08 50 29 33 33 26 25 25 7 7 7 Brown Sunny, morning to noon; cloudy afternoon
Sun 28/08 48 27 33 33 25 25 25 7 7 7 Brown Sunny
Mon 29/08 42 29 33 33 26 25 25 7 7 7 Brown Cloudy
Tues 30/08 48 29 33 33 25 25 25 7 7 7 Brown
Wends 31/08 48 30 32 33 26 25 25 7 7 7 Brown
Thurs 01/09 48 30 33 33 25 25 25 7 7 7 Brown
Friday 02/09 50 30 33 34 27 25 25 7 7 7 Brown
Satt 03/09 50 31 33 33 26 25 25 7 7 7 Brown
Sun 04/09 46 30 32 32 25 25 25 7 7 7 Brown
Mon 05/09 60 29 34 35 30 30 30 7 7 7 Sunny
Tues 06/09 60 29 34 34 30 30 30 7 7 7 Sunny
Wends 07/09 55 29 33 34 30 30 30 7 7 7 Sunny
Thurs 08/09 55 28 34 33 30 29 29 7 7 7 Sunny
Friday 09/09 55 33 34 34 30 30 30 7 7 7 Sunny
Satt 10/09 55 30 35 35 30 30 30 7 7 7 Sunny
34
Mon 12/09 45 28 35 35 25 25 25 7 7 7 Sunny
Tues 13/09 45 28 33 33 25 25 25 7 7 7 Sunny
Wends 14/09 45 28 34 34 27 25 25 7 7 7 Sunny
Thurs 15/09 45 31 34 34 27 25 25 7 7 7 Sunny
Friday 16/09 45 29 - - 27 - - 7 - - Sunny
Satt 17/09 60 29 34 35 30 30 30 7 7 7 Sunny
Sun 18/09 60 29 34 34 30 30 30 7 7 7 Sunny
Mon 19/09 55 29 33 34 30 30 30 7 7 7 Sunny
Tues 20/09 55 33 33 34 29 29 29 7 7 7
Wends 21/09 55 32 33 34 30 30 30 7 7 7
Thurs 22/09 60 32 33 33 29 29 29 7 7 7
Friday 23/09 60 32 32 32 29 29 29 7 7 7
Satt 24/09 55 30 32 32 29 29 29 7 7 7
Sun 25/09 60 31 32 32 29 29 29 7 7 7
Sun 26/09 55 30 31 31 29 29 29 7 7 7
Mon 27/09 60 32 32 32 27 27 27 7 7 7
Tues 28/09 50 33 32 32 29 29 29 7 7 7
Wends 29/09 55 33 32 32 27 27 27 7 7 7
Thurs 30/09 60 31 32 32 27 27 27 7 7 7
Friday 01/10 - - - -
Satt 02/10 55 31 31 31 28 28 28 7 7 7
Sun 03/10 - - - -
Mon 04/10 60 31 31 31 25 26 25 8 8 8
Tues 05/10 - - - -
Wends 06/10 - - - -
Thurs 07/10 55 30 30 29 25 25 25
Friday 08/10 60 29 30 30 25 25 25
35